Volume 12, No. 1, Art. 16 – January 2011
The Economic Crisis Though the Eyes of Transana
Paul G. Dempster & David K. Woods
Abstract: For the KWALON 2010 conference, several software representatives were given a common data set consisting of text and media files about the financial crisis of 2008 – 2009. This paper focuses on the process of analyzing the media files in this data set using Transana, a software package designed for the transcription and qualitative analysis of video and audio data. The authors describe several styles of transcription used in the process of making sense of the data, the selection and coding of analytically interesting segments of the media files, and working with coded data to develop a coherent narrative from this data. They also describe their collaborative process, as facilitated by the software, and how that affected the analysis of the data. Finally, the authors describe the results of their analysis in terms of the multi-layered narrative of the data, and discuss the limitations of that analysis.
Key words: qualitative analysis; CAQDAS; video data; audio data; KWALON 2010 Conference; Transana
Table of Contents
1. Introduction
2. The Data Set
2.1 Data decisions
2.2 Preparing the data
2.3 The final data set
3. Method
3.1 Converting files and bringing them into the software
3.2 Transcription
4. Collaborative Analysis
4.1 Data analysis
4.2 Creating clips and coding
4.3 Creating analytical memos and sharing insights
4.4 Using tools (maps) to develop arguments
4.5 Searching the data
5. Results
5.1 Financial mechanisms
5.2 Political underpinnings and the role of politicians in the financial crisis
5.3 Down the rabbit hole
6. Conclusion
Appendix: Media File Information by Date Recorded or Published
The original explorative question posed at the KWALON 2010 conference was "Is qualitative software comparable?" Rather than getting academics to answer the question through a series of papers and plenaries, representatives from several software packages were provided with a common data set and a common set of research questions, and were asked to describe how they used their software to analyze this data set1). This paper is the result of one of the analytic journeys set in motion to explore this question. [1]
This paper discusses the conference data, and the methodology and findings of the researchers using Transana, a qualitative software package primarily designed for the transcription and qualitative analysis of video and audio data. It describes several different approaches to transcription of media-based data, describes the coding process, and discusses the analytic process of making sense of that coded data, before discussing the implications that collaborative team work had for understanding and interpreting the common data set as it was presented. [2]
The focus of the KWALON data set was the global economic crisis of 2008 – 2009. The data set consisted of approximately 168 text sources taken from newspapers, web sites, and web blogs, as well as approximately 40 video and audio files also captured from the world wide web (see Appendix 1: Media File Information by date recorded or published). Data files were drawn from many different sources and several different countries, although all of the data was in the English language. [3]
The text data were taken from two time periods, June 2008 and June 2009. The video and audio data were also mostly taken from 2008 and 2009, but were not restricted to the month of June of each year. [4]
The common data set seemed to be designed in such a way that very different software packages could participate in the experiment. Thus there was a huge amount of data available in many different formats. As an issue of resource allocation, the lead developer of Transana made a practical decision that, because there was more data here than could be fully analyzed in the time available, it was necessary to focus on a portion of the data set. Transana is specifically designed to work with video and audio data, so it was decided that it would be best to work with as much of the video and audio data as possible and to supplement with text-based data as time allowed. A technique has been developed which facilitates the importation of text only data in Transana (see Nicholas SHEON, 2007). [5]
From the original set of media files, one media file was eliminated from the original data set because technical problems with the file prevented the necessary format conversion. The data file provided by KWALON had an encoding glitch, which prevented it from working properly, and the original source URL could not be located on the internet despite repeated searches, preventing re-capture of the data in question. Two related media files were eliminated when the researcher determined they were recorded in 2005, well outside the parameters for the KWALON experiment. Several other files, which were individual parts of a longer narrative, were combined using video editing software to restore the conceptual continuity of the original material during analysis. For instance, one of the files was identified as "part one of nine," so the other eight parts of the original presentation were captured and combined with the original file. [6]
Given that one of the research questions focused on whether the discussion of the economic crisis differed from 2008 to 2009, it was decided that the internet source of each file should be tracked down. While the conference organizers presented some information about where the data was collected, the documentation was incomplete as it originally stood. The source URL, recording or publishing date of the media file (as accurately as could be determined), and information about the source and participants was recorded for each file. Adequate date, speaker identity, and source information for three of the media files from the original data set could not be determined, so these files were dropped from the final data analysis. [7]
The final data set for this analysis ended up consisting of 35 video and audio files, with a total time of 6 hours and 58 minutes of media data. 20 of these files (57% of the files) were 5 minutes long or shorter, comprising a total of 50 minutes (12% of the total) of media data. 12 (34%) of the files were between 5 and 25 minutes long, for a total of 2 hours 19 minutes (34%) of media data. Finally, 3 files (9%) were between 60 and 90 minutes long, for a total of 3 hours 49 minutes of media data (54% of the total). [8]
3.1 Converting files and bringing them into the software
The first step in the analytic process was to convert all of the media files to forms that work within Transana. The conference data was provided in a variety of formats, including *.mpg, *.mp4, *.mp3, *.avi, *.wmv, and *.flv. Of these formats, only the *.flv files needed to be converted before use in Transana. There are a large number of video conversion programs available for free or inexpensively on the internet for converting between particular formats. We used a program called Free FLV Converter, which did the job quite nicely. [9]
The next part of the process involved bringing all media files into the software. Transana's Batch Episode Creation tool is a simple time saving utility, which was used to bring all of the media files into the software in a single user action. Essentially, all media files of interest are located using a file browser menu and these are then imported, with Transana automatically creating the necessary data structures for representing the raw data files within the software. [10]
As part of the experiment a running tally of time spent was kept. This was important, as there was a desire to find out how much time was spent in each package to achieve the results presented. The total time involved in media organization, finding an appropriate conversion utility (since we didn't already have one for the Flash Video format), file conversion, and data ingestion was less than one hour. [11]
While it is not absolutely necessary for working within Transana, transcription plays an important, albeit supplementary, role in the analysis of media data. As a result, all of the media files were transcribed as a first analytic pass through the data. Most of the shorter media files, those 25 minutes or less in length, were transcribed verbatim. However, verbatim transcription was not analytically sufficient for some of the media files, and some of the longer files were handled using alternate, more efficient forms of transcription. [12]
3.2.1 Subtlety within the visual image
A small number of the shorter media files were partially or completely visual in nature, with no verbal content or with important information conveyed through images that was not referenced in the accompanying dialog. Descriptive transcripts were created for these pieces. For example, one piece, "The Square Mile" (COOMBES, 2008), was an auditory and visual photo essay by a British photographer and included only incidental background noises in the audio track2). In this example, images of the Bank of England were juxtaposed with workers in the city and images of newspaper headlines outlining the financial collapse. Being able to identify and highlight the financial institutions in the images helped the authors make sense of the piece. The subtle information implicit in the images took time to decode. [13]
It was helpful here to create a transcript that reflected the visuals in the media file (see Figure 1 below). This in itself can be problematic as films and photographs are not neutral (BANKS, 2007). One of the difficulties of "capturing" the contents of a film or a series of photographs is understanding the additional properties associated with the image (CHAPLIN, 1994). It is possible here to show a brief example from the data set of what visual sociologists and anthropologists have been debating (BANKS, 2001, 2007; BANKS & MORPHY, 1997; EDWARDS, 1997; HARPER, 1998; PAUWELS, 1993). [14]
Images contain a range of nuanced information. This varies from relatively straightforward examples which could easily be decoded by most people to examples which were culturally significant and unlikely to be understood out of that context. For example Robert PESTON's (2008) piece for the BBC "A Guide to the Credit Crunch," included a narrative descriptive summary of the reporter's understanding of the economic crisis, but included many significant visuals, not necessarily referred to in the narrative, that supplemented the narrative content in significant ways. [15]
A black and white image of a child in a dunce hat comes into view, alongside the following voiceover: "So, why were we so dim so as to take on this huge financial burden?" Granted not very subtle, but one had to understand what a dunce cap was to understand the visual. [16]
The next set of visuals had more to unpack. An image of a house in the background has a bright red sign with the words "BANK REPO" fades to a second image of a house, an American bungalow, with a sign "lender foreclosure" and "public home auction" on it from a company "USHomeAuction.com." Before it is explicitly spelled out in the narrative, these visuals establish that the economic crisis started in the housing market in America. While the reporter discusses "the debt glut," images of houses and neighborhoods make clear that the reporter is talking primarily about mortgage debt. [17]
A third image in the COOMBS media file, shown in Figure 1, is much more subtle and culturally located. You can see from the transcript window on the left-hand-side that the narrator is talking about nationalization. The accompanying image is quite specific in its connections to the nationalization process that occurred in Britain, but might be lost on viewers from other parts of the world.
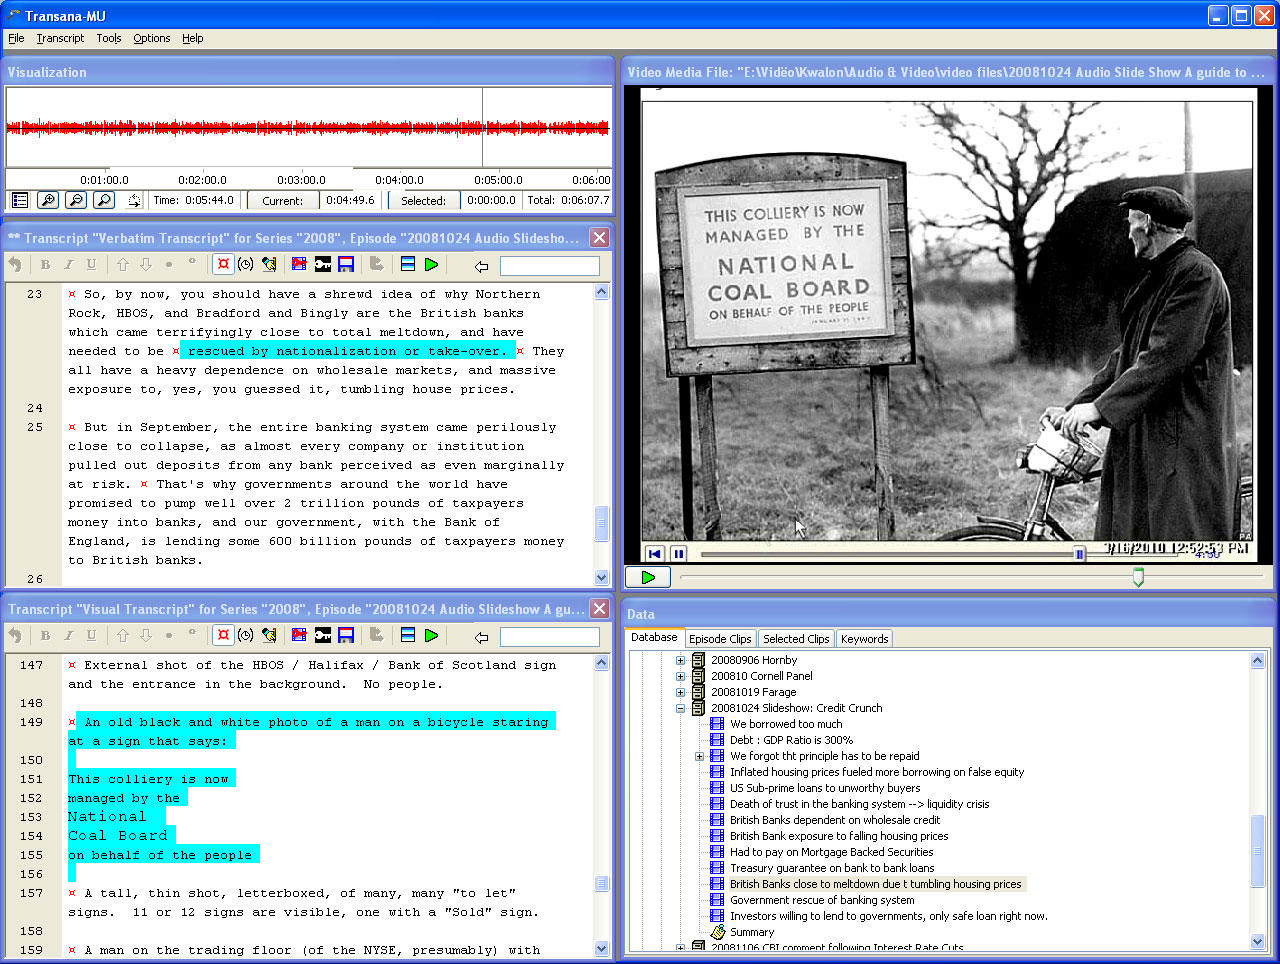
Figure 1: Multiple transcripts with the image of coal board (enlarge this figure here) [18]
A separate descriptive transcript was created to supplement the verbatim transcript created for this media piece. This descriptive transcript very effectively brought to the foreground some of the messages that were delivered visually rather than verbally. Transana's ability to display multiple simultaneous transcripts linked to media files allows for a more complex, multi-layered approach to more complex media data, and this proved very useful in some instances. [19]
3.2.2 Overcoming geographically nuanced understanding
Even before the transcription process was complete, it was clear that Dr. WOODS, an American, did not have access to all of the information necessary to understand the nuances of some of the European media files. For example, one of the BBC pieces, "The Economic Crisis in 76 Seconds" (NEIL, 2009), included a short sequence of men in suits, sitting at a table, apologizing profusely. It was evident from the context of the video that these men were probably bankers or other financial industry players, but no identifying information or context was presented in the media piece. The 10 second clip was interesting, but without knowing the identities of those involved, was not outstandingly noteworthy in the broader context of the 7 hour full data set.
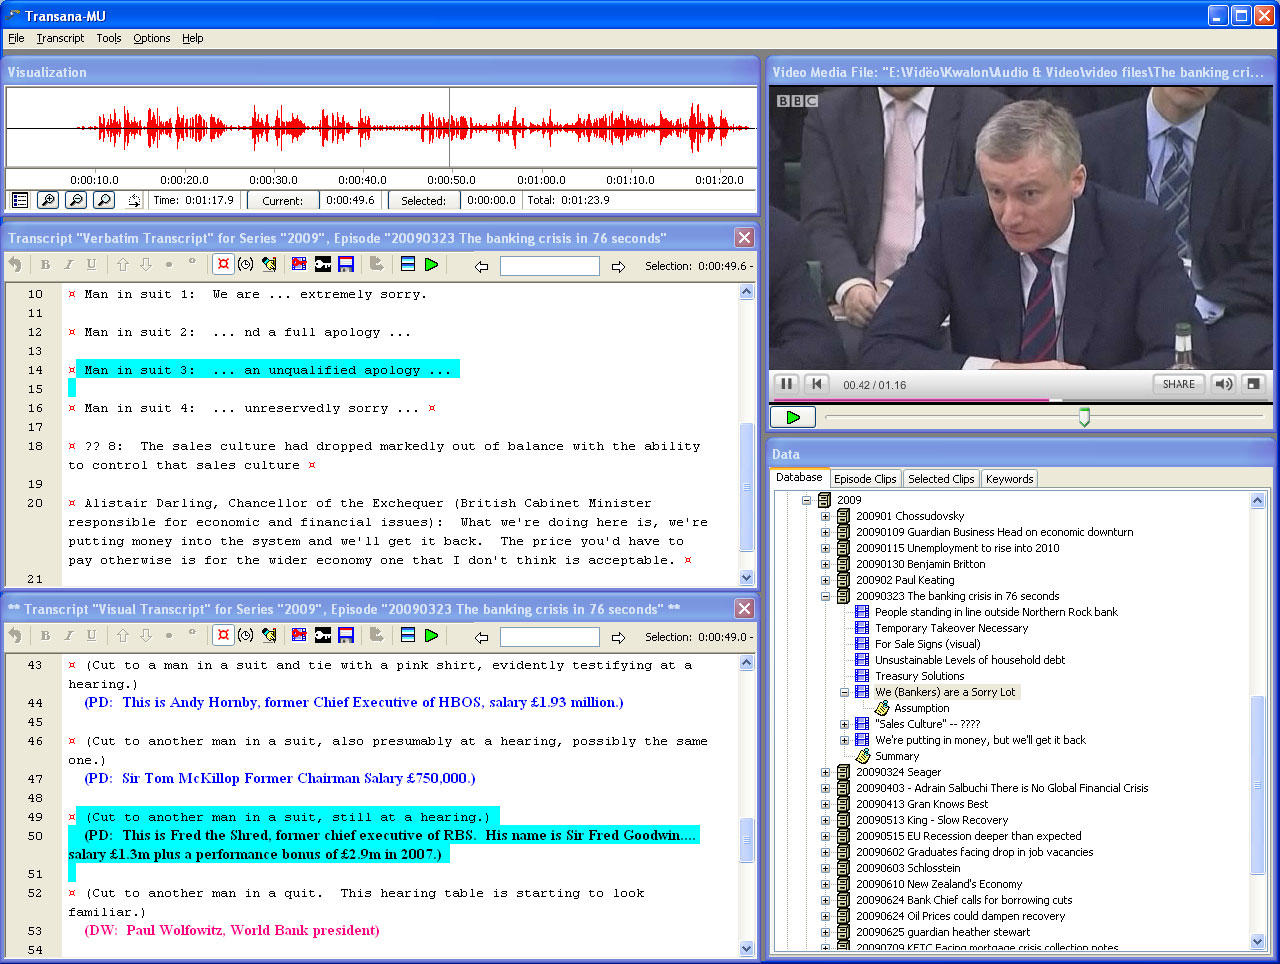
Figure 2: Transcripts reflecting multiple analytical layers, "The Men in Suits" (enlarge this figure here) [20]
Dr. WOODS invited Dr. DEMPSTER to join him in the analysis. Living in England, Dr. DEMPSTER knew immediately that these were video images of the heads of Britain's major banks apologizing as part of formal government hearings into the financial crisis. Through annotating the visual transcript for this media file, as shown in Figure 2, it was possible to include the names, job titles, banks they represented, and salary and bonus information from the years in question and the fact that they had been removed from office. This additional information emphasized the importance of this clip, preventing it from being lost in the press of data being analyzed. Similarly, Dr. WOODS was able to provide background information on such American characters as Ross Perot, who was one of the presenters in another of the data files (ROSS-PEROT-CHART.COM, 2008). [21]
3.2.3 Gisting as a form of transcription
The long media pieces were transcribed using a technique called "gisting." The idea of gisting is to create a summary transcript that captures the essence of a media file's content without taking the same amount of time or resources as a verbatim transcript might require. Typically, a transcriber using Transana may take 4 or 5 hours to create a verbatim transcript of the spoken word in a typical hour-long media file, while such a file can be gisted in one to two hours. For example, it is much faster to type: "Interest rate hikes had been occurring. It's a gauge of liquidity" than to type:
"So, also leading up to the end of 2000, we had gone through a series of interest rate hikes. The Fed Funds Target Rate, which is the, you can think of it as the key metric by which people gauge liquidity. Is money available? Is it harder to come by? Is it easier to come by? The Fed Funds Target Rate is the metric that most people cite, most press sources will, will key on, uh, to figure out what the attitude towards lending and money availability is" (ANDELINA, 2008, at 0:08:04). [22]
It accomplishes mostly the same thing in terms of allowing the researcher to gain a quick understanding of the nature of a part of a media file at a glance. [23]
3.2.4 The function of transcription in Transana
Transcription of media files serves several functions. Within Transana, transcripts can be linked to media files in such a way that the transcript follows the media file as it plays, and the media file can be navigated using the transcript. It is generally easier, faster, and far more efficient for researchers to search a transcript for a word to locate the desired section of a media file than it is to locate the desired passage by scrolling through a video or audio file. It is also easier and faster to code a portion of a media file by identifying a section of text than it is to identify a section of video, especially when one is working with a large collection of long media files or where a researcher is working in a team environment. The transcript and the media file are linked in Transana, so when one codes a passage in a transcript, one simultaneously codes the appropriate corresponding media, and visa versa. [24]
The process of transcribing the approximately 7 hours of media files for the KWALON experiment data set took approximately 25 to 30 hours using Transana, accomplished by the lead researcher rather than a professional typist. During the transcription process, a number of analytic memos, comprised of initial impressions of the data files, brief summaries of each file, and ideas of elements of the data deemed worthy of further exploration were created. From this, several broad initial themes in the data were identified for further exploration, including:
the political causes and influence on the economic crisis,
the financial mechanisms of the crisis,
the tendency of representatives of specific groups to assert that the financial crisis was not the fault of the group they represent. [25]
It was also noted that the long video files seemed to be very different than the shorter files (see Section 4.5.1 below). [26]
Transana's multi-user version made international collaborative data analysis quite straightforward. Dr. WOODS was able to share the media files being analyzed with Dr. DEMPSTER by uploading them, within his copy of the software, to the Storage Resource Broker, a web-based file repository designed to facilitate the secure transfer of large computer files over the internet. Dr. DEMPSTER was able to download the files over the course of several hours while doing other work. Although none of the files for this study was of a sensitive or protected nature, it is important to note that the Storage Resource Broker (SRB) transfers files in an encrypted fashion, making it safe to transfer human-subjects-sensitive data to collaborators over any distance. [27]
Once Dr. DEMPSTER had the necessary media files, he was able to connect to the shared analytic data stored on a server in Wisconsin. Multi-user Transana allows multiple members of a research team to connect to the same database at the same time, providing management that prevents data conflicts and providing communication that allows each user to see what changes other researchers are making to the data in real time. If Dr. DEMPSTER and Dr. WOODS were both working on the same media file at the same time, codes that one added showed up immediately and automatically in the other's copy of the software. This meant they could always be confident they had access to the latest data whenever either had the opportunity to work on the analysis. [28]
Copying the media files through the SRB was necessary because the internet does not allow fast enough data throughput to enable viewing of media files stored on a remote server the way the complex analysis of video data requires. The speed of the internet is too much of a bottleneck, even for the relatively low quality media files used in this study. This problem is resolved by each research location having its own copy of the media files. Unlike the media file data, the Transana analytic data (everything except the media files) can be shared in real time between multiple users at a distance because such information involves relatively small amounts of data that needs to be exchanged between computers, while the larger, less nimble media files are handled locally, and therefore quickly, in each location. A typical transcript, for example, involves tens of thousands of kilobytes, while a low-resolution, highly compressed video file is often hundreds of megabytes or more, or roughly 10,000 to 100,000 times larger. The other reason this system works so well is that the media files do not change, making real-time sharing unnecessary, while the analytic data can change at any time and thus benefits from the real-time sharing that accessing a shared database allows. [29]
Given the seven hour time difference between their locations, Dr. WOODS and Dr. DEMPSTER worked largely independently on the data analysis. They noted that the end of Dr. DEMPSTER's work day overlapped with the beginning of Dr. WOODS' work day, so there was an hour or two most days where they could overlap if desired. [30]
The analytic team utilized several different methods for collaborating within the software. When they were both working on the data at the same time, the researchers used Transana's built-in, text-based Chat utility to share analytic insights and ask questions of each other. This was particularly useful in that clips could be easily made, shared, and discussed in real-time. Given the limited amount of time each researcher was able to spend on the project, it was important to use the small windows of overlap they had in the most productive way. The researchers also created analytic memos specifically for collaborative communication, including having a daily log of activity, notes related to different aspects of the analytic themes they were finding and exploring, and video logs to allow communication with less typing3). This met the team's need to be able to communicate what work had been done, and was particularly important because of the nature of the dataset and the fact that there was a considerable time difference between researcher locations. [31]
The developers had a pre-defined data set and were not involved in data collection, so a grounded theory approach to the data was not appropriate. However, the Open Coding approach commonly associated with grounded theory was very useful for exploring this data set (CHARMAZ, 2003, 2006; GILGUN, 1994; GLASER, 1992). It is important to note, however, that theoretical saturation was not expected or achieved with any of the analytic themes or categories that emerged from the data set (CHARMAZ, 2003, 2006; GILGUN, 1994; GLASER & STRAUSS, 1967) The researchers were able to code using a mixture of attribute data (i.e. date, speaker, country of origin, type of financial instrument being discussed, economic player involved, etc.) and analytical themes (i.e. for content, financial and political dynamic at play, etc.). [32]
The research team concluded that it was important to be able to determine the background of each speaker in the data set in order to assess their credibility and to determine if they had an unspoken agenda or personal bias that would influence their presentation and slant on the economic crisis. Not surprisingly, such agendas and biases were common and were easily unpacked with just a few minutes of online research based on information provided either in the original media files or on the web sites where the media files were originally posted. (This is why several files that could not be adequately sourced were excluded from the analysis.) [33]
Not all "experts" were equally trustworthy in this data set. There were a number of instances in the data where people explicitly tried to minimize the responsibility for their own organizations' contribution to the overall crisis and tried to assign blame to some other set of actors. Collaboration was very useful here, in that Dr. WOODS and Dr. DEMPSTER were able to provide critical information to each other at times, and to question and challenge the biases they each may have brought to the analysis. [34]
The next analytic step involved creating and coding video clips from the source media files. In Transana, clips are those portions of the larger media files that are analytically interesting for some reason. They are the primary unit of analysis and all coding occurs at the clip level. Both researchers used an open coding approach to create approximately 300 clips covering some 3 hours and 6 minutes of the data set. These clips were coded densely, such that approximately 3,600 codes were applied to these 300 clips, for an average of 12 codes per clip. Clips were coded for basic demographic information such as video date, speaker identity, and "speaker type," a shorthand designation indicating some of the potential biases each speaker might bring to the table. In addition, codes were created to reflect the content of each clip. [35]
The coding system encompassed several different levels of information. The researchers coded the global content of a clip, indicating such things as whether it addressed the causes, implications, or potential solutions of the crisis. They coded the underlying psychological and economic dynamics described such as fear, economic cascade, or the belief in the free market's ability to regulate itself. They also coded for a variety of more specific concepts, such as the financial instruments being discussed or the political dynamics being described in each clip. The coding system expanded early in this open coding analytic phase and contracted later during a phase reminiscent of selective coding (CHARMAZ, 2003, 2006; GILGUN, 1994; GLASER, 1992; GLASER & STRAUSS, 1967; STRAUSS & CORBIN, 1998). [36]
Transana offers several different ways of creating clips and coding during the analytic process, facilitating different analytic approaches and research styles. Dr. WOODS and Dr. DEMPSTER chose to use standard clips4) most of the time, creating, naming, categorizing, and coding clips manually and bypassing some of the faster, more automated methods of clip creation available in the program. The primary reason for this choice was that the content for this analysis was quite dense and the researchers needed to code each clip on several different levels simultaneously. Standard clips are the best way to pursue this strategy in Transana. The researchers chose to organize their initial clips according to media date and speaker name in order to retain that information in the foreground. The team anticipated exploring the question of whether the discussion of the economic crisis differed significantly from 2008 and 2009, as well as wanting the credibility information discussed above to be readily evident as they proceeded. In addition, they simply didn't know what other organizational system would make sense as they started the analysis, beyond some admittedly vague ideas put forth in the analytic memos created during the transcription process. [37]
After spending significant time in exploring the data and becoming familiar with it, approaching the range of narratives within the data was adopted as the primary analytic focus. At the conference, Dr. WOODS presented the results of the analysis of the data set in terms of "the story this data had to tell." See Section 5 below. [38]
4.3 Creating analytical memos and sharing insights
The researchers continued to create and refine their analytic memos as they created clips. They documented new analytic insights and modifications to past insights, carefully time-stamping each addition to the notes so that they would be able to recreate their analytic process by reviewing their notes. This was especially important given that different researchers were adding comments; it was important to know who said what and when. Reading the newest analytic memos proved to be an excellent method for understanding what each researcher was exploring and discovering at any given point in our analysis. [39]
4.4 Using tools (maps) to develop arguments
A third analytic technique was to pass through the data and use Transana's maps and graphs to outline the many different arguments being presented. As shown in Figure 3, most of the arguments made in the different media files can be summarized in a fairly simple graphical form that is readily accessible and interpretable at a glance.
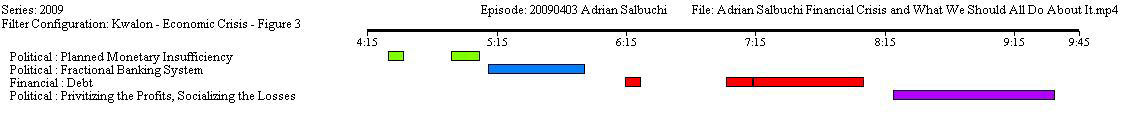
Figure 3: Graphical representation of Adrain SALBUCHI's (2009) description of the economic crisis (enlarge this figure here) [40]
The coding scheme was detailed enough that one can immediately see that Adrian SALBUCHI (2009) describes what he calls the four sides of the financial pyramid, made up of "Planned Monetary Insufficiency," the "Fractional Banking System," the "Role of Debt," and the dynamic of "Privatizing the Profits, Socializing the Losses." If the meaning of one of these codes is unclear, a user could click on the relevant bar in the map and the coded clip underlying the bar in the map is loaded into Transana's interface for review. This ability to remain close to the source media data is implemented throughout Transana wherever possible, and was used by the researchers extensively. [41]
Maps such as this allow researchers to keep track of large amounts of complex data, making evaluation, categorization, and comparison in large data sets more manageable. It also made pinpointing ideas, phrases or turns of speech easier as they are separated out. One other aspect of this graphical coding that proved useful was where people were talking over each other. We were able to quickly visualize the point where arguments broke out or discussions became heated. [42]
Another analytic technique used to pursue understanding of the data set for this conference involved searches. In Transana, searches for codes and combinations of codes return clips, which are then examined further for additional insight. Major themes in the data could be examined with relatively simple searches. The researchers performed one search to identify all of the clips we'd coded for discussion of different financial tools, instruments, and mechanisms, and these clips served as the starting point for exploring the discussion of the financial mechanisms that fueled the crisis initially. Further searches yielded clips related to the role of politics in and behind the economic problems. [43]
As their understanding of the data coalesced and their theoretical understanding of what the data was telling them became more sophisticated, more subtle and complex searches were useful in tracking down clips more precisely. The researchers were able to pursue details of the way different elements within the data interacted, and were able to explore connections in arguments across speakers in ways that opened up new understandings and led to new theoretical insights. Searches allowed them to draw much more specific conclusions about the economic crisis by providing specific examples from the data set that backed up the different elements of the emerging theory as a complex understanding of the economic crisis finally came together clearly. [44]
4.5.1 The long and the short of it
Early on, Dr. WOODS developed the impression that the long video files were fundamentally different from the shorter video files. Once clips were coded for the length of the media files they were created from, it became clear, through exploring the results of a series of complex searches, that the longer pieces tended to be of academics in academic settings, while the short pieces were more likely to be television news pieces featuring interviews with industry spokesmen with an identifiable, specific, self-serving agenda, examples of "press-release journalism," or calculated "sound bites" (of course, not all of the journalistic pieces fit this description). The researchers hypothesized that longer sessions in academic settings allowed for a greater level of depth of discussion where there was greater freedom from time or economic pressures, with less corporate control of the message, allowing for a shift from the "what" of the economic crisis to the "why" of the crisis. A number of the shorter pieces were instances where personal bias or professional agenda were being promoted, while the longer pieces tended more towards critical analysis. [45]
The primary research question for the conference dealt with whether views and arguments about the causes and prognosis of the economic crisis differed between data collected in June, 2008 and data collected in June, 2009. Text data was collected from only the month of June in each of these years. The video and audio data, however, was not collected in the same narrow way, making it much more difficult to pursue this question rigorously. While there were some differences between 2008 and 2009 in the media data, these differences were often subtle and 'loaded' with particular cultural meaning. They appeared to be not particularly meaningful or interesting in the eyes of the researchers. Instead, we made the choice to follow the traditions of qualitative analysis and allowed the data to speak for itself, which brought with it some interesting results. [46]
The video and audio data for the KWALON 2010 data reveals a complex, multi-layered assessment of the economic crisis of 2008 – 2009. Our analysis showed three major themes in the way the economic crisis was viewed, understood, and described by the subjects of the media files. Some of the media files explored the economic and financial dynamics of the crisis. Other presenters in the media files looked at the role that politics and politicians played in the economic crisis. Some of the people captured in the media files carried their analysis of the political and economic dynamics further than others, and there was a small group that talked about the economic crisis in, for lack of a better word, conspiratorial terms. [47]
The first layer of discussion that occurs in the KWALON data set covers the financial mechanisms of the economic crisis. There is general agreement that the financial crisis started in the US, particularly in the housing market, see for example speakers Wolfgang MUNCHAU and Graham WATSON (as part of ALDE, 2008) and also Stephen CECCHETTI (see VOX, 2008) and Paul KEATING (see KEATING & ABC-TV, 2009). Economic surpluses in China, Asia, and the Middle East led to excess supply of cash for loans in the US, encouraging US debt, (MUNCHAU in ALDE, 2008; KEATING & ABC-TV, 2009, and PESTON, 2008). For example, Robert PESTON's (2008) audio slideshow "A Guide to the Credit Crunch" video essay asserts, "supposedly brilliant bankers built a financial super-highway linking East to West, channeling the enormous savings of the fast-growing exporting economies of Asia, Russia, and the Middle East, to home buyers and companies in the West" (n.p.). [48]
This easy credit, especially in the mortgage market, encouraged demand in the housing market, which pushed housing prices higher and created a housing bubble (KEATING & ABC-TV, 2009; NEIL, 2009; PESTON, 2008; SCHLOSSTEIN, 2009; SOROS & COUNCIL-ON-FOREIGN-RELATIONS, 2008; VOX, 2008). Several speakers in the media files talked about excessive debt as the root of the problem (MUNCHAU in ALDE, 2008; KEATING & ABC-TV, 2009; NEIL, 2009; PESTON, 2008; SCHLOSSTEIN, 2009; VOX, 2008), including describing how inflated house prices fueled more consumer borrowing (PESTON, 2008). [49]
Sub-prime mortgage loans, developed to allow mortgage borrowing by people who couldn't use traditional mortgages, were being bundled into Collateralized Debt Obligations. This is important because the banks and companies originating the loans were no longer holding any of the financial risk associated with those loans, thus leading to a lowering of standards in evaluating the prudence of those mortgage loans (KEATING & ABC-TV, 2009; PESTON, 2008; VOX, 2008). As Paul KEATING points out, "In the end, the investment banks were servicing the least-worthy credit customers in America, the people who couldn't even afford a normal mortgage" (2009, n.p.). Only KEATING mentions the role that the credit rating agencies had to play in this economic drama, as they rated mortgage-backed investments such as CDOs highly even when the quality of the mortgage borrowers had dropped significantly. [50]
Before too long, some of these high-risk borrowers defaulted on their mortgages. As defaults and foreclosures increased, housing prices fell. As David EASLEY (2008, n.p.) describes it,
"as the price of houses goes down even more, there are more and more defaults, creating even less confidence that people are going to pay you back. And as you can see, this thing can feed back on itself, and you just get a cascade that goes down to the lowest possible point if nothing's done." [51]
George SOROS (2008) in particular argues that government must do something to reduce foreclosures as an essential part of any solution to the economic crisis. [52]
Not much was mentioned in this data set about the personal economics of falling house prices and the "rational" (to use Elizabeth SAUNDERS' term) economic decision that causes people who owe more than their house is worth to walk away from their mortgage (SAUNDERS, 2008). However, there was significant discussion of the effects of the economic crisis on businesses. Because of the higher-than-predicted level of defaults on mortgages backing Collateralized Debt Obligations, the values of these assets became unreliable and the banks and other companies holding them were unable to determine their real value, (PESTON, 2008; VOX, 2008). The result was a massive crisis in confidence in the credit markets characterized by banks and others being unwilling to make loans for fear that the borrower held toxic assets and might go out of business before the loan could be repaid, (EASLEY, 2008; LAMBERT & BBC, 2008; McCAFFERTY, 2008; PESTON, 2008; ROBERTS, 2009; VOX, 2008). Essentially, the credit markets became frozen, and businesses could no longer borrow the capital they needed (LAMBERT & BBC, 2008, 2009; McCAFFERTY, 2008). Richard LAMBERT and Ian McCAFFERTY, both representing business interest groups, argue that what's good for business is good for the economy as a whole, and encourage government to implement a number of pro-business policies. [53]
5.2 Political underpinnings and the role of politicians in the financial crisis
A second layer of discussion of the economic crisis also clearly exists in the KWALON data set, overlapping to a degree with the first but mostly occurring as a parallel thread. This second layer looks at the political underpinnings and the role of politicians in the financial crisis, particularly in looking at the political influences and changes that led up to and allowed the crisis to occur. [54]
As Elizabeth SAUNDERS (2008, n.p.) states, "this is a problem created by politics ... I think it is a political problem. I think it can only be solved through government." The political origins of the economic crisis begin with what George SOROS (2008) calls "market fundamentalism," the belief that free markets are self-regulating and efficiently stabilize the economy, and the explicit efforts to implement this belief through specific changes in government policy and regulations. Michel CHOSSUDOVSKY (2009), Paul KEATING and ABC-TV (2009), Elizabeth SAUNDERS (2008), and Ralph SCHLOSSTEIN (2009) all describe the same dynamic, which SAUNDERS traces back to the Reagan era in America and to the Thatcher administration in the United Kingdom. Elizabeth SAUNDERS and Michel CHOSSUDOVSKY particularly point to the Financial Services Modernization Act of 1999 in the U.S., and they, along with KEATING, point to the repeal of the New Deal era Glass—Steagall act as a specific, crucial example of the sorts of widespread deregulation that created an atmosphere in which the economic crisis was able to occur. [55]
This fundamental move towards deregulation, the argument goes, allowed for the development and spread of such financial instruments as sub-prime loans and collateralized debt obligations. These are, of course, exactly the financial instruments that contributed to the onset of the financial crisis described above. George SOROS (2008, n.p.) argues that "many of these instruments are developed to avoid regulation." David EASLEY (2008), Paul KEATING and ABC-TV (2009), Elizabeth SAUNDERS (2008), Ralph SCHLOSSTEIN (2009), and George SOROS (2008) all agree that the free market has proven itself unable to self-regulate, though they differ in their suggestions about what should be done to resolve the current problems and prevent future crises. [56]
The final piece of this political dynamic is that when the system collapses, governments step in to bail out the banks using taxpayer money (CHOSSUDOVSKY, 2009; PESTON, 2008; SCHLOSSTEIN, 2009). Michel CHOSSUDOVSKY and Patrick BLOWER (2009) express concern about the government debt incurred in this way and the long-term effects it is likely to have on the economy and the lives of ordinary people. [57]
Two of the speakers in the media files making up the KWALON conference data set seem to be willing to follow the political analysis significantly further down the rabbit hole than the rest. Adrian SALBUCHI (2009, n.p.) states
"Everybody seems to be talking about the global financial crisis, but I want to show you, based on our experience in Argentina, that there is no global financial crisis. What you are suffering in the first world is an irreversible global systemic meltdown. There's no way of saving it." [58]
SALBUCHI talks about the fundamentally flawed system of extreme capitalism, and describes the four sides of the financial pyramid currently driving the world economy. He talks about planned monetary insufficiency, where bankers control federal banks in such a way that there is never quite enough money to meet the needs of the economy. Then, he introduces the fractional banking system, which steps in to "solve" the problem of monetary insufficiency, making enormous profits in the process. This system depends on people, businesses, and governments building up significant debt and borrowing from the banking system. Finally, he describes the dynamic of privatizing all of the profits from this system, but manipulating things such that when losses are incurred, these losses are socialized, being transferred to taxpayers via government bailouts. [59]
Michel CHOSSUDOVSKY (2009) talks about the financial crisis in terms of a "massive transfer of wealth" out of the pockets of ordinary people and into the hands of large financial institutions and powerful individuals. He labels this "financial economic warfare against workers, and, um, workers, consumers, people who've saved, people who've retired" (n.p.). He, too, talks about how these financial elites control "money creation" and are using the crisis to "snap up" productive capacity at bargain-basement prices. He goes on to talk about the role of the IMF in the financial takeover of a number of countries, including Korea and other Asian countries in 1997, Russia in 1998, and Brazil in 1999. He describes how creditors are able to dictate a wide variety of governmental policies to their own advantage. He describes similar dynamics at play in an attempt to take over the United States and Canadian economies through the present financial crisis. [60]
It is important to note that this paper is not about the economic crisis, and that the dynamics discussed above came out of a closed data set that was collected not by the authors of this paper but by the KWALON conference organizers. The authors don't know how the data sample was assembled, if the data was collected systematically, or anything about what biases might have influenced the collection of the various media files within this data set. The point of the data set was to allow some degree of comparability when looking at the different ways the data was handled within different qualitative analytic software packages. The theoretical understanding of the economic crisis presented in this paper is intended to demonstrate the kinds of analyses and conclusions that can be achieved using Transana, and are not meant to make any kind of informed statement about the causes or underlying dynamics of the economic crisis. [61]
In the Methods section, the authors have attempted to describe in very specific terms the analytic processes used to explore the data set provided by the organizers of the KWALON 2010 conference. The analytic act of transcription was important in gaining access to the data set being analyzed, to establishing an initial understanding of the data. Transana's system for linking transcripts with their associated media files allowed the authors to maintain a close connection to the media at all times, while simultaneously developing a first-level abstraction from the data that allowed for easier navigation and segmentation of the data, as well as allowing for more nuanced, multi-layered understanding of some of the more visually-oriented pieces through Transana's capacity for handling multiple simultaneous transcripts (see also David WOODS & Paul DEMPSTER, 2011, this journal). [62]
The analysis of this data set benefited from international collaboration, allowing researchers in different geographical locations with different national backgrounds and different cultural understandings to share their alternate perceptions on the data set. In this case, the basis of the shared information had to do primarily with geographic location, but similar collaborations around field of study, area of expertise, or analytic perspective can similarly be facilitated by Transana's capacity for multiple simultaneous users. Finally, the authors have described their use of Transana's specific tools, including clips in collections, maps and graphs, searches, and analytic memos in the analytic process. These tools, each with their own affordances, allowed for flexible abstract representations of complex data. Clips helped them select and manipulate analytically important and interesting segments from the larger media set. Maps and graphs helped them create abstracted representations of the many different arguments that were being made and helped them maintain a manageable understanding of a large, complex data set. Searches helped them explore relationships between different speakers talking about similar concepts in similar ways, and to explore relationships between speakers and concepts, which was vital to making the transition from data to theoretical understanding. Analytic memos, through Transana's Notes feature, were essential to tracking our analytic process and to communicating during the collaborative process. [63]
The result of all of this is, in this case, a narrative description of the economic crisis in multiple layers. It tells the story of what the media files in this data set had to say on the subject of the economic crisis of 2008 – 2009. The nature of the data set precluded a grounded theory analysis, as there was no way to achieve theoretical saturation with the data we were given. The nature of the data set, with the open questions of how the files were found and gathered, precludes making definitive statements about what actually happened. However, the data set serves its intended purpose of allowing the researchers to describe how they worked with the data within Transana and allowing them to describe what they saw when they analyzed that data. In that way, the conference organizers have achieved their goals admirably. [64]
Appendix: Media File Information by Date Recorded or Published
February, 2008. "EC ALDE workshop on financial crisis." Speakers include Watson, McCreevy, Daianu, De Keuleneer, Phipps, Munchau, Priester, Kinsella, Purvis, Van den Burg, Smith, Huet-Delaherse, Kluza, and Klinz. Source: unknown.
May 7, 2008. "Global Economic Trends5-7-08-Soros." Speaker: George Soros. Source: http://www.cfr.org/publication/16220/global_economic_trends.html on 11/3/2009.
June, 2008. "Ross_Perot_-_ECONOMIC_crisis_2008." Speakers: Ross Perot, Mike Poss. Source: http://www.youtube.com/watch?v=71zH7EUlUHc on 11/3/2009.
June 7, 2008. "Russia Today Medvedev blames US." Speaker: Unknown journalist from Russia Today. Source: http://www.youtube.com/watch?v=vVY4-HSApRA on 11/4/2009.
June 27, 2008. "KETC mortgage crisis how long_#2457." Speakers: Ruth Ezell of KETC, Krehmeyer, Dabney, Hermes. Source: http://www.youtube.com/watch?v=N_TGHt0ymEo on 11/4/2009.
June 30, 2008. "VOX Talks with Stephen Cecchetti." Speaker: Stephen Cecchetti. Source: http://www.voxeu.org/index.php?q=node/1290 on 11/3/2009.
September 6, 2008. "Credit crunch to last into 2010." Speaker: Andrew Hornby. Source: http://news.bbc.co.uk/1/hi/business/7601461.stm on 11/3/2009.
October, 2008. "The_Financial_Crisis_Explained_B." Source: http://www.youtube.com/watch?v=_o4IcNbfPMA&feature=related on 11/3/2009.
October 1, 2008. "20081001-financial-crisis-panel." Speakers: Robert Andelina, David Easley, Elizabeth Saunders. Source: http://uc.princeton.edu/main/index.php/component/content/article/4061 on 7/10/2010
October 16, 2008. "20081016 Audio Slideshow The Square Mile." Source: http://news.bbc.co.uk/1/hi/magazine/7662933.stm on 11/3/2009.
October 19, 2008. "Nigel Farage interview transcript." Speaker: Nigel Farage. Source: http://news.bbc.co.uk/1/hi/programmes/politics_show/7678724.stm on 11/3/2009.
October 24, 2008. "20081024 Audio Slide Show A guide to the credit crunch." Speaker: Robert Peston. Source: http://news.bbc.co.uk/1/hi/business/7688308.stm on 11/3/2009.
November 6, 2008. "CBI reacts to interest rates cut." Speaker: Richard Lambert. Source: http://news.bbc.co.uk/1/hi/business/7713293.stm on 11/3/2009.
November 17, 2008. "Cbistreaming-CBIEconomicForecast20092010812." Speaker: Ian McCaffertey. Source: http://www.cbi.org.uk/ndbs/content.nsf/802737AED3E3420580256706005390AE/D3BF928EC3BF325E802574BA003C3B9E on 11/4/2009.
December 5, 2008. "Interest Rate Cut gdn.bus.081205.tm.Larry_Elliott." Speaker: Larry Elliot. Source: http://www.guardian.co.uk/business/audio/2008/dec/05/interest-rate-cut-mortgage-britain on 11/3/2009.
January, 2009. "THE GLOBAL FINANCIAL CRISIS — Michel Chossudovsky Jan 2009, Montreal." Speaker: Michel Chossudovsky. Source: http://video.google.com/videoplay?docid=-5524526231174165759 on 11/3/2009.
January 9, 2009. "economic downturngdn.090109.gd.roberts." Speaker: Dan Roberts. Source: http://www.guardian.co.uk/global/audio/2009/jan/09/interest-rates on 11/3/2009.
January 15, 2009. "Unemployment to rise into 2010." Speakers: Richard Lambert, Ben Broadbent. Source: http://news.bbc.co.uk/today/hi/today/newsid_7830000/7830132.stm on 11/3/2009.
January 30, 2009. "281851582_9532184001_55G29-1-09." (The curious case of Benjamin the Ordinary Briton). Speaker: Patrick Blower. Source: http://www.guardian.co.uk/commentisfree/video/2009/jan/30/recession-debt on 11/4/2009.
February, 2009. "Paul_Keating_On_Economic_Crisis_2009." Speaker: Paul Keating. Source: http://www.youtube.com/watch?v=AaiHknko6dM, http://www.youtube.com/watch?v=VJiOZIdJOeA&feature=related, and http://www.youtube.com/watch?v=MixVLZeVz7c&feature=related on 11/3/2009.
March, 2009. "Three Top Economists Agree 2009 Worst Financial Crisis Since Great Depression." Speakers: Nuriel Rabini, Ken Rogoff, and Nariman Behravesh. Source: http://www.youtube.com/watch?v=9UcbwQgrAIY&feature=related and eight more related files on 11/3/2009.
March 23, 2009. "The banking crisis in 76 seconds." Source: http://news.bbc.co.uk/1/hi/programmes/the_daily_politics/7959184.stm on 11/3/2009.
March 24, 2009. "gdn.240309.SEAGER." Speaker: Ashley Seager. Source: http://www.guardian.co.uk/global/audio/2009/mar/24/deflation-inflation on 11/3/2009.
April 3, 2009. "Adrian Salbuchi Financial Crisis and What We Should All Do About It." Speaker: Adrian Salbuchi. Source: http://www.youtube.com/watch?v=UlDNMB6wYmI on 11/4/2009.
April 13, 2009. "Beat Recession Gran Knows Best!." Speaker: Barbara Walmsley. Source: http://news.sky.com/skynews/Home/video/Super-granny-Barbara-Walmsley-is-turning-into-a-web-sensation-with-tips-to-help-people-ride-out-the-recession-Her-video-posted-on-youtube-has-had-250000-hits/Video/200904215260890 on 11/3/2009.
May 13, 2009. "King warns of slow economic recovery." Speakers: Richard Scott, Mervyn King. Source: http://news.bbc.co.uk/1/hi/business/the_economy/8048068.stm on 11/4/2009.
May 15, 2009. "EU recession deeper than expected." Speaker: Hugh Pym. Source: http://news.bbc.co.uk/1/hi/business/8053019.stm on 11/3/2009.
May 21, 2009. "We could have forecasted recession sooner_A." Speaker: David Blanchflower. Source: http://news.bbc.co.uk/1/hi/programmes/newsnight/8062460.stm on 11/3/2009.
June 2, 2009. "Graduates facing drop in job vacancies." Speakers: Reporter, Bernard. Source: http://news.bbc.co.uk/1/hi/business/8079118.stm on 11/3/2009.
June 3, 2009. "Jun 3 Ralph Schlosstein on Was-1243994545581-12439." Speaker: Ralph Schlosstein. Source: http://www.ft.com/cms/s/8a38c684-2a26-11dc-9208-000b5df10621.htm?_i_referralObject=5640966&fromSearch=n on 11/3/2009.
June 10, 2009. "20090610-ABC News Australia nzeconomy-am_video2." Speaker: Campbell Kerney. Source: Unknown.
June 12, 2009. "Chancellor says oil price could dampen recovery hopes - Times Online(5)." Speaker: Carl Mortished. Source: http://business.timesonline.co.uk/tol/business/economics/article6484811.ece on 11/3/2009.
June 24, 2009. "Bank chief calls for borrowing cut." Speakers: Nick Robinson, Mervyn King, Gordon Brown. Source: http://news.bbc.co.uk/1/hi/business/8117942.stm on 11/3/2009.
June 25, 2009. "gdn.bus.090625.tm.Heather-Stewart2." Speaker: Heather Stewart. Source: http://www.guardian.co.uk/business/audio/2009/jun/25/mervyn-king-treasury-debt on 11/3/2009.
July 9, 2009. "KETC Facing mortgage crisis collection notes." Speakers: Ruth Ezell, Ingram, Krehmeyer. Source: http://www.facebook.com/video/video.php?v=16743529447 and http://www.supportwmfe.org/mortgage/?p=162 on 11/4/2009.
July 14, 2009. "dutch ceo20090714VFTT_DSM_pt3-1247591616464." Speaker: Feike Sijbesma. Source: http://www.ft.com/cms/s/8a38c684-2a26-11dc-9208-000b5df10621.htm?_i_referralObject=6883771&fromSearch=n on 11/3/2009.
September 15, 2009. "20090915_VFTT_1-1253182697231." Speaker: Angela Ahrendts Source: http://www.ft.com/cms/s/8a38c684-2a26-11dc-9208-000b5df10621.htm?_i_referralObject=7573368 on 11/4/2009.
1) Although eight software packages were originally scheduled to participate in what came to be known as "the KWALON experiment," only the findings from four software packages were presented at the conference. A blanket no fly zone over Britain and parts of Europe limited travel due to volcanic activity in Iceland, preventing one "software package" from attending. <back>
2) For examples of more traditional photo essays consider Dona SCHWARTZ's (1993) work on image, Jerome CROWDER (2003) focusing on migrants in Bolivia, John BERGER and Jean MOHR's examination of the middle classes, migrants an peasants respectively (1967, 1975, 1982), or a written video piece (HIMPELE, 2003). <back>
3) One of the researchers is currently struggling with a repetitive stress injury which makes typing difficult and unadvisable, so creating a video commentary with his web cam, which he added to the data set and uploaded to the SRB, worked extremely well in reducing the amount of typing needed. <back>
4) The way a clip is used in Transana, is as a pointer to a certain location in the video file, instead of physically clipping a video file in separate pieces, as a video-editing software would do. <back>
ALDE (2008). Workshop on financial crisis, http://www.alde.eu/fileadmin/webdocs/key_docs/Finance-book_EN.pdf [Accessed: June 24, 2010].
Andelina, Robert (2008). The financial crisis: Implications for Washington, Wall Street and Main Street, http://uc.princeton.edu/main/index.php/component/content/article/4061 [Accessed: March 11, 2009].
Banks, Marcus (2001). Visual methods in social research. London: Sage.
Banks, Marcus (2007). Using visual data in qualitative research. London: Sage.
Banks, Marcus & Morphy, Howard (1997). Rethinking visual anthropology. London: Yale University Press.
Berger, John & Mohr, Jean (1967). A fortunate man: The story of a country doctor. Harmondsworth: Allen Lane / Penguin.
Berger, John & Mohr, Jean (1975). A seventh man: A book of images and words about the experience of migrant workers in Europe, London: Penguin
Berger, John & Mohr, Jean (1982). Another way of telling. London: Writers and readers.
Blower, Patrick (2009). The curious case of Benjamin the Britain, http://www.guardian.co.uk/commentisfree/video/2009/jan/30/recession-debt [Accessed: March 11, 2009].
Chaplin, Elizabeth (1994). Sociology and visual representation. London: Routledge.
Charmaz, Kathy (2003). Grounded theory: Objectivist and constructivist methods. In Norman K. Denzin & Yvonna S. Lincoln (Eds.), Strategies of qualitative enquiry (pp.249-292). London: Sage.
Charmaz, Kathy (2006). Constructing grounded theory: A practical guide through qualitative analysis. London: Sage.
Chossudovsky, Michel (2009). The global financial crisis: Michel Chossudovsky Jan 2009, Montreal, http://video.google.com/videoplay?docid=-5524526231174165759 [Accessed: March 11, 2009].
Coombes, Phil (2008). The square mile, http://news.bbc.co.uk/1/hi/magazine/7662933.stm [Accessed: October 16, 2008].
Crowder, Jerome (2003). Living on the edge: A photographic essay on urban Aymara migrants in El Alto, Bolivia. Visual Anthropology, 16(2), 263-287.
Easley, David (2008). The financial crisis: Implications for Washington, Wall Street and Main Street, http://uc.princeton.edu/main/index.php/component/content/article/4061 [Accessed: March 11, 2009].
Edwards, Elizabeth (1997). Beyond the boundary: A consideration of the expressive in photography and anthropology. In Marcus Banks & Howard Morphy (Eds.), Rethinking the visual anthropology (pp. 53-80). London: New Haven Press.
Gilgun, Jane (1994). Hand into glove: The grounded theory approach and social work research practice. In Edmund Sherman & William Reid (Eds.), Qualitative research in social work (pp.115-125). Chichester, West Sussex: Columbia University Press.
Glaser, Barney (1992). Basics of grounded theory analysis: Emergence vs. forcing. San Francisco, CA: Sociology Press.
Glaser, Barney & Strauss, Anselm (1967). The discovery of grounded theory: Strategies for qualitative research. New York: Aldine de Gruyter.
Harper, Douglas (1998). An argument for visual sociology. In John Prosser (Ed.), Image based research: A sourcebook for qualitative researchers (pp.20-35). London: Falmer Press.
Himpele, Jeff (2003). The Gran Poder parade and the social movement of the Aymara middle class: A video essay. Visual Anthropology, 16(2), 207-243.
Keating, Paul & ABC-TV (2009). Paul Keating on economic crisis, http://www.youtube.com/watch?v=AaiHknko6dM and http://www.youtube.com/watch?v=VJiOZIdJOeA&feature=related and http://www.youtube.com/watch?v=MixVLZeVz7c&feature=related [Accessed: March 11, 2009].
Lambert, Richard & BBC (2008). Richard Lambert: CBI reacts to interest rate cuts, http://news.bbc.co.uk/1/hi/business/7713293.stm [Accessed: March 11, 2009].
Lambert, Richard & BBC (2009). Unemployment "to rise into 2010", http://news.bbc.co.uk/today/hi/today/newsid_7830000/7830132.stm [Accessed: March 11, 2009].
McCafferty, Ian (2008). CBI economic forecast 2009-2010, http://www.cbi.org.uk/ndbs/content.nsf/802737AED3E3420580256706005390AE/D3BF928EC3BF325E802574BA003C3B9E [Accessed: April 11, 2009].
Neil, Andrew (2009). The banking crisis in 76 seconds, http://news.bbc.co.uk/1/hi/programmes/the_daily_politics/7959184.stm [Accessed: March 11, 2009].
Pauwels, Luc (1993). The visual essay: Affinities and divergences between the social scientific and the social documentary modes. Visual Anthropology, 6(2), 199-210.
Peston, Robert (2008). A guide to the credit crunch, http://news.bbc.co.uk/2/hi/business/7688308.stm [Accessed: March 11, 2009].
Roberts, Dan (2009). Economic downturn "interest rates may not be such a useful tool anymore", http://www.guardian.co.uk/global/audio/2009/jan/09/interest-rates [Accessed: March 11, 2009].
Ross-Perot-Chart.com (2008). Ross Perot: Economic crisis 2008 by Ross Perot charts,com and Mike Poss, http://www.youtube.com/watch?v=71zH7EUlUHc [Accessed: March 11, 2009].
Salbuchi, Adrian (2009). Financial crisis and what we should all do about it, http://www.youtube.com/watch?v=UlDNMB6wYmI [Accessed: April 11, 2009].
Saunders, Elizabeth (2008). The financial crisis: Implications for Washington, Wall Street and Main, http://uc.princeton.edu/main/index.php/component/content/article/4061 [Accessed: March 11, 2009].
Schlosstein, Ralph (2009). View from the top: CEO's review the news for FT.com. This week: Ralph Schlosstein CEO of Evercore partners, http://www.ft.com/cms/s/8a38c684-2a26-11dc-9208-000b5df10621.htm?_i_referralObject=5640966&fromSearch=n [Accessed: March 11, 2009].
Schwartz, Dona (1993). Super bowl XXVI: Reflections on the manufacture of appearance. Visual Sociology, 8(1), 22-33.
Sheon, Nicholas (2007). Analyzing orphaned transcripts in Transana, http://www.palmpal.org/atc.html [Accessed: September 7, 2010].
Soros, George & Council-on-Foreign-Relations (2008). Global economic trends: The credit crunch: A conversation with George Soros, http://www.cfr.org/publication/16220/global_economic_trends.html [Accessed: March 11, 2009].
Strauss, Anselm & Corbin, Juliet (1998). Basics of qualitative research techniques and procedures for developing grounded theory (2nd ed.). London: Sage.
Vox (Producer) (2008). VOX Talks with Stephen Cecchetti. Podcast, http://www.voxeu.org/index.php?q=node/1290 [Accessed: March 11, 2009].
Paul G. DEMPSTER, is a Research Fellow at the University of Leeds UK. He is also an honorary Research Associate at the University of Wisconsin Madison. He is a Medical Sociologist, I.T. specialist and Thanatologist, currently researching governance and IT within the NHS. He has a longstanding research interest in the use of qualitative research software, its development and application in new and distinctive ways.
Contact:
Dr Paul G Dempster
Leeds Institute Health Sciences
Room 2.02/11
Charles Thackrah Building
101 Clarendon Road
University Of Leeds
LS17 6NP
UK
Tel.: 0044 (0)113 3430858
E-mail: p.dempster@leeds.ac.uk
URL: http://www.leeds.ac.uk/hsphr/hsc/biogs/pd.html
David WOODS is a Researcher at the Wisconsin Center for Education Research at the University of Wisconsin, Madison. His primary interest is in facilitating the analytic work of researchers, particularly those with challenging data or innovative analytic approaches. He is the lead developer of Transana, software for the transcription and qualitative analysis of video and audio data.
Contact:
David K. Woods, Ph.D.
Wisconsin Center for Education Research
University of Wisconsin, Madison
1025 W. Johnson St., #345-A
Madison, WI 53706-1706
USA
Tel.: 001 (608) 262 1770
Fax: 001 (608) 265 9300
E-mail: dwoods@wcer.wisc.edu
URL: http://www.transana.org
Dempster, Paul G. & Woods, David K. (2011). The Economic Crisis Though the Eyes of Transana [64 paragraphs]. Forum Qualitative Sozialforschung / Forum: Qualitative Social Research, 12(1), Art. 16, http://nbn-resolving.de/urn:nbn:de:0114-fqs1101169.

Creative Commons Attribution 4.0 International License