Volume 12, No. 1, Art. 23 – January 2011
Researching With NVivo 8
Fiona Wiltshier
Abstract: This paper is based on a project created for the KWALON conference in April, 2010. Due to time constraints and the lack of research experience of some of the people working on the project, we took a team based approach to develop the analysis, and focused on descriptive coding.
This paper addresses both the items for reflection in the "instructions for developers" and the research question posed. Though the analysis of the data was done using software which enabled more to be done than would otherwise have been the case, it is contended that the results obtained are influenced by the researchers themselves, and factors such as the time available, rather than the software itself.
Key words: NVivo; QSR; qualitative software
Table of Contents
1. Introduction
2. Reflections on Using the Software
2.1 How did you use the software? What analysis strategies did you use, for which reasons, and how did the tools in the software enable that?
2.2 How did the software enable you in keeping track of the way your data analysis was influenced by your background, personality, and/or theoretical framework?
2.3 With which type of data did you work best and why?
2.4 How did the software help you in your project? What were down sides, what were good aspects of the software?
2.5 Did the software alter your way of analyzing and if so, how?
2.6 How much time did you spend on the analysis?
3. What We Found
3.1 Comparison of views of causes and consequences between 2008 and 2009
4. Conclusion
This paper is based on a project created for the KWALON conference in April, 2010. A number of developers were contacted and asked to create a project using the same dataset consisting of several types of files (newspaper articles, weblogs, video and audio files in different formats) with the idea of comparing the results obtained using different software. As NVivo allows researchers to work with a wide variety of data, and adopt whatever methodology best suits their research question, it is advocated that it is the researcher who determines the results found, rather than the software used. [1]
All those who worked on the project, including the author, are employees of QSR International, the developers of NVivo, and as such this paper is not meant to be an independent review of NVivo. It does, however, give an account of how we worked together to analyze the data provided and presents the results we found. [2]
2. Reflections on Using the Software1)
2.1 How did you use the software? What analysis strategies did you use, for which reasons, and how did the tools in the software enable that?
Given the volume of data and the limited time we had to spend on the project, we used a team approach with a number of coders in different regions of the world. NVivo has a range of features that support team collaboration such as the ability to identify individual team members' work, compare and fine tune team members' coding, find items created or last modified by team members, or query and interrogate the analysis of team members. [3]
We used the software to gather all of the data together in one place—web-based sources, PDFs, video and data sources. Everything was imported directly into NVivo—there was no need to produce transcripts first for the multi-media sources. We did however, cut and paste the HTML sources into Word documents first. Another approach would have been to link to the HTML sources from NVivo using externals, but as websites change, we chose to copy the information. [4]
Once in the project, the data was organized into folders (which grouped different types of data together) and cases (which represented the different actors in the data), a number of memos were also created where notes could be captured (memos are separate documents where each researcher recorded his/her thoughts and actions during the project). [5]
As the project progressed, each person recorded specific comments on sections of data using annotations (the NVivo equivalent of scribbled notes in a margin). By each person using these tools for the same purpose, we could keep track of each person's thoughts and what they had done in the project. [6]
Once the data had been imported and organized, several copies of the project were made. We chose to work as a team with each person working with different data sources, so each person's copy of the project was amended so it contained the specific data they were going to code. NVivo can store video and audio files of up to 40MB in size within the project, as some of the files provided were larger than this, we chose to include only the smaller files in the copy of the project being sent overseas. If we had chosen to include the larger files, this would have just meant creating a copy of each of the files as well as the project itself and sending those over too. The projects were transferred using a Web-based file hosting service which enabled them to be uploaded in one location (the UK) and then downloaded a few minutes later in another part of the world (the US). Once the researcher in the US had completed her part of the project, she transferred her copy of the project back to the UK using the same method. [7]
As the projects were being worked on, questions and thoughts that arose were addressed either through email or phone contact, whichever was most appropriate. Notes specific to the data in the project were captured using memos and annotations which could then be read in context. [8]
To explore the research question we used open coding to elicit the themes talked about in the different data, some of which were then investigated in more depth using text searches. We also used models, charts and matrices to visualize our data which helped to uncover themes and links. Reports and HTML exports helped us to keep the team on track, and also ensured any colleagues were kept up to date on our progress and findings. [9]
2.2 How did the software enable you in keeping track of the way your data analysis was influenced by your background, personality, and/or theoretical framework?
The software would have allowed us to take either a "bottom-up" or "top-down" approach. We chose the former and began with each coder going through the data and creating nodes2) for relevant information found focusing on the research questions posed by the organizing committee, which asked whether views or arguments of different actors changed between 2008 and 2009 regarding the causes and consequences of the economic crisis. [10]
Given the nature of the conference project, we were working in the absence of key elements of the research process (an intellectual discipline or multi-disciplinary approach, prior involvement with the material, dialogue with stakeholders in the study). We did not therefore attempt to develop an authentic research question to a degree sufficient to drive a choice among qualitative methods. We worked inductively, inspired by the "constant comparison" approach as described by GLASER (1965), and GLASER and STRAUSS (cited in LINCOLN & GUBA, 1985), in developing codes and in our coding process. Each coder began working inductively, developing initial codes to reflect "categories" of data observed, and creating a "node" in NVivo to represent these. Initial coding identified some general causes and consequences of the economic crisis and a number of factors that appeared to emerge as both cause and consequence. As each coder continued through review of the data, these nodes were considered in light of new data, and new nodes were created where required by the data encountered. Moving into the second stage of the constant comparison process, each coder then continued working with the data, in some cases developing hierarchical structures to reflect the inter-relationship of categories, in other cases merging nodes where distinct categories appeared to be superfluous. [11]
Coding was stored as both free and tree nodes3) then arranged in tree nodes as the project progressed. Using both types of nodes allowed the researchers flexibility when coding as they could group nodes together as and when was appropriate. In some instances researchers chose to group nodes together early so they used the tree nodes, in other instances they wanted to keep a node on its own in the free node area until they later decided how to catalogue it in the tree node area. Towards the final stages, most of the nodes were moved into relevant groups in the tree nodes, and in some instances broader categories were represented by creating another level of hierarchy in the tree node structure. [12]
Models were used to reflect on initial nodes and determine possible categories. The models below show pictorial representations of the tree nodes Causes (Figure 1) and Consequences (Figure 2) and the nodes grouped below them. Tools in NVivo can be used for a variety of purposes, for instance models can be used to explore ideas as well as to present them to others. Viewing nodes in a model can help the researcher see different ways of grouping nodes together. These groupings can then be created in the tree node structure.
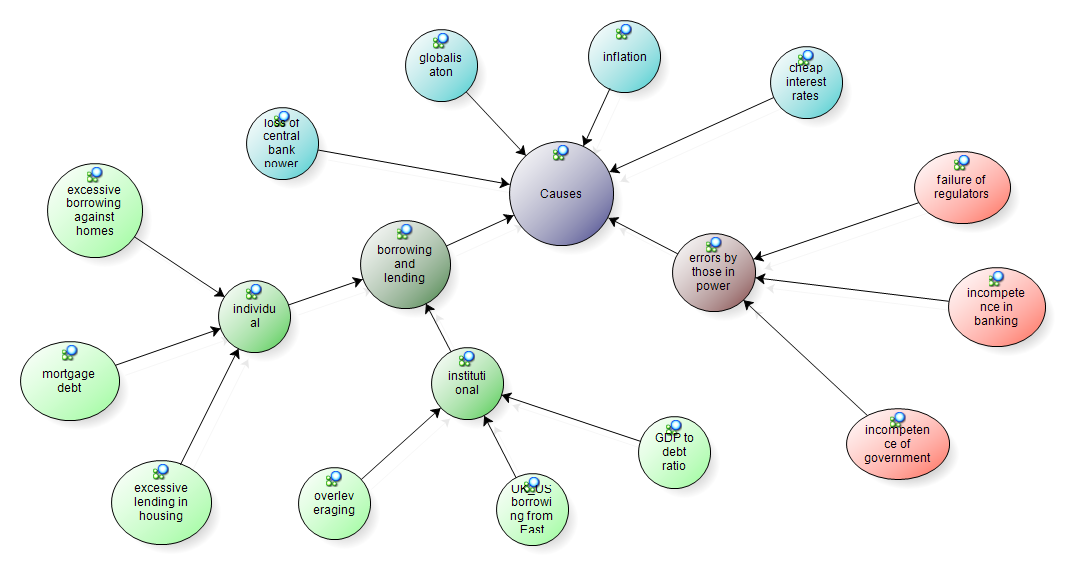
Figure 1: Model of causes nodes (enlarge this figure here)
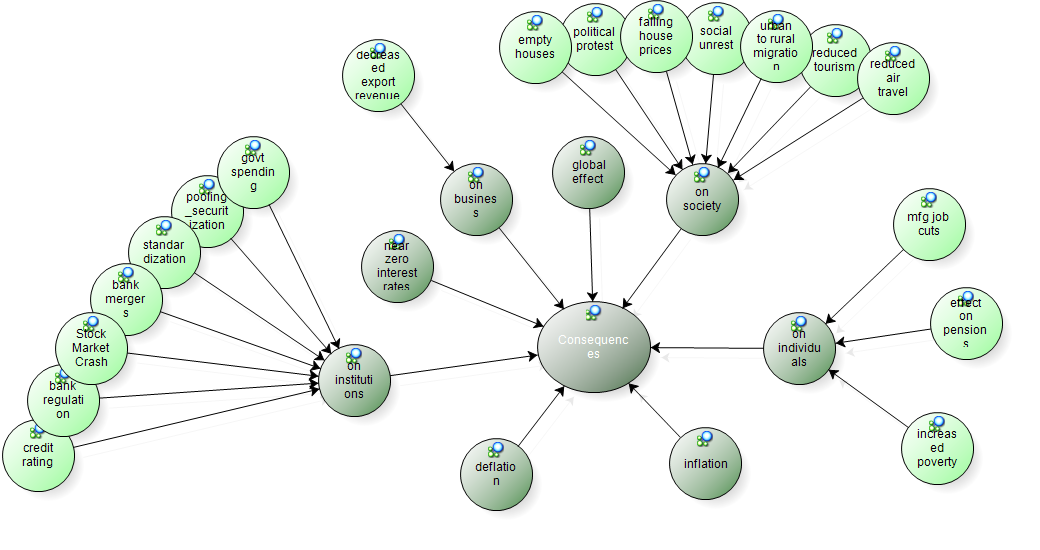
Figure 2: Model of consequences nodes (enlarge this figure here) [13]
This process resulted in different node structures in each coder’s project. Nodes with the same name were, in some instances, created by more than one person; conversely, nodes with different names were sometimes created by other coders but with very similar underlying observations or concepts. Before the projects were brought together through a project merge, reports were created that listed the nodes in each project so they could be compared. Where more than one person had created the same node, this was discussed to determine whether each node represented the same idea; if so, the nodes were left so they would be merged together (combined into one); if not, one was renamed so that both would exist separately once the projects were merged. Once this process was complete, the projects were merged and the combined node systems were structured into a coherent hierarchy by moving some nodes and merging others. Memos and annotations in NVivo allowed us to track our thinking about the analysis, including our “comparison” of data in our review process, and including notes about how our background may have influenced our analysis. These memos and annotations were shared among the team each time the projects were merged to combine coding. [14]
Coding stripes, which can be displayed to represent category nodes or coders, were critical to our process as individual coders and across the team. Viewing and printing coding with coding stripes, and producing other reports on coding allowed us to compare the coding completed by team members. Differences were then discussed as a team. [15]
Coding and matrix coding queries became important as we continued with the second stage and our refinement and integration of our categories. Had we continued with the analysis process through the final stages of theory-building in the constant comparison process, further queries and memoing would have been our key tools. [16]
2.3 With which type of data did you work best and why?
The software doesn't differentiate between data types so we worked with all of our data side by side. For example, a matrix query allowed us to look simultaneously at various actors' discussion of causes of the economic crisis across audio, video, news, and weblogs. [17]
The ability to export coded video, audio and other material into HTML made it easy for us to share results outside the software. The HTML file created once a node is exported presents the data in its original format, whether as sections of text or an image, or clips of audio and video files. [18]
2.4 How did the software help you in your project? What were down sides, what were good aspects of the software?
Using NVivo to analyze the data was helpful in a number of ways. It allowed us to work systematically through a large dataset, we were able to import different data types into the project and group them in various ways using folders, set and cases so that we could access data easily and see at a glance which sources had been coded. We were able to work easily together as a team. We could reduce the datasets in different projects and then easily merge the work together with the rest of the data at a later stage. As projects are stored as single files, we were able to transfer project between remote researchers with ease. Even though team members were in different continents, we could track our progress. Once coding was complete, it was especially helpful in allowing us to compare data across different actors, locations, years, and so forth, some of which were "variables" anticipated by the research questions, others of which emerged during our analysis. It also allowed us to uncover themes using a range of tools including visualizations such as models and charts, and allowed us to share our findings with others. [19]
The downsides we experienced were that, given the changing nature of HTML data, we needed to first copy it into a Word document. We could have linked directly to HTML using an "external"—but as live HTML data changes, we chose to copy it first. Also, it would have been easier if all of our team members could work in the same project at the same time, though we were able to easily merge everyone's work together as needed. [20]
2.5 Did the software alter your way of analyzing and if so, how?
NVivo made it possible for us to do things that simply wouldn't have been possible manually in the time available. It enabled us to search for words and phrases, some of which were anticipated, others emerged as we proceeded with the analysis, (e.g., "subprime"), it enabled efficient review of coded material (e.g., I would like to see all of the material we have coded for "housing market") and allowed us to quickly ask questions about our coding, uncovering differences in the data between different actors. For example, we were able to query the content coded for "housing market" across time, actors, or other themes. [21]
2.6 How much time did you spend on the analysis?
The analysis was conducted for the purpose of preparing the conference presentation; it was not conducted to the same depth and with the same rigor that we would have applied were we authentically pursuing the research question. In a "real-world" research process, the time devoted to analysis would be greatly increased, and the time required for preparation and import of data might be reduced (for example, some efficiency could be gained in gathering web-based data in a single step). To date we spent around five hours preparing and importing the data, and in total around 20 hours on the analysis. How much more analysis time would be required would depend both on the final aims of the project and the approach chosen for coding and analysis. [22]
While our team included social scientists, none of us were economists or political scientists. The research question focused on whether views or arguments of different actors changed between 2008 and 2009 regarding the causes and consequences of the economic crisis, so to explore this, we organized the data into different countries, constituents (these represented different roles played by actors e.g. business leader, government leader, news source etc.) and years (where known).This enabled us to investigate the difference in views between 2008 and 2009 for a number of different actors. Of all the tools available to us, we mostly used the matrix query to investigate the research question as it was comparative in nature. We could have also used the coding and compound queries to investigate the data which would have enabled more specific questions to be answered but, as a way of comparing the views of different actors and time periods, the matrix proved the best option. The exploratory queries such as text search and word frequency had proved useful earlier in the project but a different sort of query was needed as we moved further into the analysis. [23]
3.1 Comparison of views of causes and consequences between 2008 and 2009
To compare across the years, we wanted to get as direct a comparison as possible and so chose to focus on a dataset which had a comparable number of sources from both years. Through a matrix query we found that the data collected from Great Britain had the most comparable number of sources (12 from 2008 and 15 from 2009) so another query was run, this time just on this data to compare whether the issues talked about in 2008 differed to those talked about in 2009. [24]
The results indicated that similar causes were cited for both years but a difference in consequences appeared, with views moving from seeing the impact on institutions and society in 2008, through issues such as bank regulation and standardization, to the impact on individuals in 2009, through issues such as job cuts and the effect on pensions.
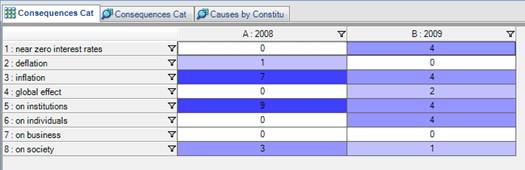
Figure 3: Matrix comparing different views of consequences between 2008 and 2009
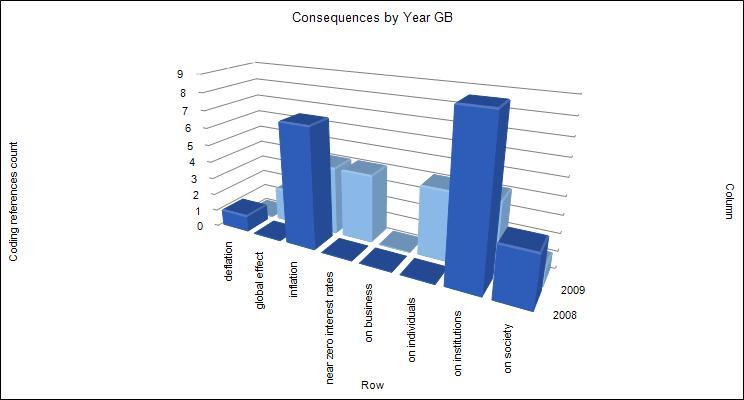
Figure 4: Chart showing differing views of consequences between 2008 and 2009 (enlarge this figure here) [25]
Other analyses explored views across different constituents. Based on the data we coded, there were a number of differences in the causes and consequences mentioned. [26]
In 2008, those who talked about the causes of the crisis were mostly business leaders and think tanks who focused on issues around borrowing and lending, such as excessive lending, mortgage debt and overleveraging, as well as institutional factors such as incompetence in banking and the failure of regulators. In 2009 these issues seemed to stay consistent though the actors were different, with government leaders, individuals, and news sources echoing the sentiments of the business leaders from the year before. [27]
Regarding consequences of the crisis, in 2008, government leaders and news sources both focused mainly on inflation and the near zero interest rates, deflation and the effect on institutions such as bank mergers and regulations, the effect on credit ratings and the stock market crash. Views broadened in 2009 with a greater focus on the impact on both individuals and society with actors such as the UN and the World Bank, together with individuals, adding their voices to those of the other constituents, bringing attention to political protest and social unrest. [28]
As is typical in qualitative analysis, our work raises further questions for analysis. The project is set up to accommodate additional sources or new coders. Further analysis would depend on the aims of the researchers using this project. Unfortunately due to the workload associated with the launch of NVivo 9 our team was not able to undertake further analysis on the dataset following the conference. [29]
As NVivo allows researchers to adopt whatever methodology they choose to analyze their data, we argue that where other researchers may offer different interpretations of the data analyzed, this would be more a reflection of the researchers themselves rather than the software used. [30]
NVivo 8 allowed us to work with all data, in the same way, in the same program. It allowed us to systematically work through the data, and also allowed us to identify and uncover emerging themes using queries. Visualization tools also helped us to see our information from a new perspective and a range of tools helped us to share our findings, including a HTML format export that allowed us to share all data including audio and video files. We could work easily as a team, each working on our own data and then merging all the projects together. [31]
As our work represents the beginnings of an analysis we contend that further analysis may elicit more trends. We were also working with a team of researchers, some of whom were very inexperienced and so that, and the time available, also affected the final conclusions drawn. Although the software did make it much easier to work with the data, and allowed us to question the data in ways that would have been very hard to do manually, it is contended that as all the work was done by us as researchers, it is ourselves, rather than the software we used, who most affected the analysis and the results drawn. [32]
1) The following section headings are based on the questions the developers were asked to address during their presentations at the KWALON conference. <back>
2) Nodes in NVivo allow users to represent specific themes, places, people or other area of interest, and where appropriate, to gather data together that is relevant to the theme the node represents. <back>
3) Tree nodes allow nodes to be grouped into hierarchies whereas free nodes are listed alphabetically in a separate folder. Nodes can however easily be moved from one folder to another without altering the name or coding done. <back>
Glaser, Barney G. (1965). The constant comparative method of qualitative research. Social Problems, 12, 431-45.
Lincoln, Yvonna S. & Guba, Egon G. (1985). Naturalistic inquiry. Newbury Park, CA: Sage.
Fiona WILTSHIER is the QSR Training and Research Consultancy Manager for Europe, Middle East and Africa. She has a background in qualitative research but now focuses on conducting training and consultancies around the region to support users of QSR software.
Contact:
Fiona Wiltshier
Training and Research Consultancy Group
QSR International (UK) Ltd
28 Hoghton St, Southport, UK PR9 0PA
UK
Tel.: 01704 513900
E-mail: info@qsrinternational.com
URL: http://www.qsrinternational.com/
Wiltshier, Fiona (2011). Researching With NVivo 8 [32 paragraphs]. Forum Qualitative Sozialforschung / Forum: Qualitative Social Research, 12(1), Art. 23, http://nbn-resolving.de/urn:nbn:de:0114-fqs1101234.

Creative Commons Attribution 4.0 International License