Volume 12, No. 1, Art. 37 – January 2011
Finding Fidelity: Advancing Audiovisual Analysis Using Software
Christina Silver & Jennifer Patashnick
Abstract: Specialised software for the analysis of qualitative data has been in development for the last thirty years. However, its adoption is far from widespread. Additionally, qualitative research itself is evolving, from projects that utilised small, text-based data sets to those which involve the collection, management, and analysis of enormous quantities of multimedia data or data of multiple types. Software has struggled to keep up with these changes for several reasons: 1. meeting the needs of researchers is complicated by the lack of documentation and critique by those who are implementing software use and 2. audiovisual data is particularly challenging due to the multidimensionality of data and substantial variety in research project aims and output requirements. This article discusses the history of Computer Assisted Qualitative Data AnalysiS (CAQDAS) as it relates to audiovisual data, and introduces the term "fidelity" as a conceptual mechanism to match software tools and researcher needs. Currently available software tools are examined and areas found lacking are highlighted.
Key words: CAQDAS; audiovisual data; ATLAS.ti; MAXqda; NVivo; Transana; DRS; qualitative analysis; visual analysis
Table of Contents
1. Introduction
2. Historical and Technical Contexts of Audiovisual Analysis Using Software
2.1 Technological developments for audiovisual analysis
2.2 Documentation of analytic procedure using software
3. Fidelity in Data and Software Tools
3.1 Fidelity of qualitative data
3.2 Fidelity of software tools
4. Tasks and Procedures for Analysing Audiovisual Data
5. Transcription Philosophies and Procedures for Audiovisual Data
5.1 Synchronicity between written transcriptions and associated audiovisual data
5.2 Multiple transcripts for individual media files
5.3 Synchronising multiple video streams and heterogeneous data
6. Managing, Sorting and Sequencing Data
6.1 Storing and accessing data
6.2 Grouping, displaying and sequencing still images
7. Marking and Annotating Data
7.1 Visually annotating still and moving images
7.2 Textually annotating still images
8. Organising Data through Code Application
9. Hyper-linking Tools for Tracking Associations and Processes
10. Representing and Sharing Data
11. Discussion and Conclusion: Blunt Tools for Fine Purposes
The use of audiovisual data in research is long established across many fields. Disciplines such as anthropology and ethnology have utilised hand crafted images from the mid 19th century, and images began to appear in sociological texts from the early 20th century, although visual sociology did not emerge as a formal sub-discipline until the 1970s (see SCHNETTLER & RAAB, 2008 for a historical overview). The emergence of digital technology has spawned an increased use of images and audio recordings and disciplines as diverse as education, geography, film studies, cultural studies, media studies, and visual ethnography now utilise audiovisual data in a variety of ways. There is, however, an important distinction to be made between using audiovisual records for primarily illustrative purposes and their being formally analysed as sources of data in their own right. This is related to the role and analytic status of audiovisual data within a given project as well as methodological and disciplinary traditions. Specific disciplines, for example, have tended to develop individual analytic procedures, usually in isolation (HINDMARSH, 2008), which reflect the status of audiovisual data within analyses. This paper discusses the analysis of audiovisual records, as they can be supported by Computer Assisted Qualitative Data AnalysiS (CAQDAS) packages. We seek to contribute to the refinement of these packages by evaluating selected tools in terms of their suitability for audiovisual analysis, illustrating that many are not sufficient for the analysis of high fidelity audiovisual data. Section 2 provides some historical and technical context to the discussion. Section 3 outlines our understanding and use of the concept of fidelity in evaluating CAQDAS tools for audiovisual analysis. Section 4 provides an overview of selected tasks and procedures for analysing audiovisual data as supported by CAQDAS packages. Section 5 discusses transcription philosophies and procedures for audiovisual data. Section 6 covers the issues of organising, sorting and sequencing audiovisual data. Section 7 focuses on marking and annotating audiovisual data. Section 8 discusses indexing audiovisual data through coding. Section 9 discusses hyper-linking tools as alternatives to code-based tools for handling non-linear associations within audiovisual data. Section 10 discusses limitations of CAQDAS packages with respect to representing and sharing data. The paper concludes with Section 11 by arguing that current provision for audiovisual data analysis in CAQDAS packages is insufficient, suggesting that many tools are too blunt for the fine analytic purposes such data demands. [1]
2. Historical and Technical Contexts of Audiovisual Analysis Using Software
Technically supported methods for the systematic analysis of audiovisual data are not well established. From the mid-1980s, CAQDAS packages began to offer analogous possibilities for qualitative data as had been developed for quantitative data from the mid-1960s. Initially most CAQDAS packages only provided tools for handling textual data. Increasing accessibility and normalisation of digital technology, and the use of audiovisual records as data within social research, began to increase in the following years; enhanced recording, storage and processing facilities enabled the generation of voluminous high quality audiovisual data. These trends are reflected by the increased ability of CAQDAS packages to handle audiovisual data. [2]
2.1 Technological developments for audiovisual analysis
Computational support for the analysis of audiovisual data in the qualitative data analysis field is variable. Although some CAQDAS packages provided audiovisual capabilities early on, integration of software-based audiovisual analytic support has picked up pace more recently. Early adopters of audiovisual functionality include HyperRESEARCH and ATLAS.ti, although Transana was one of the first to provide specific tools for the transcription and analysis of video. Latterly, other CAQDAS packages have added audiovisual facilities to their hitherto text-based suite of tools, notably NVivo and MAXqda, and a convergence of tools is beginning to occur within the CAQDAS field in this respect. More individualised software packages have also emerged, concentrating on particular aspects of qualitative audiovisual analysis. MiMeG and DRS, for example, are both packages developed in UK universities as part of funded research projects. They take explicitly methodological approaches to software development, addressing identified gaps in software provision for particular analytic needs (FRASER et al., 2006; BRUNDELL et al., 2008; HINDMARSH, 2008). [3]
Despite the long and varied use of visual data, there seems to be a lack of cross-fertilisation of methods and tools between disciplines. In parallel to the development of CAQDAS packages, tools derived from educational, behavioural, linguistic, and psychological perspectives offer some quite distinct analytic possibilities for audiovisual data. These include: ELAN (EUDICO Linguistic Annotator), INTERACT and Observer1). These packages however, tend not to be rooted in qualitative social research traditions, usually taking a more quantitative approach to the analysis of audiovisual data. They also tend to be very expensive in comparison to CAQDAS packages, and are therefore not widely accessible to research communities. Photo/video editing packages, such as Paint, Photoshop, iMovie etc. can also be used for analytic purposes, often providing tools that, although not specifically designed for such purposes, can provide flexible and powerful analytic affordances. We focus primarily on the audiovisual functionality of CAQDAS packages as they have been specifically designed to support the qualitative analysis of qualitative data. However, we make reference to photo/video editing software tools where we consider them to be particularly useful, for example, where they offer analytic advantage over CAQDAS packages. [4]
2.2 Documentation of analytic procedure using software
In addition, discussion of the practical or technical procedures for analysing qualitative data using software is lacking in the social science literature. This is the case for the analysis of text as well as audiovisual data. Some recent exceptions include MACMILLAN (2005) who evaluates CAQDAS packages for the purposes of discourse analysis; MAVROU, DOUGLAS and LEWIS (2007) who evaluate the role of Transana in supporting the analysis of verbal and non-verbal interactions in video; KONOPASEK (2008) who illustrates the role of ATLAS.ti in facilitating a grounded theory analysis; SILVER and FIELDING (2008) who discuss software tools for analytic approaches used within psychology; FIELDING and CISNEROS-PUEBLA (2009) who consider the scope of software to facilitate the convergence between qualitative geography and qualitative social science; and KING (2010) who describes his use of NVivo for membership categorisation analysis. There are also some critiques of qualitative software generally (BROWN, 2002; COFFEY, HOLBROOK & ATKINSON, 1996), descriptions of the use of video editing tools for analytic purposes (SECRIST, KOEYER, BELL & FOGEL, 2002) and examples of workaround solutions for conducting audiovisual analysis when social science software solutions for visual data were in their infancy (MASON & DICKS, 2001; RICH & PATASHNICK, 2002). Although it may appear that the above examples are numerous, in the context of the number of qualitative studies conducted, they are infrequent and it is notable that it is only in the last ten years that they have appeared, while CAQDAS packages have been developing for nearly thirty years. Such discussions are to be encouraged as they are valuable in assessing the validity of analyses, helping other researchers make informed choices between tools and identifying areas for software development to support specific analytic approaches. [5]
Much of the literature concerning the analysis of audiovisual data, however, provides general discussion concerning methodological approaches and data collection issues, rather than documenting and discussing specific techniques or procedures within a particular project. Methodological discussion concerning audiovisual data focuses on a range of issues including their power or role, their production, multimodal form, or about how they can represent experience. Examples include the relationship between epistemology and methodology (STANCZAK, 2007), the use of still and moving cameras as data collection tools (HOLLIDAY, 2007), the representation of or communication with non-textual media (GRADY, 2008; PINK, 2008), and the reflexive dimension of video practices (MONDADA, 2009). [6]
Some authors do document their approach to audiovisual analysis, often being quite explicit about their epistemological and methodological underpinnings. For example, STIGLER, GALLIMORE and HIEBERT (2000) outline a survey approach to analysing video data; HEATH, HINDMARSH and LUFF (2010) outline practices involved in the close consideration of communicative devices in video; and BELL (2001) describes the quantitative content analysis of video. However, these authors usually neglect to report whether software was used to facilitate the analysis, or to specify or explicitly evaluate the utility of computational support where it was used. A particularly striking example is the 2008 FQS Special Edition on Visual Methods, in which editors SCHNETTLER and RAAB indeed make a similar criticism in their introduction to the collection. However, there are few references in the following eighteen articles specifically about analytic techniques or procedures, and none discusses the use of software to facilitate analysis. Despite considering in detail the analytic requirements of video data, such as their constructiveness, complexity, naturalness, sequentiality, and transcription, SCHNETTLER and RAAB themselves brush over the topic of computational analytic support simply stating that "... analysing video data requires intelligent storage and cataloguing systems for raw data, powerful computer hardware and a series of software tools to digitalise, transcribe and analyse data and to present research results" (2008, p.16). [7]
The relative lack of detailed documentation about analytic and technical procedures or critiques of software utility represents both an important gap in the literature and a failure to be transparent and reflexive. This mirrors the history of discussions concerning qualitative data analysis more generally, which were typically also slow to critically evaluate the processes that the rise of qualitative software afforded (FIELDING & LEE, 1998). As a result the analysis of audiovisual data remains largely shrouded in a level of mystery which obscures the ability for methodologists to evaluate methods and findings adequately, or for researchers to formally contribute to the development of more refined software tools. [8]
Whether researchers are not using technology to facilitate the analysis of audiovisual data or simply not reporting their use is unclear. The process of learning a new software tool may represent an overly steep learning curve for some researchers who have established satisfactory alternative methods. Although arguably changing, there has also historically been an identified lack of institutional support for the use of qualitative software in many universities (FIELDING & LEE, 2002) and the cost of some software products may be prohibitive. In addition, many researchers may be limited in making project-based choices regarding the CAQDAS package they will use by institutional availability, a trend that may be increasing amongst student populations in particular due to aggressive marketing and the increasing existence of institutional licenses for only one product. [9]
There may also be a lack of awareness concerning software availability and functionality, a misunderstanding of the contribution software can make, a perceived inadequacy of software tools, and/or a satisfaction with established (albeit equally undocumented) alternative procedures. Scepticism amongst established qualitative researchers concerning the use of qualitative software more generally certainly remains and the same may be true of those working with audiovisual data. Understanding the significance of these factors is crucial to the refinement of CAQDAS tools and their increased uptake for audiovisual analysis. [10]
3. Fidelity in Data and Software Tools
Fidelity broadly refers to the sense in which increasing complexity of data requires increasingly robust and flexible tools for analysis. We refer to fidelity of data and fidelity of software tools as two distinct, but inter-related aspects. Fidelity of data is related, in large part, to how close, or faithful, to the original occurrence that data remains. We use the concept to enable an analytically grounded discussion of the role and utility of current software tools in analysing audiovisual data. Fidelity of software tools relates specifically to their ability to handle complex, high fidelity data. [11]
3.1 Fidelity of qualitative data
The fidelity of qualitative data encompasses 1. quality, 2. temporality, 3. access to emotional context, and 4. loyalty of reproduction. [12]
Qualitative data (text, image, audio, and video respectively) can be placed on a scale in terms of the quality required for analysis. Text can be of very low quality before it becomes illegible and therefore of little analytic value; for example, vwls cn b rmvd frm sntncs nd th txt cn stll b rd, ndrstd nd ntrprtd. Original or scanned copies of hand-written archival documents are often of a low quality, but still constitute valuable historical materials for analysis. As such, it is possible to analyse history through the written word, even if the source documents are in disrepair. With still images, whilst the higher the resolution the better, as long as sufficient distance is maintained between the image and the eye, low resolution images (or those with large pixel size) are sufficient for identification and analysis. Even the quality of audio can be somewhat compromised and still be analysable; over the course of a minute, for example, whole words can be dropped without totally obscuring the gist of the conversation. However, with video, only a small number of dropped frames or a slight mismatch in synchronicity between the visual and audio streams is required to make the entirety unusable. In addition, the quality of video in terms of picture quality (for example, whether it is highly pixilated, stops intermittently, or the camera is not held steadily) is important. In particular, low picture quality can compromise the ability to analyse subtle movements such as gaze and gesture, crucial when analysing interaction. [13]
Of qualitative data types, video is the most multidimensional and therefore its fidelity is of the most importance in generating analysable data. Video provides access to the complexity of the empirical world in ways not previously possible, enabling additional layers of analysis. [14]
For data to be interpretable and, therefore, analysable, it not only has to be of sufficient quality, but the temporality should also be sufficient; that is, it needs to be present for a minimum duration in an appropriate context. Time requirements for the interpretative processing of different forms of data vary distinctly. For example, if an image is flashed momentarily, one can usually still determine what it is. However, if you only hear a millisecond of audio input, it is impossible to determine the source content. Video, being inherently more complex, or multidimensional, requires even more time to process. [15]
The third aspect of our use of the term "fidelity of qualitative data" relates to emotional tone. Transcriptions, whether fully verbatim, Jeffersonian or gisted (see EVERS, 2011, this issue) for discussion of different transcription formats) do not in and of themselves communicate tone. A still image is also insufficient to determine emotional tone, because the snap-shot has been taken out of context. Due to their multidimensionality, visual elements can only be described and not transcribed. However, audio and moving images provide the cues which aid the interpretation of the emotional tone of a situation. [16]
Fidelity of qualitative data is also closely related to their initial production and any stages of reproduction. An important aspect of the fidelity of qualitative data can therefore be seen as "loyalty of reproduction". A copy of a copy of a copy of text is still useable. A copy of a copy of a copy of an image is likely still usable. A copy of a copy of a copy of an audio recording may be difficult to understand. A copy of a copy of a copy of a video is even worse. Although digitisation reduces this problem, it is essential to avoid a loss of fidelity when reproducing audiovisual data for analytic and representational purposes. [17]
The four properties of the fidelity of qualitative data; quality, temporality, access to emotional context, and loyalty of reproduction, are of differing importance according to the type of qualitative data being analysed, ranging on a scale from textual, through audio, graphic, and video. There has been an increase in the average fidelity of qualitative data in recent decades as audiovisual data has become more widely used as a primary source of data. [18]
3.2 Fidelity of software tools
The tools required for analysing audiovisual data depend upon a range of factors including the status of the data within the context of the whole project and methodologically derived analytic needs. The properties of text, audio, still images, and video pose different demands, only some of which are met by bespoke CAQDAS packages. [19]
Early CAQDAS tools provided blunt analytic instruments. What they could accomplish, potentially quicker than manual means, tended to provide a clumsy path through the data. For example, textual data had to be formatted in particular ways and there was often a set minimum unit of data to which the tools could be applied; usually a fixed line. Flexibility was lacking; therefore, some nuances and subtleties possible with manual methods remained inaccessible. However, as CAQDAS packages have developed, and the ability to handle audiovisual data been incorporated, they provide an increasing number of tools ranging from the fairly blunt to the extremely fine. This is what we call increasing "fidelity of software". [20]
When conducting a project using several types of data, the availability and fidelity of software tools becomes more important. It is an increasingly common requirement to handle several different data types within one project, to fully integrate them whilst maintaining the ability to view them independently, and to analyse them from different perspectives. Data may need to be integrated as well as, or rather than, being treated in isolation, sequence, or parallel. A longitudinal case study, for example, requires the ability to conduct within and between case analyses. A collaborative project may involve contributions by several researchers which require combining. Alternatively, a project considering the interaction between participants as well as the content of what is being said requires the same data to be considered from different standpoints. Other projects may benefit from the analysis of extant literature on the topic(s) of interest, and the researcher may wish to combine articles into the same software project as the data is analysed within. [21]
Digitisation of video and the availability of affordable video recording equipment (see EVERS, 2011, this issue) and digital storage space, in combination with the development of software to support their analysis, has enabled the potential to manage and systematically analyse audiovisual data significantly more easily. As the remainder of this article illustrates, the fidelity of software tools and how they allow researchers to approach analysis is struggling to keep pace with the increasing fidelity of qualitative data and complexities of research projects. [22]
4. Tasks and Procedures for Analysing Audiovisual Data
The range of software tools available to facilitate the analysis of audiovisual data reflects the range of uses of and approaches to data. Appropriate tools will depend on a variety of factors, including the nature and status of records, disciplinary traditions and individual project dynamics. Yet no industry standard has emerged. Indeed, attendance at software training workshops provided by the CAQDAS Networking Project indicate that, although continually increasing, qualitative software is not equally dispersed across disciplines and approaches. Despite some claims that qualitative software homogenises qualitative analyses by supporting code-based approaches (COFFEY et al., 1996; HINDMARSH, 2008), there are, in fact, subtle yet important differences in software functionality, and tools can be manipulated to support non code-based approaches to qualitative data generally (SILVER & FIELDING, 2008) and the analysis of audiovisual data specifically. Indeed, as illustrated in the remainder of this article, despite some limitations, there are many ways in which CAQDAS packages contribute to the systematic analysis of visual data and to increasing transparency and rigour in procedure. We do not describe them all here as this has been done elsewhere (LEWINS & SILVER, 2007, SILVER & LEWINS 2010). However, Figure 1 illustrates the main qualitative tasks which these packages enable, for the analysis of qualitative data generally.
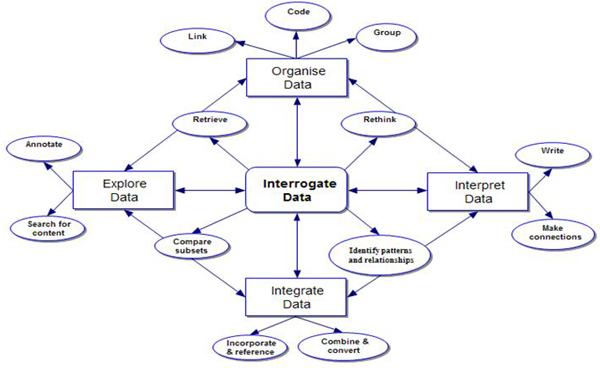
Figure 1: Qualitative tasks and CAQDAS tools, adapted from LEWINS and SILVER (2007) [23]
The tasks of data integration, organisation, exploration and interpretation are relevant to all qualitative analyses, although the ways in which they are executed with the support of software varies according to factors including research topic, data types, methodology, analytic approach, team dynamics and intended research outcomes. [24]
Data integration refers to ways of handling different data types within CAQDAS packages. We distinguish between relatively basic means of incorporating diverse records into a software project and referencing relevant externally held materials with the more complex tasks of combining and converting qualitative and quantitative data in mixed methods approaches, as facilitated by software tools. [25]
CAQDAS packages generally provide three distinct means of organising data within projects. Grouping is the process by which known data characteristics, such as socio-demographic variables are applied to data records in order to subsequently make comparisons. Coding is the thematic or conceptual organisation of segments of data (e.g. passages of text, clips of audio/video files or selections of graphic files). Linking tools provide a more flexible means of organising data, based on non-linear associations. [26]
Data exploration refers to ways of exploring the content of data. Queries can be run in order to count the frequency of word and phrase occurrence in textual data and passages be automatically coded on that basis. Alternatively data can be more carefully marked and commented upon using annotation tools. [27]
Most of the tools provided by CAQDAS packages are designed to facilitate interpretation, but some are particularly useful in enabling the researcher to reflect on processes and data. Memo tools provide large writing spaces where notes can be kept throughout the analytic process. Mapping or networking tools provide means to step back from data to make or visualise connections. [28]
Having embarked upon the tasks of integration, organisation, exploration and interpretation, CAQDAS packages provide powerful means of interrogating the data set based on earlier work. At a basic level, data can be retrieved in various ways (e.g. according to how they have been organised), at any stage of the process, allowing the researcher to reflect upon themes and concepts. At a more sophisticated level, having grouped and coded data, comparisons can be made across and within subsets of data and patterns and relationships identified through the use of various query tools and data display options. Not only do CAQDAS packages provide tools to support these tasks, they have been designed to reflect and reinforce the iterative, non-linear nature of qualitative data analysis. As such, there are no hard and fast rules concerning which tools to use, in which order and in which way. Researchers are able to pick and choose tools and to manipulate them to suit their needs. [29]
Most CAQDAS packages were initially developed as textual analysis tools and therefore not all functions are relevant to the analysis of audiovisual data. Table 1 provides a comparative overview of some key functions provided by CAQDAS packages with respect to audiovisual data.
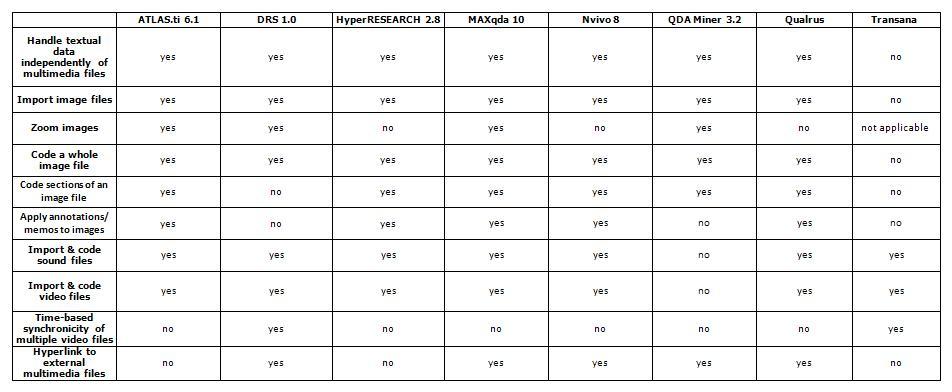
Table 1: Summary of main audiovisual functions amongst CAQDAS packages. Please click here for an increased version of Table 1. [30]
Being able to handle textual data independently of multimedia files relates to the ability to incorporate diverse, unrelated data files within a software project. This is standard functionality across CAQDAS packages, with the exception of Transana, which, as an audio/video analysis tool, prioritises audiovisual data such that textual data is linked to them in the form of transcripts.2) Applying annotations or memos to images relates to the ability to associate written commentaries or descriptions with images. This is discussed further in Section 7. Time-based synchronicity of multiple video files refers to the ability to directly link several video files representing different perspectives on the same event or phenomena in order to view them simultaneously. This is discussed further in Section 5. With respect to audiovisual data analysis specifically, certain tools may be more or less useful. In this context we distinguish between data handling tools, data analysis tools and data representation tools as these are three key considerations when working with such data. Data handling tools are those which facilitate the management and organisation of data files. This includes aspects such as the file formats accepted by the CAQDAS package and the ease of manipulating how they are viewed within the software (e.g., the ability to zoom images without loss of resolution and flexibility in controlling video frames). Data analysis tools are those which are specifically designed to facilitate processes of analysing data, such as keeping track of processes and analysis through memo systems, annotating data and code and retrieve functionality. Data representation tools are those which enable data or analysis thereof to be visualised or reported upon. Figure 2 places selected CAQDAS tools that are particularly relevant to the analysis of audiovisual data within these three groupings, illustrating that there is interconnectivity between them and that many tools can have multiple purposes.
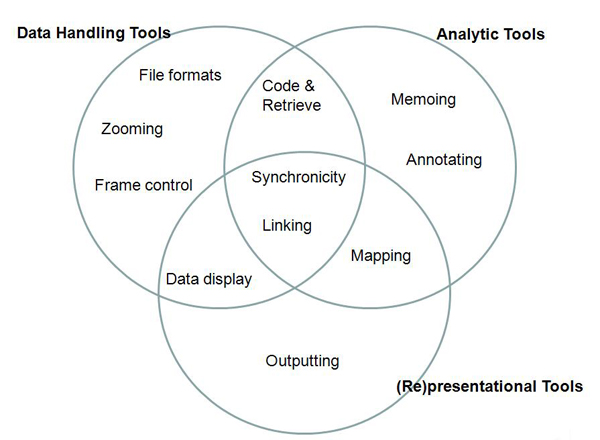
Figure 2: Selected analytic tools for analysing audiovisual data [31]
The remainder of this paper concentrates on the following topics: transcription philosophies and procedures for audiovisual data (Section 5); managing, sorting and sequencing data (Section 6); marking and annotating data (Section 7); organising data through code application (Section 8); hyper-linking data to track associations and processes (Section 9); and representing and sharing data (Section 10). With respect to these tasks, the practical and analytic utility of software tools are discussed in specific relation to their appropriateness for the analysis of audiovisual data. [32]
5. Transcription Philosophies and Procedures for Audiovisual Data
Transcripts comprise many different forms, varying from fully verbatim (or exact) Jeffersonian transcriptions, to summary overviews of content, logs of observed and implied action or visual maps of conduct. Some CAQDAS packages can handle audiovisual data directly, without the need for an associated textual transcript, while others require a written transcript of some sort. This may be a key, methodologically determined decision by the researcher, or be affected by practicalities such as available time or funds. Studies primarily concerned with aspects of non-verbal communication and interaction may work directly with source media, utilising annotation and coding tools to identify, structure and compare segments. The content and interpretation of what is said may be superfluous to the core analytic task and therefore a written transcript of any sort may act as a barrier rather than a means of adding analytic insight. [33]
In contrast, a detailed analysis of interactions within small extracts of video may necessitate the mapping of visual and vocal conduct (see for example HEATH et al., 2010). Indeed, developing a written transcript can be an important analytic task in its own right, providing an additional dimension to data (see also EVERS, 2011 and WOODS & DEMPSTER, 2011 both in this issue). Where the content of talk is important it is difficult to obviate the need for a transcript of some sort. Interactional information can be included, through the use of formatting devices such as colour, font, etc., as a visual means of differentiation or where software provides short cut tools for inserting common transcription conventions. Transcripts can thereby contribute to the fidelity of qualitative data, facilitating the interpretation of complex situations. [34]
5.1 Synchronicity between written transcriptions and associated audiovisual data
The ability to synchronise written transcriptions with corresponding audiovisual files is a relatively recent development in most CAQDAS packages, reflecting the concurrent increase in availability and use of digital media. Transana and DRS are the exceptions as such synchronicity has been at the core of their functionality since their outset. Synchronising transcripts with audiovisual files through the use of time codes enables their simultaneous playback, with text being highlighted as the corresponding audio/video plays (see Figure 3). Creating synchronised transcripts is a time-consuming analytic process, the technical aspects of which require practice. The ease with which synchronicity is achieved within CAQDAS packages varies, but most also enable time stamped transcripts developed externally to be imported and retrospectively associated with corresponding media.3) Some packages, such as DRS, Transana and NVivo additionally offer visualisations of the audio waveform; illustrating the rise and fall in volume throughout the time-span of the audio recording. This is fully synchronised with the moving images and any written transcript that is created, providing a multimodal representation, thereby facilitating a holistic analysis; i.e., one that takes account of the multimodality of the different data types and the complexity of the phenomena they represent. This can also be seen in Figure 3.
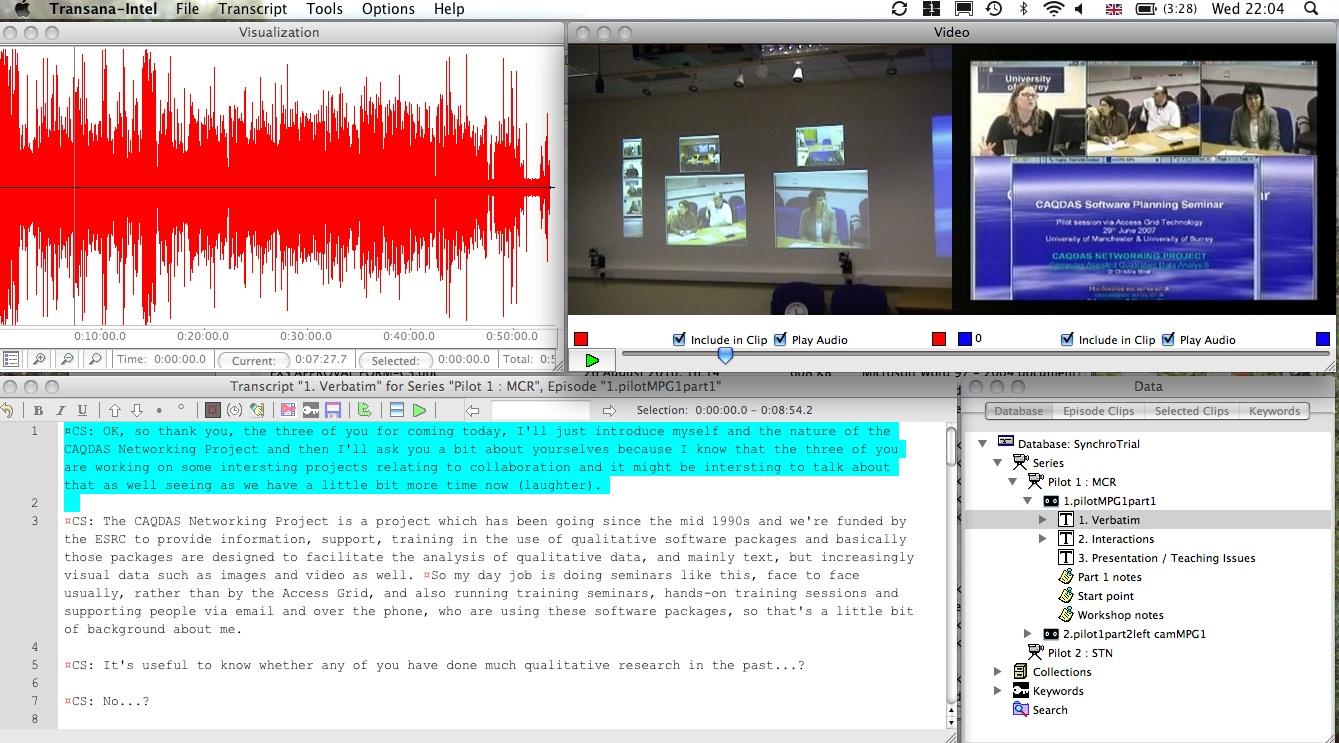
Figure 3: Synchronicity between video and associated textual transcript: example in Transana. Please click here for an increased version of Figure 3. [35]
Synchronicity helps overcome limitations in the fidelity of individual data types. When working primarily with a written transcript, the ability to hear the audio or see the video simultaneously can circumvent missing data, for example when recordings are distorted, allowing transcriptions to be improved incrementally. In respect of audio data, for example recordings of interviews or meetings, being able to hear the tone of speech as well as reading the content enables a fuller appreciation of the meaning. Similarly, seeing an interaction occur as well as scrutinising a written representation of it enables a more holistic analysis. Where a written transcription is seen as an aid to analysis and the data under scrutiny is more than a few minutes in length, CAQDAS packages provide significant advantages over other tools such as audio/video editing software because of the other qualitative analysis tools such as annotating, memoing, coding and flexible and powerful interrogation tools. [36]
The presentation of media, once audio/video files have been synchronised with transcripts, is an important factor. Initially NVivo's tabular presentation is appealing (see Figure 4). The closeness of each transcript row to the video is convenient as is the immediacy with which the two are associated upon transcript row creation. However, tabular formats are analytically restrictive; time saved when transcribing into immediately synchronised tables may not be worth the loss of flexibility in which the format results. For example, each NVivo transcript row represents a time-stamped segment of audio/video. Although individual rows can be resized in terms of time-span and additional rows inserted, both processes are fiddly in ensuring faithful sequencing is maintained in the table and between media. It is therefore beneficial to avoid altering transcripts as much as possible, and so the creation of each segment when transcribing represents a significant analytic decision. These limitations effectively result in the need to work with pre-defined (although user-defined) units when handling audiovisual data via a transcript, in a similar way that some early versions of CAQDAS packages handled text.

Figure 4: Written transcript in row display, example in NVivo. Please click here for an increased version of Figure 4. [37]
Another limitation relates to the creation of additional columns in the tabular transcript, for example to add additional commentary. This can be useful where researchers are used to transcribing using tables in word processing applications and want to replicate these formats within customised software. However, adding additional columns is a global process, i.e. it is done within the project properties and therefore affects all subsequently created transcripts. This limits the flexibility the researcher has to create differently formatted transcripts for different data types or analytic purposes within the same software project. [38]
We discuss these quite subtle limitations as exemplars only, as it is difficult to fully understand their implications without having used the software, but they are restrictive in comparison to other CAQDAS packages, and, in terms of fidelity, they are rather crude. The process of inserting time codes as enabled by packages such as Transana, ATLAS.ti and MAXqda can occur in tandem with transcript creation, or as a secondary step. This can offer more versatility as decisions concerning where to place time-codes can be delayed until data have been transcribed and initially considered. This approach, however, will be more time-consuming and can be practicably more difficult. [39]
Regardless of the procedures for inserting them, the position of time codes affects retrieval and is therefore practically and analytically significant. In most packages, although a portion of text within a time-stamped transcript segment can be coded, play-back based on code application is restricted to time-stamped segments. This is particularly, although not exclusively, relevant in Transana because it allows working with clips independently of their being coded as well as clip retrieval according to code application. This offers analytic flexibility but can be practically restrictive. For example, clip creation may be an initial descriptive task augmented by the placing of clips into collections for isolated played-back. Coding of clips may latterly be employed as a more thematic or conceptual task, potentially cutting across the more descriptive collections and acting as an additional analytic layer. Working in this way, however, can result in the initial creation of differently sized clips than the researcher subsequently wants to code. Additional time codes may then need to be created to further segment transcripts for code and retrieval purposes. This is possible, but can be practicably tricky and time-consuming. However, the ability to resize time-coded transcript segments is likely fundamental to analysis as units of analysis need to be refined and redefined as increasing insight is gained. [40]
5.2 Multiple transcripts for individual media files
Transana and DRS allow multiple written transcripts to be linked to and synchronised with the same audio/video file, allowing several perspectives on each video to be elucidated independently. This is useful in many circumstances, for example in collaborative projects when researchers from different disciplinary backgrounds develop separate transcriptions in isolation; when content and interaction carry equal weight in an analysis and there is a need to separate representations (SILVER & RIVERS, 2010); or when a log of the "objective" content and an interpretation of the "subjective" content needs to be isolated. Individual transcripts are created and stored separately but can also be viewed simultaneously (see WOODS & DEMPSTER, 2011, in this issue for more discussion on the use of multiple transcripts). Figure 5 illustrates the use of multiple transcripts in Transana.
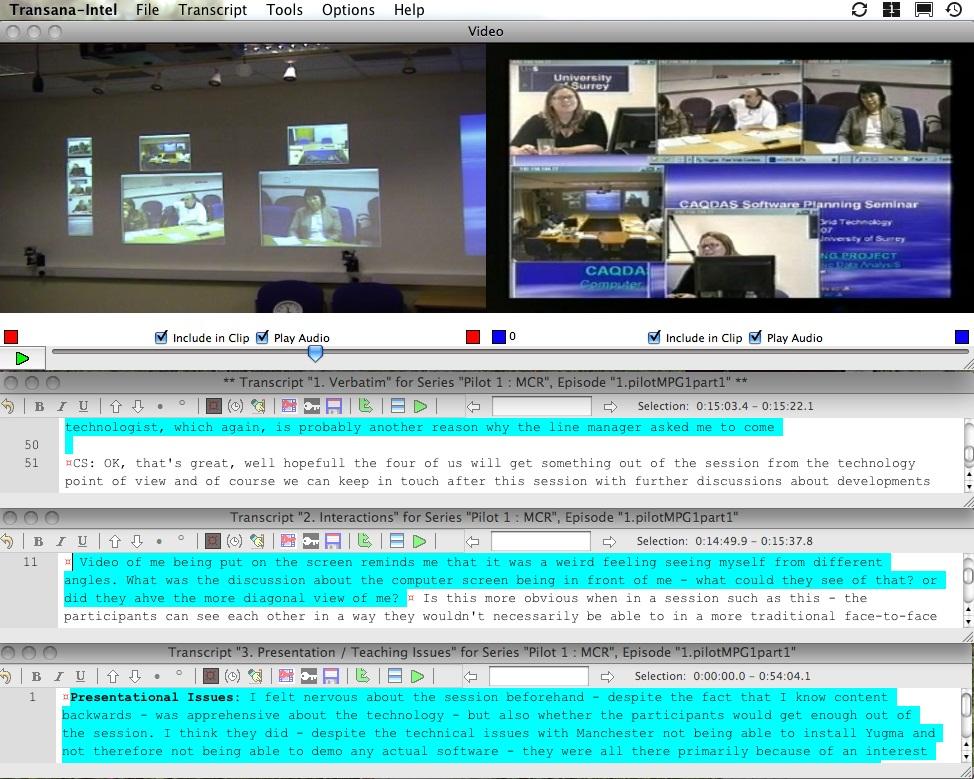
Figure 5: Multiple transcripts linked to synchronised videos, example in Transana. Please click here for an increased version of Figure 5. [41]
Although formatting devices can be used to differentiate analytic purposes within transcripts (RICH & PATASHNICK, 2002), this does not facilitate focusing on a particular representation independently from others. The provision of multiple transcriptions adds a dimension to analysing audiovisual data where written transcripts are seen as an analytic vehicle because perspectives can be isolated or viewed concurrently to allow for independent or integrated analysis as required. Such functionality offers a fine means of handling and analysing high fidelity audiovisual data. [42]
5.3 Synchronising multiple video streams and heterogeneous data
DRS and Transana enable the synchronisation of audiovisual files with one another, supporting the association and simultaneous viewing of more than one visual perspective and offering multi-modal representation and analysis. Shooting video of the same phenomena from more than one angle provides a more holistic representation, for example providing a general view of the setting as well as capturing detail by focusing additional cameras on individual aspects or actors (SILVER & RIVERS, 2010). Deciding on the number and position of additional cameras is a complex process informed by the theoretical and analytical context of individual research projects. However, the ability to temporally synchronise multiple video streams, and to develop as many separate transcripts as required, offers the researcher means of accessing and representing a range of perspectives. Indeed, a single view of a situation or event may not adequately reflect its complexity, especially where video is of prime importance. Individual perspectives held in separate transcripts can be isolated when there is a need to focus in detail or considered concurrently when the interplay between aspects is under scrutiny, thus matching more faithfully the fidelity of the data itself. [43]
DRS takes such technology further, enabling a range of different digital records to be synchronised. Not only can traditional qualitative research records such as interview or focus-group transcriptions, field notes, audiovisual files, and photographs be synchronised, but quantitative digital records such as systems logs containing metadata concerning those other records can be temporally matched (see Figure 6).
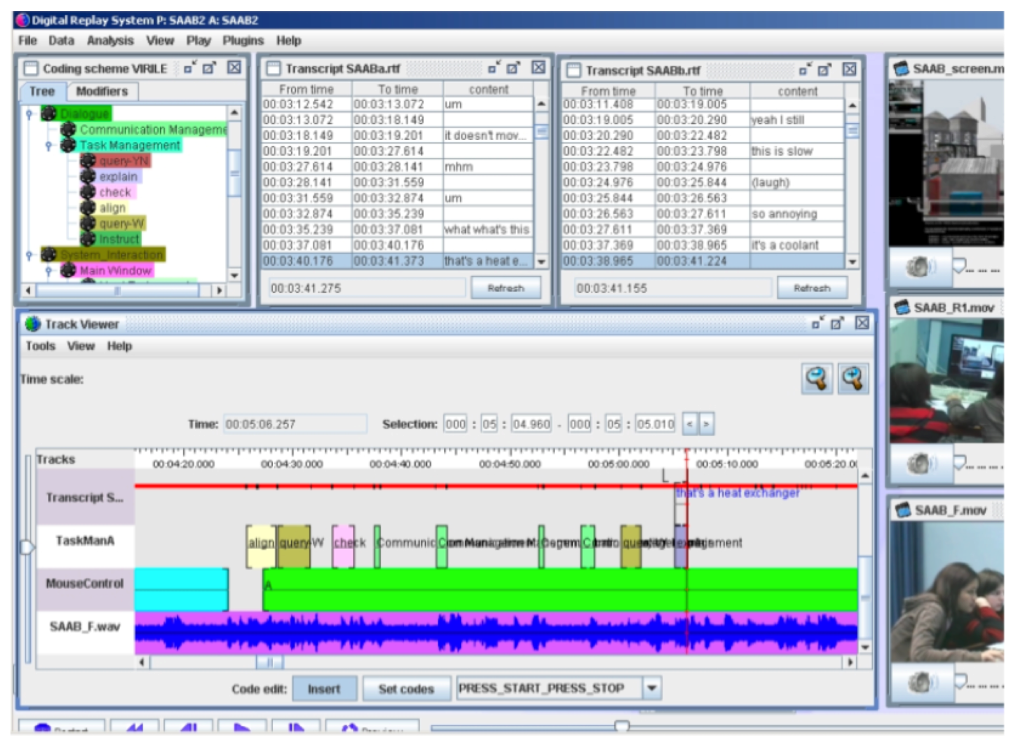
Figure 6: Synchronicity of multiple data records with time line, example in DRS. Please click here for an increased version of Figure 6. [44]
Once synchronised, these media can be viewed simultaneously alongside the corresponding time line, providing a visual representation of the temporal relationship between several media, integrated playback, and analysis. An example of the application of this technology comes from one of the driver projects informing the development of DRS. The Thrill project captured various forms of qualitative and quantitative data about rollercoaster rides, including video of participants and their heart rate whilst on the ride, and interviews with them concerning the experience subsequently (GREENHALGH, FRENCH, TENNANT, HUMBLE & CRABTREE, 2007). All this data could be synchronised along a time line and analysed concurrently. [45]
6. Managing, Sorting and Sequencing Data
For practical and analytic reasons, data management is an important initial consideration, whether working with large or small data corpora. This is particularly true when using CAQDAS packages, as the implications of how they handle audiovisual files can be significant. [46]
6.1 Storing and accessing data
Storing large quantities of audiovisual data for analysis may not be straightforward and the software used to facilitate analysis may affect how best to go about this in terms of where to store data and developing systematic file naming protocols. Most CAQDAS packages read audiovisual files rather than contain them, which carries implications for the treatment of those data for other purposes. Specifically, once analytic work has begun within CAQDAS packages, the original files should not be edited or moved. Copies of data files should therefore be used for analytic purposes, dramatically increasing the storage space required, but leaving the originals for other tasks. [47]
6.2 Grouping, displaying and sequencing still images
Grouping collections of data according to known characteristics and subsequently sorting on that basis is an organisational task that greatly facilitates analysis and comparison. CAQDAS packages are designed to incorporate factual characteristics (data attributes or socio-demographic variables, for example) that can be used to good effect for handling characteristics of audiovisual as well as textual data. These might include influences on the generation of data as well as the form, content and mode of audiovisual records. CAQDAS packages are advantageous in offering sophisticated query tools which retrieve data based on the occurrence of such characteristics (see LEWINS & SILVER, 2007 for more information on these and other CAQDAS tools). [48]
Grouping devices are particularly useful for managing audiovisual data within CAQDAS packages. Shortcut collections (typically termed "sets" or "families") in CAQDAS packages work for still images in similar ways to "albums" in photo storage/editing software such as Picasa or iPhoto. However, most CAQDAS packages only allow grouped images to be viewed as lists, whereas photo storage/editing software provide more flexible means of displaying and sequencing images. These include the ability for duplicated albums to present alternative sequences of images, to easily zoom in to portions of an image without losing picture quality, to add notes which are viewed adjacent to images, to view images in non-linear arrangements, and to re-sequence images within broader groupings. Such functionality aids direct comparison and means of representing processes, stories and connections. [49]
Of the CAQDAS packages discussed here, NVivo and ATLAS.ti provide the most visually flexible means of grouping whole images. NVivo allows them to be displayed as (small, medium or large) thumbnail images as well as in the default list view (see Figure 7). However, the three sizes are pre-determined and the software does not provide good zooming options, negatively affecting picture quality when focusing on a small area.

Figure 7: Thumbnail view of still images, example in NVivo. Please click here for an increased version of Figure 7. [50]
Most CAQDAS packages do allow the same image to belong to several sets, thus enabling the creation of groupings for a range of theoretical, analytic and practical purposes. The NVivo thumbnail view allows several images to be viewed simultaneously and is particularly useful when comparing "before" and "after" shots or wanting to visualise connections between images. However, the sequence in which images are presented in this view is automatically determined, alphabetically according to file name, and there are only limited ways to re-order images (e.g., by creation date, source folder, etc.). In addition, chosen settings revert to default when moving away from set folders and therefore need to be frequently reapplied. [51]
ATLAS.ti provides an alternative way of visualising whole images simultaneously, through its network tool (see Figure 8). This allows for more flexibility in terms of positioning the images than the NVivo thumbnail view in sets. Network view layouts can be saved and reopened without losing carefully considered positioning. Network views can also be outputted in different formats for display in different applications. As discussed in Section 9 below, ATLAS.ti network views have various additional advantages.
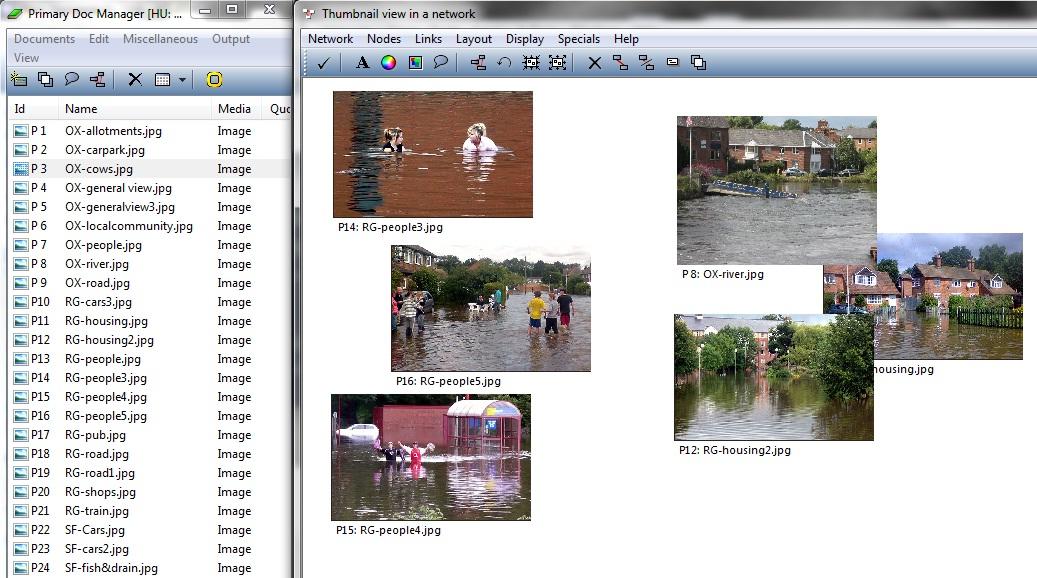
Figure 8: Grouping whole images visually, example in ATLAS.ti using network tool. Please click here for an increased version of Figure 8. [52]
However, image grouping tools in CAQDAS packages are generally crude and rudimentary in comparison to the fidelity of their equivalents in photo storage/editing software. The lack of adequate tools for representing sequence as a means of tracking non-linear associations is a particular disadvantage. Further development of CAQDAS tools for handling still images is therefore important in increasing their utility and uptake. [53]
7. Marking and Annotating Data
Marking and annotating data are iterative exploratory tasks that may occur throughout analysis. Distinguishing between textual and visual annotation techniques highlights subtly different analytic purposes and illustrates limitations in CAQDAS support in comparison to photo editing software in particular. [54]
7.1 Visually annotating still and moving images
Many CAQDAS packages allow multiple rectangular segments of still images to be selected and visually marked. Multiple selections, of any size and even overlapping, can be made. However, this is a crude and restrictive means of visually identifying analytically meaningful portions of still images, as it is not possible to precisely select the area of interest. The ability to create freeform selections, such as alternative shapes, or add lines and arrows, similar to those found in drawing or photo editing software, such as Paint or Photoshop, provide much finer means of precisely marking up a still image. Being able to assign user-defined colour to visual annotations and to alter the weight (thickness of lines, etc.) would add a further dimension. [55]
Figure 9 illustrates visual annotation of a still image using simple drawing/painting tools in a word processing application. Such visual annotations cannot be made in CAQDAS packages, although they could be saved as image files and imported into CAQDAS packages. However, to increase analytic flexibility, there is an additional need to hide and reveal distinct types of visual annotation through the use of layers. This would enable the original image to be reconsidered for alternative analytic purposes, for example to allow additional researchers to view images without their being obscured by others' annotations.
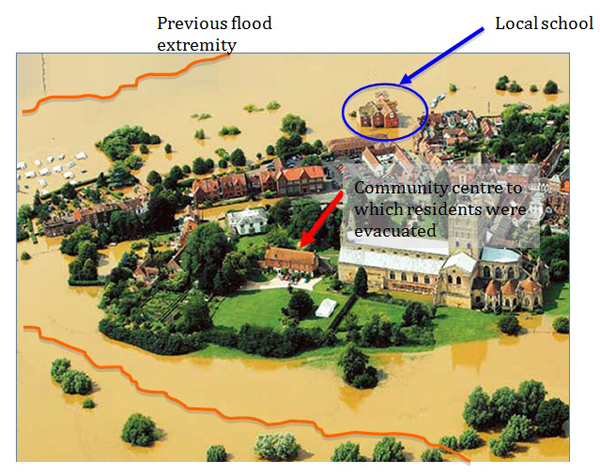
Figure 9: An example of freeform visual annotation [56]
The development of the software tool MiMeG4) explicitly addressed this issue by focusing on visual annotation of video data in collaborative research settings. Whilst MiMeG does not incorporate tools such as linking devices, code and retrieve facilities, and so on, visually annotating video data in a (perhaps geographically dispersed) team situation can act as a preliminary analytic task in developing aspects for subsequent analysis. [57]
7.2 Textually annotating still images
Textual annotation tools in CAQDAS packages are distinct from transcription tools as discussed above, although they may be used in similar ways. They are at the core of CAQDAS functionality and constitute a significant analytic advantage over their equivalent in photo/video editing software. [58]
Although portions of images can be visually marked and textually annotated using CAQDAS packages, retrieval is restricted to handling whole images. This constitutes a significant disadvantage for certain types of visual research, as discussed below in relation to representation and dissemination. Despite identified limitations with respect to annotating still images, however, textual annotation of the type described here cannot generally be achieved using photo editing software like Picasa, iPhoto, or Photoshop. Writing is an analytic act and a key part of the qualitative interpretive process; as such, textual annotation capabilities, along with associated memo tools, provided by CAQDAS packages are important analytic tools that are only partially replicated in other types of software. [59]
It may be analytically important to develop written descriptions/interpretations of images, to view these alongside, and/or to comment on the salience of visual annotations. This might include describing the scene in terms of what seems to be happening as well as interpreting the symbolic meanings of certain representations in the context of socio-cultural, historical or political frameworks, or recording ways in which audiences view images and the subsequent implication of (re)presenting them in certain ways. The creation and representation of these interpretations differ quite starkly between software, but this type of facility is of great interpretive value because it allows the researcher to unpack specific aspects in detail and subsequently retrieve them in context. Comparing ATLAS.ti, NVivo and MAXqda in this respect elucidates both differences and inadequacies of such features, illustrating that these tools do not afford sufficient fidelity for the analysis of still images. [60]
ATLAS.ti stores textual annotations separately from the image itself and so the user has to manipulate a separate window, the "quotation manager", in order to see both together (see Figure 10). Textual annotations are thus physically isolated from the images to which they correspond using this view. Although textual annotations can overlay the selected image quotation, as illustrated in Figure 10, they are near impossible to read. For analytic purposes these limitations may be insufficient. Instead, the network tool, which allows links between codes and quotations, for example, to be created and viewed, provides a visually more useful presentation. However, it remains difficult to see all textual annotations simultaneously and, in particular, to easily identify the exact data selections to which they are linked.
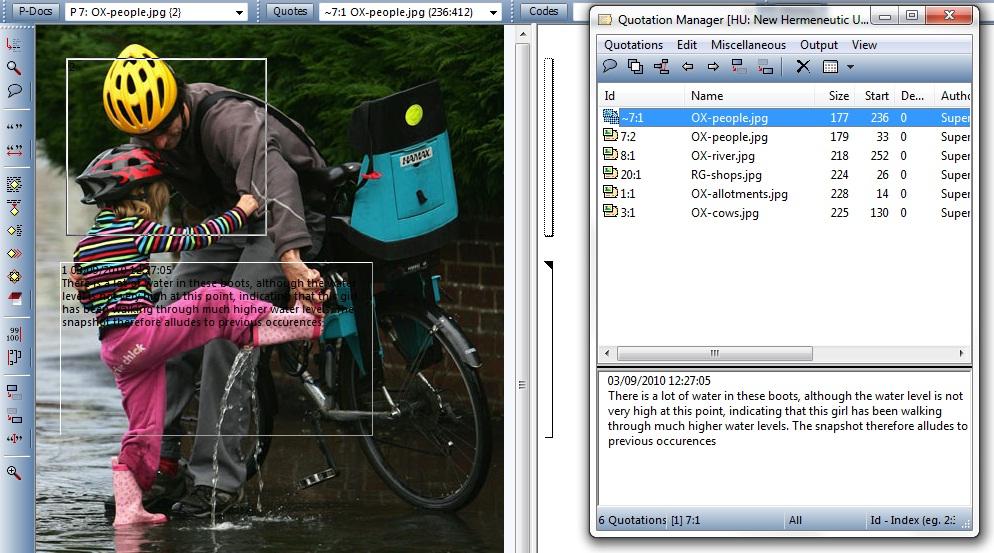
Figure 10: Textual annotations physically separated from data, example in ATLAS.ti. Please click here for an increased version of Figure 10. [61]
NVivo handles textual annotations rather differently, listing them in a tabular format adjacent to the image itself (see Figure 11). Initially this seems a useful presentation, as both can be easily seen simultaneously but there are still a number of limitations. For example, the order in which rows appear is determined according to graphical co-ordinates which makes it impossible for comments to be (re)sequenced interpretively. It is also only possible to identify which row of textual annotation belongs to which selection one at a time, as illustrated in Figure 11. When highlighted, the portion of the image to which the textual annotation corresponds is highlighted in pink, thereby obscuring the area of interest precisely when one wishes to focus upon it. In addition, there is no means to view whole images within NVivo's model tool as one can in ATLAS.ti.
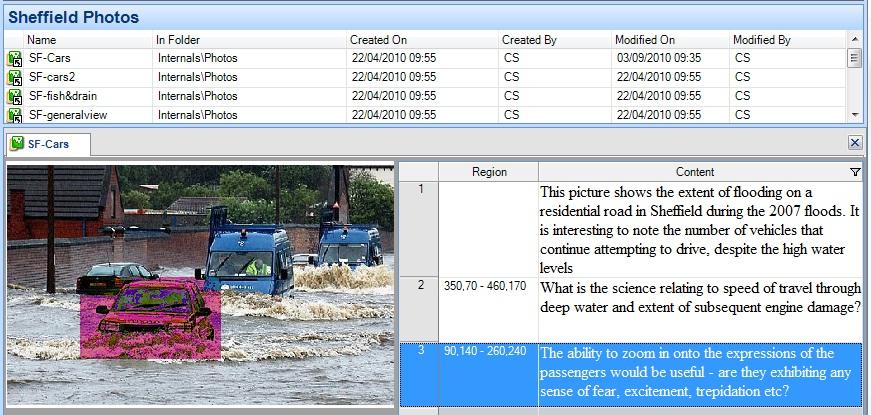
Figure 11: Textual annotations of still images, example in NVivo. Please click here for an increased version of Figure 11. [62]
MAXqda in contrast, enables memos to be associated with still images and comments (the terminology used for what we refer to as textual annotations) to be applied to individual code assignations. Memos can be created alongside images and are always visible when the image is displayed, but they cannot be directly linked with particular image selections. Even though a memo can be created at particular positions within images, that selection is not highlighted when the memo is subsequently re-opened. As illustrated in Figure 12, when associating several memos to one image this can become confusing as it is not visually obvious to which part of an image particular memos refer.
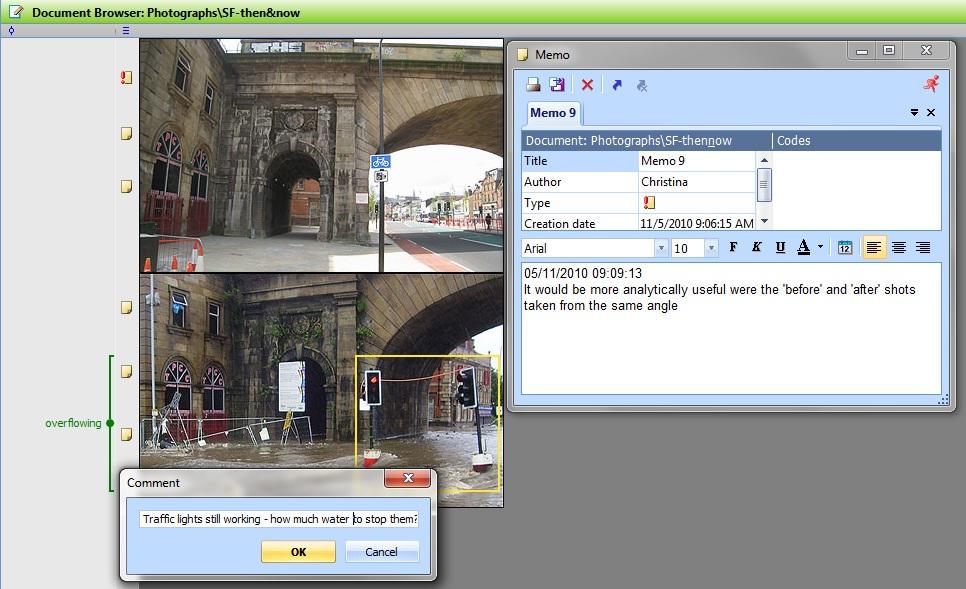
Figure 12: Textual annotations of still images; memos and comments, example in MAXqda. Please click here for an increased version of Figure 12. [63]
Memos are visualised and accessed in the same way regardless of where they were created; i.e. whether created from a specific image selection or associated with a whole image. Upon re-opening memos, therefore, the researcher has to ascertain to which part of the image the memo explicitly refers, which might not always be immediately obvious, especially in team situations. MAXqda does provide an additional way of textually annotating images, however, in the comment tool, which allows short comments to be linked to individual code assignations. A key difference in comparison to ATLAS.ti and NVivo is that in MAXqda image selections need to be first coded before they can be textually annotated. This offers less flexibility than the other two packages. [64]
The ways in which textual annotations can be retrieved is as important as how they can be created. ATLAS.ti, NVivo and MAXqda also store textual annotations associated with still images in very different ways. ATLAS.ti provides a central list of all textual annotations, regardless of data type; i.e. segments of textual and audio/video files that have been textually annotated are listed together. This is useful when there is a need to fully integrate analyses of several types of data. NVivo, in contrast, can centrally list textual annotations created within textual files, but it does not hold a central list of textual annotations created in other data types. Rather, NVivo treats textual annotations associated with still images in the same way as the transcriptions of audio/video data. A comparison of Figures 4 and 11 illustrates that still image annotations are displayed in the same way as audiovisual transcripts. As such they can be coded, whereas textual annotations of textual data cannot be coded. Hence there is an inconsistency in annotation functionality and different types of textual annotation are isolated from one another, making it more difficult to integrate analyses and make comparisons across media. The analytic functionality of these two quite distinct tools can thereby be obscured by the similarity in display. In MAXqda the centralised memo system lists all memos, regardless of whether they are associated with codes, documents or positions within data files. It is useful to have all types of memo accessible from a central list, and the ability in MAXqda to link codes to particular memos is unique and powerful for facilitating reflection and writing. The centralised list for comments which have been associated with individual code assignations is accessed from the code system. Figure 13 shows this centralised list, which is fully integrated with data and also lists other information relating to code assignations. Such tables can also be viewed for individual codes or groups of codes.
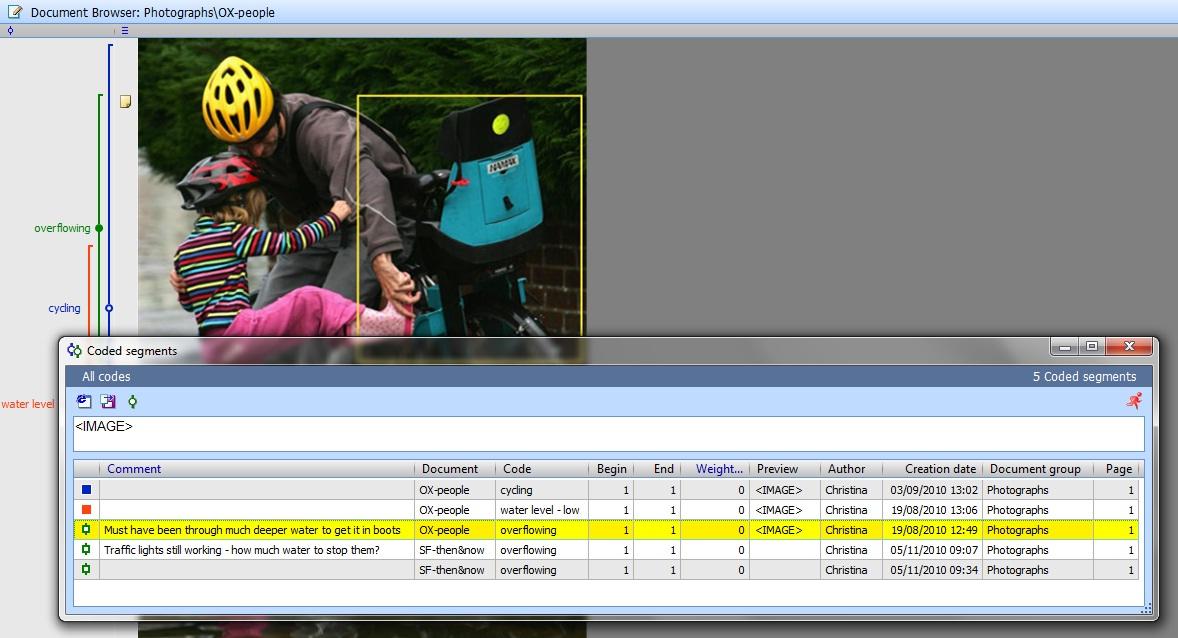
Figure 13: Centralised list of comments, example in MAXqda. Please click here for an increased version of Figure 13. [65]
Ideally, CAQDAS packages should enable the researcher to view textual annotations however the researcher chooses. Whether or not to integrate the analyses of different data types should be a conscious decision made by the researcher based on the design of the project, not due to constraints imposed by software. As such, these software tools are not fine enough, of sufficient fidelity, to support the analytic needs that still images demand. [66]
8. Organising Data through Code Application
Thematic or conceptual indexing of data through code application is core CAQDAS functionality. Even when analysis does not prioritise thematic work, coding tools are useful means of organising audiovisual data. The sophistication of code-and-retrieve tools constitutes a key advantage of CAQDAS packages over the tagging provided by photo/video storage/editing tools. Although some editing tools allow audiovisual data to be tagged, means of retrieving on that basis are rudimentary in comparison to CAQDAS packages. Coding tools are not discussed in detail here, as those for audiovisual data are essentially the same as for textual data, which have been extensively discussed and compared elsewhere (LEWINS & SILVER, 2007). However, an important distinction exists between CAQDAS packages that allow the direct application of codes to audiovisual records and those that necessitate some sort of written transcript for coding purposes. [67]
From a procedural point of view, visual and textual annotation is likely an initial task. It becomes necessary, however, to retrieve selected annotations in order to rethink them in the context of other data. This is where coding may play a role. Rather than viewing coding tools solely as means by which to catalogue or index data, they can be used for navigational purposes. Even where the approach is non-thematic, comparison is an analytic requirement. Coding tools in CAQDAS packages can be manipulated to enhance these processes. [68]
The ability of CAQDAS packages to code parts of image files and individual video clips is one way they surpass photo editing software in analytic value. Coding (and subsequent retrieval) allows video clips to be played-back and considered in isolation. Clips that share similar interactional properties, camera angles or representational forms as well as more thematic aspects can be grouped together for retrieval purposes. Disadvantages of coding tools for audiovisual data may relate to the ordering of retrieval, which will usually be provided in data order, rather than the researcher having the choice to alter play-back sequence according to a particular need. Transana and ATLAS.ti are notable exceptions: the former enabling sequence tracking through the use of clips and collections, the latter allowing the hyper-linking of quotations for similar purposes. Both thereby provide additional and finer ways of handling audiovisual data and visualising connections that are important for audiovisual analyses (see also Section 9 below). [69]
Some CAQDAS packages provide coding visualisations alongside audiovisual data, either adjacent to a still image or along the time-line of an audio/video file. This offers additional possibilities for analysing code-based sequences and in identifying time-based patterns. These views differ, with some packages providing a margin view vertically alongside the transcript (e.g. MAXqda see Figure 14) and others providing a similar view horizontally, either along a time line or audio waveform visualisation (e.g. Transana and DRS, see Figure 6).

Figure 14: Vertical code margin view, example in MAXqda. Please click here for an increased version of Figure 14. [70]
NVivo provides both a vertical and horizontal presentation upon which is indicated whether the code is applied directly to the audiovisual data, or via the written transcript. [71]
Code margin views also vary in their customisability and flexibility, with those offering the ability to assign user-defined colour to codes as they appear in the margin (see in relation to MAXqda in Figure 14) being significantly more analytically useful. MAXqda in addition offers alternative visual views of code applications such as a Code Line, Document Portrait and Document Comparison Chart which provide ways to visualise and compare code application across files. The Code Line and Document Portrait tools provide visual representations of individual data files and how they are coded throughout. In the Code Line tool, the user can choose whether to compare across the whole coding schema or to focus comparison around a group of codes. The Document Comparison Chart, particularly useful where transcripts are linked to audiovisual data files, compares selected data files according to how they have been coded throughout and is illustrated in Figure 15.
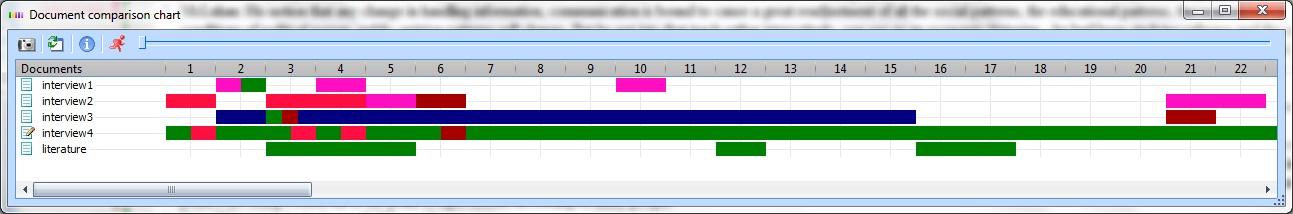
Figure 15: Document Comparison Chart in MAXqda. Please click here for an increased version of Figure 15. [72]
These tools rely on the application of consistent colour attributes applied to codes in order to be effective. This adds another level of complexity in code application, but reaps significant analytic rewards as colour-based patterns are powerful interpretive devices. However, they are only effective for textual documents as they use paragraph numbers as the means of tracking code application throughout the documents. If a way could be found to generate similar tools for audiovisual data this would be analytically very useful. [73]
9. Hyper-linking Tools for Tracking Associations and Processes
For certain methodological approaches, particularly narrative-based approaches, coding tools are not always appropriate devices for analysing audiovisual data. Although most CAQDAS packages are code-based, some offer alternative means of organising and analysing data which are particularly suited to audiovisual data analysis. These include hyper-linking quotations in ATLAS.ti and re-sequencing clips into collections in Transana, both of which can be used to track associations without conceptually fragmenting data. [74]
ATLAS.ti prioritises user-defined selections of data, called quotations, as independent objects which can be linked to other project items. As illustrated in Figure 16, quotations (data segments) can be hyper-linked directly to one another using user-defined relationships (e.g. associated with, causes, is part of, etc.) as well as or instead of being coded. This type of hyper-linking is equally well employed as a means of tracking sequence or indeed, non-sequential associations (SILVER & FIELDING, 2008). Hyper-linked quotations can be visualised in a network view (see Figure 16), as well as at the data level, where the paths through the data can be navigated without abstracting to the conceptual level. In Figure 16, the network view is shown alongside one of the images which contains a hyper-link. Audiovisual quotations are presented in textual format within the network view, but they can be directly accessed from the right click menu to be "displayed in context", as shown here. Quotations deriving from any data type can be hyper-linked in this way using ATLAS.ti, for example if an interviewee also spoke about a particular image, their comments could be created as quotations and hyper-linked to the corresponding image or audiovisual clip. Although linking devices are provided by some other CAQDAS packages, they are less powerful or well developed than the hyper-linking facility in ATLAS.ti.

Figure 16: Hyper-linking audiovisual data segments directly, example in ATLAS.ti. Please click here for an increased version of Figure 16. [75]
Transana also enables video data segments, called clips, to be handled independently of their being coded. Ordering clips into collections offers a means of both grouping and sequencing, and the ability to play clips in the particular order required. This offers the possibility to track sequence, but is less powerful than the ATLAS.ti approach, as the nature of the relationships between individual clips is not prioritised. [76]
10. Representing and Sharing Data
An important limitation of CAQDAS packages in relation to audiovisual data analysis relates to visualisation and output options. Transcribing, linking, marking, annotating, and coding audiovisual data are undoubtedly useful interpretive devices. However, in creating representations for the purposes of dissemination, whether taking the form of a research article, a photo essay, visual narrative, hypertext, or reportage, there is a need to transform analytic work from the software project into a more dynamic and accessible format. CAQDAS mapping, modelling or networking tools provide ways of visualising connections and can be manipulated to create non-linear representations for presentational purposes, but their potential as a substitute for a traditional written report are limited. In addition, CAQDAS package output options are rudimentary for audiovisual data, and generally limited to outputting the co-ordinates of coded image selections or the time periods of coded audio/video clips rather than generating new audiovisual records from coded selections to be used for dissemination purposes. [77]
Photo/video editing software packages, in contrast, provide more flexible means of representing and sharing audiovisual data. They usually offer several ways to create representations based on organisational devices such as the creation of albums or the application of tags. For example, webpages and DVDs can quickly be generated and commentary added to provide the interpretational context. In more artistic disciplines where written interpretation is of less importance, online services like Smilebox allow the sequencing of images with music in the form of scrapbooks, photo albums, collages, or slideshows. Such tools provide much more sophisticated and flexible means of representing a dynamic account of a visual analysis using still images than CAQDAS packages do. [78]
Few CAQDAS packages provide tools which can be manipulated to generate non-linear representations, although ATLAS.ti is the most effective in this regard due to its quotation hyper-linking functionality discussed above. Used in combination with integrated networking tools, it is possible to create simple hypertexts, affording the relationships between individual data segments primacy (Figure 16). ATLAS.ti can thereby be manipulated to support a non-linear or "free association" approach to data categorisation which is characterised by identifying, writing about and linking ideas to create multi-dimensional paths through data tracking narrative, sequence, time, and interaction (SILVER & FIELDING, 2008). Such presentations provide analytic affordances, because alternative visualisations allow researchers to think about data and their connections non-linearly. However, for presentational purposes there are a number of limitations to this approach, most notably a lack of flexibility in resizing and reformatting objects for increased visual impact. [79]
Output or reporting options are also relatively rudimentary with respect to audiovisual data in CAQDAS packages. Having annotated and/or coded parts of images or individual audiovisual clips it would be useful to display them in an output file. This is core functionality amongst CAQDAS packages for coded textual data, but most do not enable this for audiovisual data. Some provide partial solutions, such as NVivo's HTML format, in which the coded portion of the image is highlighted within the whole image, or the coded video clip can be played in isolation (see Figure 15). However, this format is unsatisfactory for purposes other than simple data sharing due to the extent of manipulation required to make use of the format for subsequent (re)presentations.
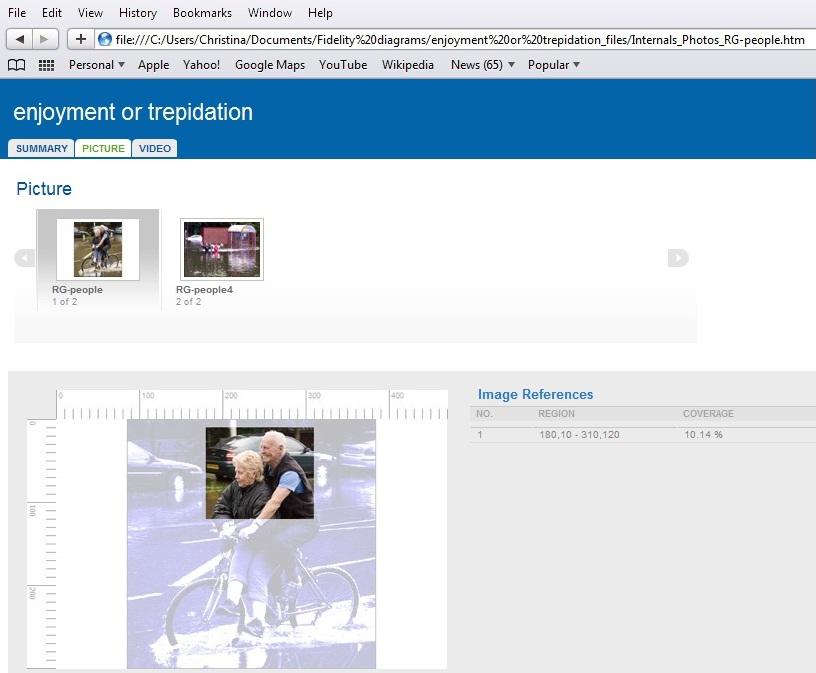
Figure 17: HTML output format for audiovisual data, example from NVivo. Please click here for an increased version of Figure 17. [80]
11. Discussion and Conclusion: Blunt Tools for Fine Purposes
CAQDAS packages undoubtedly support the analysis of audiovisual data in certain important respects well—in particular, where the analytic approach is code-based and where the analysis of audiovisual data needs to be synonymous to and integrated with the analysis of textual data. Packages that allow direct marking, annotating and coding of audiovisual data, as well as via a written transcript, offer more flexibility, providing options for both independent and concurrent analyses. However, functionality differences between packages, which are often quite subtle and specific, the implications of which are not always identifiable until analysis has progressed quite far, mean that researchers need to explore options carefully before choosing the most appropriate package. [81]
We have used the concept of fidelity to contribute to the critical evaluation of qualitative software tools for audiovisual analysis, illustrating there to be a mis-alignment between the increasing fidelity of audiovisual data and software tools for their analysis. The nature and status of audiovisual data is key in considering the value of software tools for analysis. For example, if video data are themselves of prime significance, the ability to create multiple transcripts and synchronise multiple streams is of increased importance because faithfulness to the complexity of the occurrence cannot be gained from just one perspective or camera angle. To reflect the multidimensionality of the event, several different representations of it may need to be collected and analysed concurrently. As such, the more complex the phenomena and data, the finer software tools are required. Dimensions of fineness include the ability and ease with which precise selections of data can be made, manipulated and retrieved; the ability to work with multiple transcripts representing the same audiovisual file; the ability to synchronise media in various ways; the ability to track non-thematic associations sequentially and the ability to generate flexible non-linear representations. Circularly, when more different representations of the same phenomena are available, lesser fidelity of each can be tolerated because multiple representations viewed together can be used to validate one another. [82]
Despite some very useful tools for handling and analysing data independently and concurrently, CAQDAS packages are lacking in three key respects:
analysing audiovisual data using non code-based approaches;
facilitating the representation of data in non-linear formats; and
creating new records on the basis of analytic work. [83]
In comparison to image/video storage/editing software, CAQDAS packages have a number of advantages, most notably with respect to analytic tools such as code-based retrieval options. However, there are several ways in which CAQDAS developers could usefully draw upon other tools in refining their products for audiovisual analysis. In particular are visual annotation tools, sorting, sequencing, and (re)presentational tools. Annotation tools are potentially key means by which to explore and interpret audiovisual data, yet, as they stand in CAQDAS packages, are blunt tools for fine purposes. In particular, there is a need for the development of visual annotation tools whereby freeform shapes can be used to mark up images, and which can be hidden or revealed using layer tools. [84]
Displaying data in various ways by sorting and sequencing are relatively basic organisational tools that act as heuristic devices. They are underdeveloped in CAQDAS packages, however, limiting the ability to analyse still and moving images according to user-defined sequence or other associations. Linking tools in most CAQDAS packages are also rudimentary in this respect. [85]
Another aspect of data display is how to represent phenomena and present findings for dissemination purposes. Whilst CAQDAS packages are developing more quantitative representations of qualitatively analysed data, they have not addressed the need for more dynamic output options. Where the purpose of visual research is to generate photo essay or digital narrative-type representations, the restrictive output options provided by CAQDAS packages may in themselves be prohibitive to their use. Related is the issue of generating new audiovisual records based on analyses. CAQDAS packages historically have not incorporated editing tools and there may be many methodological reasons why the editing of audiovisual data may not be appropriate, particularly where data are participant-generated, for example. However, where dynamic (re)presentations are required or participatory approaches are employed that value contributions of research participants to the generation and analysis of data, editing tools need to take more prominence. For several reasons, therefore, (re)presentational tools are key areas for future development that could contribute to the widening of uptake. [86]
There is a need for more explicit dialogue between researchers and software developers, whereby researchers provide explicit evaluations of software tools in terms of their practical, analytical and methodological utility. The relationship between technology and analysis is complex and somewhat elusive. In the commercial context, developers are bound to provide tools that their own market research indicates will contribute to an increase of sales and they therefore look to users for feedback. This, in part, explains the increasingly apparent convergence in CAQDAS tools in recent years. Yet developers are also in a powerful position to provide innovative tools that may stretch methodological and disciplinary boundaries and provide new ways of gaining analytic insight. At a time when technological changes are occurring increasingly quickly, when non-bespoke and open-source/freeware tools are increasingly being used for research purposes, and when lay-people are conducting pseudo-research using web 2.0 tools, this may prove to be a key way to gaining or maintaining market share. Somewhat circularly, whilst there are a number of limitations to CAQDAS packages, which may help explain the apparent lack of uptake and discussion concerning their use, there is also a need for researchers to formally evaluate and critique software tools, if only to improve what is made available for their use. [87]
There is also a need for more explicit dialogue between researchers about their analytic procedures for handling audiovisual data, with or without software support, both within specific fields and across disciplinary boundaries. Researchers from different disciplines and methodological traditions may have more in common than they realise and may benefit from sharing tools and procedures more formally. For example, WAGNER (2007) notes that documentary photographers (and, we would argue, visual researchers more generally) have a lot more in common with social researchers in terms of analytic practices than may at first seem apparent. Whilst the former pay particular attention to editing, layout, and representation and often present their work with limited interpretation, analytic themes are identified through the selection, sequencing, and spacing of images. As part of the process of uncovering the practicalities and procedures of analysing audiovisual data it is incumbent upon journal editors to request and expect that software use be documented in the methods section of any qualitative research report they are accepting for publication. This would contribute to a more formalised and transparent mode of software development and research practice. [88]
1) ELAN is an annotation tool for video and audio data to support the analysis of language, sign language and gesture (SLOETJES & WITTENBURG, 2008; CRASBORN & SLOETJES, 2008); INTERACT (developed by Mangold) adopts a mixed methods approach incorporating standard qualitative analysis tools such as coding, annotating, searching, etc. with some added capabilities based on coded records, such as video editing and statistical analyses (CANDY, BILDA, MAHER & GERO, 2004); and Observer (developed by Tracksys), is a system for the collection and analysis of behaviour via video. <back>
2) Note, however, that there is a workaround solution such that textual data such as interview transcripts can be handled independently of a related audiovisual data file. <back>
3) F4 is a versatile free transcription tool with a direct link with several CAQDAS packages, including ATLAS.ti, MAXqda and NVivo, for importation purposes <back>
4) Note that MiMeG is available for free download but is no longer developed or supported. <back>
Bell, Philip (2001). Content analysis of visual Images. In Theo van Leeuwen & Carey Jewitt (Eds.), Handbook of visual analysis (pp.10-34). London: Sage.
Brown, David (2002). Going digital and staying qualitative: Some alternative strategies for digitizing the qualitative research process. Forum Qualitative Sozialforschung / Forum: Qualitative Social Research, 3(2), Art. 12, http://nbn-resolving.de/urn:nbn:de:0114-fqs0202122 [Accessed: 7/24/2010].
Brundell, Patrick; Knight, Dawn; Tennent, Paul; Naeem, Asad; Adolphs, Svenja; Ainsworth, Shaaron; Carter, Ronald; Clarke, David; Crabtree, Andy; Greenhalgh, Chris; O'Malley, Claire; Pridmore, Tony & Rodden, Tom (2008). The experience of using the digital replay system for social science research. Proceedings of the 4th International e-Social Science Conference, June 18-20, U niversity of Manchester.
Candy, Linda; Bilda, Zafer; Maher, Mary Lou & Gero, John S. (2004). Evaluating software support for video data capture and analysis in collaborative design studies. Presented at QualIT conference, University of Sydney, Australia, http://web.arch.usyd.edu.au/~zbil4930/04_Candy%20etal_QualIT.pdf [Accessed: 1/20/2011].
Coffey, Amanda; Holbrook, Beverley & Atkinson, Paul (1996). Qualitative data analysis: technologies and representations. Sociological Research On-line, 1(1), http://www.socresonline.org.uk/1/1/4.html [Accessed: 7/24/2010].
Crasborn, Onno & Sloetjes, Han (2008). Enhanced ELAN functionality for sign language corpora. Department of Linguistics, Radboud University Nijmegen, The Netherlands, http://www.lat-mpi.eu/papers/2008/LREC%202008/LREC2008_CrasbornSloetjes.pdf [Accessed 11/14/2010].
Evers, Jeanine (2011). From the Past into the Future. How Technological Developments change our Ways of Data Collection, Transcription and Analysis. Forum Qualitative Sozialforschung / Forum: Qualitative Social Research, 12(1), Art. 17, http://nbn-resolving.de/urn:nbn:de:0114-fqs1101381 [Accessed: 1/24/2011].
Fielding, Nigel G. & Cisneros-Puebla, César A. (2009). CAQDAS-GIS convergence toward a new integrated mixed method research practice? Journal of Mixed Methods Research, 3(4), 349-370, http://eprints.ncrm.ac.uk/895/2/CAQDAS-GIS_convergence_JMMR_Oct09.pdf [Accessed: 1/23/2011].
Fielding, Nigel G. & Lee, Raymond M. (1998). Computer analysis and qualitative research. London: Sage.
Fielding, Nigel G & Lee, Raymond M. (2002). New patterns in the adoption and use of qualitative software. Field Methods, 14(2), 197-216.
Fraser, Mike; Hindmarsh, John; Best, Katie; Heath, Christian; Biegel, Greg; Greenhalgh, Chris & Reeves, Stuart (2006). Remote collaboration over video data: towards real-time e-social science. Computer Supported Cooperative Work, 15(4), 257‐279.
Grady, John (2008) Visual research at a crossroads. Forum Qualitative Sozialforschung / Forum: Qualitative Social Research, 9(3), Art. 38, http://nbn-resolving.de/urn:nbn:de:0114-fqs0803384 [Accessed: 9/7/2010].
Greenhalgh, Chris; French, Andy; Tennant, Paul; Humble, Jon & Crabtree, Andy (2007). From ReplayTool to Digital Replay System. Online Proceedings of the 3rd International Conference on e-Social Science, October 7-9, Ann Arbor, Michigan, ESRC/NSF, http://www.ncess.ac.uk/events/conference/2007/papers/paper161.pdf [Accessed: 24/6/2010].
Heath, Christian; Hindmarsh, Jon & Luff, Paul (2010). Video in qualitative research. London: Sage.
Hindmarsh, Jon (2008). Distributed video analysis in social research. In Nigel G. Fielding, Ray M. Lee & Grant Blank (Eds.), The SAGE handbook of online research methods (pp.343-361). London: Sage.
Holliday, Ruth (2007). Performances, confessions and identities: Using video diaries to research sexualities. In Gregory Stanczak (Ed.), Visual research methods: Image, society and representation (pp.255-279). London: Sage.
King, Andrew (2010). Membership matters: Applying Membership Categorisation Analysis (MCA) to qualitative data using Computer-Assisted Qualitative Data Analysis (CAQDAS) Software. International Journal of Social Research Methodology, 13(1), 1-16.
Konopásek, Zdeněk (2008). Making thinking visible with Atlas.ti: Computer assisted qualitative analysis as textual practices. Forum Qualitative Sozialforschung / Forum: Qualitative Social Research, 9(2), Art. 12, http://nbn-resolving.de/urn:nbn:de:0114-fqs0802124 [Accessed: 9/7/2010].
Lewins, Ann & Silver, Christina (2007). Using software in qualitative research: A step-by-step guide. London: Sage.
MacMillan, Katie (2005). More than just coding? Evaluating CAQDAS in a discourse analysis of news texts. Forum Qualitative Sozialforschung / Forum: Qualitative Social Research, 6(3), 25, http://nbn-resolving.de/urn:nbn:de:0114-fqs0503257 [Accessed: 9/7/2010].
Mason, Bruce & Dicks, Bella (2001). Going beyond the code: The production of hypermedia ethnography. Social Science Computer Review, 19(4), 445-457.
Mavrou, Katerina; Douglas, Graeme & Lewis, Ann (2007). The use of Transana as a video analysis tool in researching computer-based collaborative learning in inclusive classrooms in Cyprus. International Journal of Research & Method in Education, 30(2), 163-178.
Mondada, Lorenza (2009). Video recording practices and the reflexive constitution of the interactional order: Some systematic uses of the split-screen technique. Human Studies, 32(1), 67-99.
Pink, Sarah (2008) Mobilising visual ethnography: Making routes, making place and making images. Forum Qualitative Sozialforschung / Forum: Qualitative Social Research, 9(3), Art. 36, http://nbn-resolving.de/urn:nbn:de:0114-fqs0803362 [Accessed: 9/7/2010].
Rich, Michael & Patashnick, Jennifer (2002). Narrative research with audiovisual data: Video intervention/prevention assessment (VIA) and NVivo. International Journal of Social Research Methodology, 5(3), 245-226.
Schnettler, Bernt & Raab, Jürgen (2008). Interpretive visual analysis: Developments, state of the art and pending problems. Forum Qualitative Sozialforschung / Forum: Qualitative Social Research, 9(3), Art. 31, http://nbn-resolving.de/urn:nbn:de:0114-fqs0803314 [Accessed: 24/5/2010].
Secrist, Cory; Koeyer, Ilse de; Bell, Holly & Fogel, Alan (2002). Combining digital video technology and narrative methods for understanding infant development. Forum Qualitative Sozialforschung / Forum: Qualitative Social Research, 3(2), Art. 24, http://nbn-resolving.de/urn:nbn:de:0114-fqs0202245 [Accessed: 9/24/2010].
Silver, Christina & Fielding, Nigel G. (2008). Using computer packages in qualitative research. In Carla Willig & Wendy Stainton-Rogers (Eds.), The SAGE handbook of qualitative research in psychology (pp.334-351). London: Sage.
Silver, Christina & Lewins, Ann (2010). Computer assisted qualitative data analysis. In Penelope Peterson, Eva Baker & Barry McGaw (Eds.), International encyclopedia of education (Vol. 6, pp.326-334). Oxford: Elsevier.
Silver, Christina & Rivers, Christine (2010). Using access grid technology for the provision of software training. QUIC Briefing Paper, The CAQDAS Networking Project, University of Surrey, UK, http://caqdas.soc.surrey.ac.uk/PDF/QUICBriefingPaper-AG-mediatedtraining.pdf [Accessed: 1/28/2011].
Sloetjes, Han & Wittenburg, Peter (2008). Annotation by category – ELAN and ISO DCR. Proceedings of the Sixth International Language Resources and Evaluation (LREC'08), Marrakech, European Language Resources Association (ELRA), http://www.lrec-conf.org/proceedings/lrec2008/pdf/208_paper.pdf [Accessed: 1/28/2011].
Stanczak, Gregory (Ed.) (2007). Visual research methods: Image, society and representation. London: Sage.
Stigler, James; Gallimore, Ronald & Hiebert, James (2000). Using video surveys to compare classrooms and teaching across cultures: Examples and lessons from the TIMSS video studies, Educational Psychologist, 35(2), 87-100.
Wagner, John (2007). Observing culture and social life: Documentary photography, fieldwork, and social research. In Gregory Stanczak (Ed.), Visual research methods: Image, society and representation (pp.23-59). London: Sage.
Woods, David K. & Dempster, Paul G. (2011). Tales from the bleeding edge: The qualitative analysis of complex video data using Transana. Forum Qualitative Sozialforschung / Forum: Qualitative Social Research, 12(1), Art. 17, http://nbn-resolving.de/urn:nbn:de:0114-fqs1101172 [Accessed: 1/24/2011].
Christina SILVER is the manager of the CAQDAS Networking Project, for which she has worked since 1998. The project provides information, advice and training in a range of software packages designed to facilitate the analysis of qualitative data. She leads the training and capacity building activities of the project and is involved in research conducted under the National Centre for Research Methods (NCRM) funded project Qualitative Innovations in CAQDAS (QUIC). Christina’s particular interests relate to the relationship between technology and methodology and the integration and analysis of non textual data, using software. She is also the co-founder of Qualitative Data Analysis Services (QDAS), which provides customised training and consultancy services for individuals and groups engaged in qualitative analysis.
Contact:
Dr Christina Silver
Qualitative Innovations in CAQDAS
CAQDAS Networking Project, Manager
University of Surrey
Department of Sociology
GUILDFORD, GU2 7XH, UK
Tel: +44 (0)1483 689455
E-mail: c.silver@surrey.ac.uk
URL: http://caqdas.soc.surrey.ac.uk
Jennifer PATASHNICK served as Analysis Coordinator for Video Intervention/Prevention Assessment (VIA), an innovative project of the Center on Media and Child Health at Children’s Hospital Boston, from 2000-2009. While there, she was instrumental in the development of a methodology for the software-supported management and analysis of thousands of hours of visual narratives, video produced by chronically ill children and adolescents to teach their doctors about their lives with a chronic condition. Currently, she works with Qualitative Data Analysis Services (QDAS), providing her expertise with qualitative software and audiovisual data to researchers around the world.
Contact:
Jennifer Patashnick
Qualitative Data Analysis Services
7 Kirk Street
Wilmington
Massachusetts 01887-3208
USA
Tel: +1 (0)6178428890
E-mail: Jennifer.patashnick@qdaservices.com
URL: http://www.qdaservices.com/
Silver, Christina & Patashnick, Jennifer (2011). Finding Fidelity: Advancing Audiovisual Analysis Using Software [88 paragraphs]. Forum Qualitative Sozialforschung / Forum: Qualitative Social Research, 12(1), Art. 37, http://nbn-resolving.de/urn:nbn:de:0114-fqs1101372.

Creative Commons Attribution 4.0 International License