Volume 13, No. 2, Art. 13 – May 2012
Comparative Causal Mapping and CMAP3 Software in Qualitative Studies
Mauri Laukkanen
Abstract: Causal (aka cognitive) mapping emerged in the late 1970s as an innovative method for capturing and analyzing political decision-makers' and organizational phenomenological and causal belief patterns. Since then, in particular comparative causal mapping (CCM) has become widely used especially in management and organization (MOC) and IT-studies in the UK and USA. This paper provides an overview of the conceptual underpinnings and main variants of CCM to introduce the approach to qualitative researchers interested in new methods and research tools. Next, the paper presents new non-commercial Windows software, CMAP3, designed for small and medium size-N CCM-studies. Finally, to describe CCM-methods' versatility and potential, the paper discusses six types of CCM-studies, which represent different conceptions of target phenomena and research objectives and apply different modifications of the basic CCM-platform.
Key words: cognitive mapping; comparative causal mapping; low-structured causal mapping; semi-structured causal mapping; concept pool (hybrid) causal mapping; CMAP3 software
Table of Contents
1. Introduction
2. Causal Mapping Methods
3. CMAP3: Overview
3.1 CMAP3 in semi- and low-structured CCM
3.2 CMAP3 in structured CCM
3.3 Processing and analysis
3.4 Output and visual cause maps
3.5 Constraints
4. Discussion: Using Comparative Causal Mapping
1. Introduction1)
Causal2)mapping emerged in the 1970s as a new method for describing and analyzing political decision makers' beliefs, which underlie their planning and decision making (AXELROD, 1976). Roughly at the same time the method began to be applied in the new, fast growing field of MOC (managerial and organizational cognition; BOUGON, WEICK & BINKHORST, 1977; WALSH, 1995). Since then, the basic CM/CCM-platform has been transformed into different method approaches and adopted in many other fields, notably information technology (NARAYANAN, 2005). [1]
Conventionally, causal maps (CM) refer to graphic network representations (digraphs) such as the one in Figure 1. They consist of nodes and arrows. Cause map nodes depict concepts (entities, phenomena, their attributes) of the focal domain or issue, the arrows indicating the concepts' interlinked causal relationships, usually as perceived by the studied actors. In some cases causal maps contain additional notation typically to describe some attributes of the relationships such as the influence direction (+/-) or its subjective weight or importance. Visual causal maps are particularly useful in holistic description and analysis of the target phenomenon, e.g., in so-called counterfactual or "what-if" analysis. However, the information content of cause maps can also be presented in non-visual forms, such a data base (as in CMAP3) or a square (adjacency) matrix. One of the main benefits of these formats is to enable computerized processing of CCM-data and facilitating numerical analysis with cause map-based indicators.
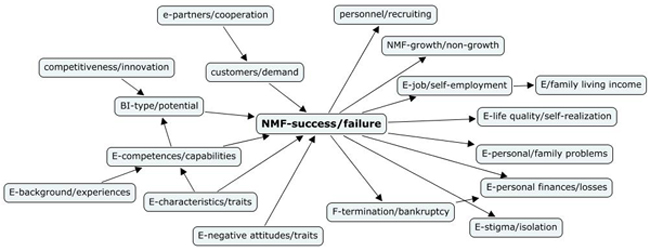
Figure 1: An example of an aggregated cause map: Finnish small business advisors' (SBA) typical thought patterns concerning nascent micro firms' (NMF) success and failure. [2]
To discuss the rationale and empirical methods of causal mapping it is useful to begin with the target phenomena, which typical CM/CCM-studies capture, describe, and analyze. In the majority of study cases, causal mapping is concerned with individual and social cognition, more specifically social actors' knowledge and beliefs, their formation, attributes and impacts in social contexts such as organizations or cultures. Traditional key constructs have been cognitive maps and mental models, which refer to an individual's internal knowledge structures (GENTNER, 2001; JOHNSON-LAIRD, 2001; MARKMAN & GENTNER, 2001). However, in cognitive psychology (and geography) today, cognitive map refers mainly to people's representations of their spatial environments. Thus, using the term mental model seems more appropriate. It was originated by the Scottish psychologist, CRAIK, in the early 1940s (cf. JOHNSON-LAIRD, 1983) to refer to the internal models that people create or adopt and retain for comprehending their environment's structure and functioning for predicting, influencing or adaptation. Notably, however, many other terms such as doctrine, dominant logic, ideology, industry recipe, or worldview have been proposed especially in the MOC-literature (WALSH, 1995). Typically, they refer to knowledge/belief patterns at organizational or larger social units' level. [3]
The following quote from JOHNSON-LAIRD, a leading UK cognitive psychologist, explains the general conceptual underpinnings in typical causal mapping studies:
"Understanding certainly depends on knowledge and belief. If you know what causes a phenomenon, what results from it, how to influence, control, initiate, or prevent it, how it relates to other states of affairs or how it resembles them, how to predict its onset and course, what its internal or underlying 'structure' is, then to some extent you understand it. The psychological core of understanding ... consists in your having a 'working model' of the phenomenon in your mind. If you understand inflation, a mathematical proof, the way a computer works, DNA or a divorce, then you have a mental representation that serves as a model of an entity in much the same way as, say, a clock functions as a model of the earth's rotation" (1983, p.2). [4]
In other words, the premise in applied cognitive research such as CM/CCM is that "cognition matters," more or less irrespective of the level of analysis or what the studied units of analysis are called. Underpinning this is the dominant view in modern cognitive psychology that symbolic representation of our external worlds, physical and social, is a major (but not only) precondition for understanding of that world and, consequently, for purposive action and adaptation. We need to adopt or create personal knowledge and beliefs and retain and use them. Sometimes they are used directly, repeatedly and routinely, sometimes as tentative scaffolding around which to build new interpretations, solutions, ad hoc mental models to enable situationally "updated" explanations and predictions (FREDERIKSEN, 2001). In this context, in particular causal knowledge (generally: that A and B exist, and that A influences B or B depends on A) about influential or manipulable phenomena and their impact mechanisms is essential for predicting and influencing purposes. This, in turn, is critical for adaptive behavior and action planning in everyday life and in professional contexts (BANDURA, 1986; PINKER, 2008). [5]
Arguing that cognition matters does not of course imply that all action is rational or deliberately planned or that, to be relevant for research, the studied actors' beliefs have to be accurate, i.e., isomorphic with some "reality" or "facts" (assuming such things defined). First, both accurate and inaccurate beliefs are important, when they influence and therefore explain action. Second, studies of human cognitive processes have found that considerable inaccuracy and fuzziness does characterize everyday problem-solving, explanations, predictions, and decisions about courses of action. Individuals' cognitive operations are commonly based on retained knowledge and beliefs, which are usually approximations and may even miss some currently relevant aspects of the issue or domain. Furthermore, people tend to use what they can easily recall and to simplify cognitive tasks by using learned routines and rules of thumb and by reverting to bias-prone methods of reasoning and problem-solving (BAZERMAN & MOORE, 2008). Notably, most of the time such devices and shortcuts work, at least by the actors' subjective criteria. However, when the conclusions or underlying beliefs are seriously mistaken, caused, e.g., by inferential or observation errors or reasoning biases, they can lead to suboptimal or harmful results, noticeable to all. [6]
Our tendencies to use retained knowledge/beliefs and to reduce our cognitive workload in different ways have understandable grounds. First, for an individual, creating one's cognitive basis of understanding and purposive action always from point zero would be extremely stressful and is thus impractical. Instead, we tend to avoid the cognitive stress of finding unique solutions and shun cognitive dissonance caused by acting against our earlier decisions. One of the consequences is a general reluctance to change our previous conceptions and ideas, especially the more basic ones such as political views or culturally learned beliefs, unless there is compelling new evidence, major rewards or social pressure. Moreover, there are strong economic and social factors favoring sticking to existing and established beliefs and knowledge. For example, it makes sense to adopt the same methods and solutions, including ideas, that others use instead of devising them ourselves. Furthermore, most of us avoid problems such as conflicts or loss of acceptance and stature in our social groups. As a rule, we do not like to deviate far from authoritative, socially sanctioned, established beliefs and behaviors. [7]
For the above reasons, social actors' knowledge and beliefs are, as a general tendency, relatively stable. Assuming no unusual learning incidents, they evolve mainly by autonomous, tacit, and gradual accumulation of new information and ideas and simultaneous attrition (unlearning) of previous ones mainly through not using them. These tendencies are supported by the fact that the learning of personal knowledge and beliefs is today much less than previously an individual, experiential process. Acquiring what we know and think is largely a vicarious, socially transmitted process, which is initiated and carried out by different social mechanisms and forums. These include early socialization, systems of education and training, professional media, organizational systems, inter- and intranets, social networks, etc. (BANDURA, 1986). Today, it is in particular organizations that dominate in developed societies. They are not only places and devices for doing things repeatedly and efficiently, but also main social arenas for creating and disseminating new knowledge, even enforcing ideas, usually to enable collective adaptation to new contingencies. As a byproduct, the membership in and the ability to identify with an organization and/or a community of practice (WENGER & SNYDER, 2000) is very important to most people. It means, among other things, opportunities but also considerable pressures in terms of conforming to the respective beliefs, values and culture. This manifests in adopting the related discourse, jargon, concepts, causal thought patterns typical of such units (WENGER & SNYDER, 2000). [8]
If causal knowledge and beliefs, in short mental models, are influential in terms of explaining and predicting individual and social action, and, moreover, relatively stable, they are, by implication, also relevant as research targets. The methodological problem is how can they be known, described and analyzed. [9]
For the sake of discussion, let us assume a continuum of methods for this task. At its "everyday" end, people in daily contexts habitually use methods such as spoken language or written texts to communicate about their or others' knowledge and beliefs, causal or otherwise. At the other, formal end of cognitive science such as cognitive psychology or artificial intelligence (AI), the same task is usually known as the problem of (external) representation. Different elicitation methods and representation formalisms have been developed for it (EVANS, 1988; GENTNER, 2001; ROUSE & MORRIS, 1986). However, cognitive science is mainly concerned with general cognitive abilities and processes, typical of normal individuals. It is therefore less interested in what a given person or group believes about some issue, i.e., in the specific knowledge contents of actors (like managers) or collectivities (such as a professional or organizational group). Likewise problems such as the formation or behavior implications of some particular belief systems are typical of social and organizational cognitive research, not of cognitive science. [10]
In the continuum from everyday devices to AI-formalisms, causal maps and mapping can be considered an intermediate representation and operationalization method. Its focus is a specific aspect of cognitions: a person's or a collectivity's knowledge and beliefs about what phenomena or entities exist in the domain and what are their mutual causal relationships. In essence, thus, causal knowledge is about how some actors perceive a domain's or issue's structure and internal causal influence mechanisms. Precisely these are cognitive contents, which can be plausibly captured, represented and analyzed by causal maps' nodes and arrows. Moreover, compared to verbal or textual description or AI-formalisms, causal mapping has some important unique advantages. For example, visual cause maps support a holistic Verstehen of actors' belief patterns and their implications by mentally simulating the contents "in the mind's eye." Comparative causal mapping (CCM) goes still further. It enables aggregating several actors' thought patterns to locate typical beliefs, tracking the changes of a person's or a collectivity's thinking, or calculating numerical indicators for summarizing or comparative analysis, etc.. In this way, CCM-methods are able to provide new ways and perspectives for studying actors' thought patterns and the backgrounds of social action. [11]
The paper is structured as follows. Section 2 is an overview of current causal mapping methods. Section 3 presents a CCM-software application, CMAP3, and discusses its main functions in both semi/low-structured and structured CCM-approaches. Section 4 focuses on uses of CCM-methodologies in research. It describes six general types of CCM-studies, which represent different target phenomena, research interests, and methodological approaches, demonstrating the versatility and potential of CCM-methodology. [12]
Generally, there are two main types of causal mapping, idiographic and comparative. Idiographic causal mapping—which will not be considered in this paper—collects and describes the causal ideas of a single person or collectivity, such as a CEO or a group of managers, and presents them using a single composite cause map (COSSETTE, 2002; EDEN & ACKERMANN, 1998). This resembles techniques like concept (idea/mind) mapping, typically used for pragmatic and/or personal heuristic purposes. [13]
Comparative cause mapping (CCM) extends the general causal map platform to research tasks, which require eliciting several individuals' causal ideas and the comparison and aggregation of their causal beliefs/knowledge patterns. For example, this author has used CCM to explore long-term changes in the thought patterns of a CEO (LAUKKANEN, 2001), to model municipality directors' thinking about local economies (LAUKKANEN & NIITTYKANGAS, 2003); and recently, to analyze small business advisors' causal ideas about nascent micro firms' performance (Figure 1) (LAUKKANEN & NIITTYKANGAS, 2010). A number of further CCM-research cases and types will be discussed below in Section 4. [14]
When studying any cognition-related construct such as attitudes, values, or mental models, the self-evident problem is that the such a construct or the contents of a person's cognitions like causal knowledge/beliefs, cannot be observed nor elicited directly and independent of that person. Therefore, for example in AI, data of domain experts' knowledge and problem-solving processes is elicited by think-aloud methods and later combined and represented in software code in an Expert System application. Correspondingly, cause maps (or equivalent tables or matrices) do not exist as distinct entities and cannot be acquired as such. In all cases, they must be constructed (by researcher and/or appropriate software) of respondents' causal statements (A → B, B → C), which are either embedded and located in their communications such as interviews / transcripts, specifically administered texts/essays or questionnaires, or acquired by some structured method from the respondents as discussed below. The option of using existing (secondary) documents data is conceivable but highly problematic in practice. First, there are usually problems of valid comparability, and second, because useful documents, which adequately represent actors' causal ideas (such as verbatim meeting minutes used in earlier CCM-studies, cf. AXELROD, 1976), are increasingly rare in today's organizations. [15]
In general, all CCM-methods must solve three interrelated main tasks: 1. Eliciting substantively valid and relevant causal data that also enable valid comparison of respondents' expressed beliefs; 2. Comparison of respondents' expressed causal ideas, embedded in the data, to determine their similarity or dissimilarity (this is necessary also for aggregating [intersecting] individual data to locate shared or typical thought patterns, CARLEY, 1997); 3. Converting the raw data into analyzable causal map data and appropriate presentation forms, which usually includes creating visual cause maps and calculating numerical indicators. The ways how the three tasks are solved define the main CCM-approaches and, consequently, what supporting computer applications should do:
Semi- and low-structured CCM-methods (LAUKKANEN, 1994, 1998; NICOLINI, 1999) elicit original data by interviewing, sometimes by administering systematic text-writing tasks leading to so-called text-based causal maps (TBCM, cf. NADKARNI & NARAYANAN, 2005). These methods produce rich and voluminous data, which may contain different expressions, often synonyms, homonyms and fuzzy statements, and often also data which is redundant for the immediate task. The key difference between semi- and low-structured methods is that semi-structured interviewing elicits predominantly only causal statements. This reduces significantly the amount of redundant data/text, which means less processing, less input and interpretation errors, and more consistency.
An integral element of semi- or low-structured methods is inductive, interpretive coding, which is more or less based on researcher (coder) knowledge and judgment. Coding decides what is relevant data and analyzes the respondents' expressions in terms of their meaning or referents to determine their mutual similarity/dissimilarity. In practice, coding requires a coding scheme (called standard vocabulary in CMAP3) to be developed and imposed either a priori or created (and imposed) inductively, often combined with data entry. The corollary of judgment-dependent coding is issues of trustworthiness (validity, reliability). They require appropriate validation strategies, such as transparent coding, feedback from respondents, or using parallel coders (see below).
Structured CCM-methods such as the so-called concept pool (aka hybrid) approach are based on a different, psychometrically oriented strategy (MARKÓCZY & GOLDBERG, 1995; CLARKSON & HODGKINSON, 2005). First, the researcher devises, ideally based on fieldwork and testing, a concept list ("pool," typical size = 45 to 55 concepts). Thus, a common concept system and meaning space will be predefined. Second, the respondents are instructed to pick, from the shared pool, their personal subsets of concepts, perceived subjectively most important or relevant. Third, by using the subset concepts' paired comparison or joining them on paper by free-hand drawing (HODGKINSON, MAULE & BROWN, 2004), the respondents' perceived causal links will be elicited, too. The concept subset sizes are limited, typically n = 10-12. This is because the number of paired comparisons and potential links (N = n*(n-1)) easily grows too high for reliable acquisition, especially when the links must also be specified (please see below).
The benefits of the concept pool method include, first, that instead of rich natural data (which some find annoying), there will be "tidy" structured data and much less of it. Second, the common pool eliminates the need for judgmental coding, because all participants must choose their concept sets from the common list. The benefit is an easier administration, and, at least in principle, larger sample sizes typical of quantitative, nomothetic studies. However, there is a significant downside: first, the need to prepare and validate the concept pool and, second, even if carefully done, potential doubts of validity (e.g., are the a priori pool's concepts representative of or even relevant to the respondents?). An inherent problem is that the elicited and resulting cause maps must be very small because of maximum concept number limitations. In semi- and low-structured CCM these are not critical issues, because they use natural, original data. [16]
It can be seen that CCM-research too has its own trade-offs and methodology issues. They have clear parallels with the well-known debate about the relative merits of quantitative and qualitative methods (GEPHART, 2004). [17]
Giving general recommendations for choosing between different CCM-approaches is not feasible or really helpful. In addition to researchers' personal methodological preferences, which must be respected, method decisions are ideally guided by the type and objectives of each research project. However, some thoughts can be suggested considering the key characteristics of main CCM-approaches. On the one hand, semi- and low-structured CCM-methods are more suitable (often obligatory) for novel research contexts and problems, typical of qualitative explorative and/or evocative studies (EISENHARDT & GRAEBNER, 2007). An example would be the above mentioned study (Figure 1) of SBAs' thought patterns. On the other hand, structured CCM-methods, being administratively easier and enabling large-N-studies, can be appropriate assuming an established and very focused (narrow) cognitive topic/issue and a concise actor group. Such targets could perhaps be, e.g., distinct "schools" of thought such as so-called policy regimes or professional "camps" of conflicting beliefs, and where the research concerns mainly such belief patterns' prevalence or distribution. It must also be possible to capture the key ideas plausibly with a small set of concepts, perhaps 10 to 20. In such cases, even small cause maps of few nodes/concepts may be able to cover the relevant phenomena and causal linkages and/or, thus, enable differentiating and categorizing the respondents in relevant cognitive terms, whereas using structured CCM-methods would be problematic in cases where the concepts-in-use are not well-known in advance or could not be found out without actually almost doing the study. [18]
To complicate things, different CCM-approaches are not necessarily interchangeable. Their elicitation methods have different demand characteristics by launching or tapping different cognitive contents and processes in the respondents. For structured (hybrid) eliciting of causal links data, a recent study (HODGKINSON et al., 2004) found that paired comparison of concepts elicited roughly five (!) times more causal links than when the same respondents linked their concept sets using freehand drawing. This leads to much denser, less plausible cause maps, making a numerical analysis problematic, too. An ongoing study of the present author supports this, showing that: 1. The paired technique elicits more reciprocal links (i.e., A → B, and B → A), many of which are spurious, possibly caused by vague causal ideas or simply unthinking responses. Whatever the explanation, this explains much of the higher number of paired comparison-elicited links. 2. Freehand drawing and semi-structured interviewing elicit roughly the same relative number and thus similar density of causal links. 3. Semi-structured interviewing elicits more and different active concepts than the concept pool method, thus revealing and covering the studied domain or issue in more detail. Obviously, differences like these are not insignificant. They underline the need to think carefully about methods, instructions, and controls in view of the research questions. As in most social research, a reasonable compromise can be found, balancing ideal research needs and what is realistically feasible in each case.
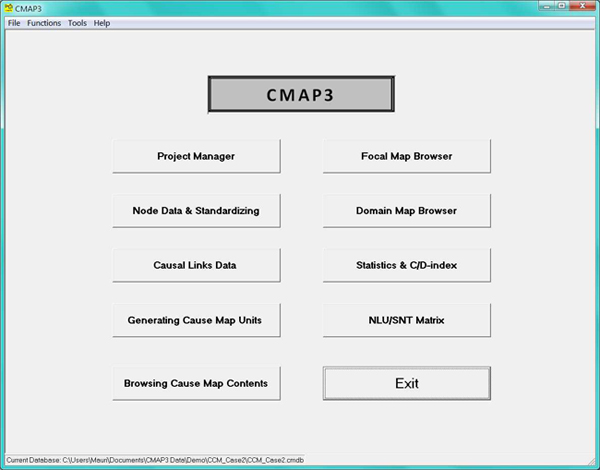
Figure 2: CMAP3 interface module [19]
Small-scale idiographic causal or concept mapping can do with hand drawing or using standard drawing or concept mapping software. However, in CCM-studies computerized methods are usually indispensable. The researcher must acquire, process, and analyze large volumes of rich raw data or, respectively, handle narrow data but from a larger number of respondents as in structured CCM. In low- and semi-structured CCM specifically, the computer application must enable an efficient, controlled entry of rich natural data, support iterative inductive coding of the original expressions, and facilitate speedy processing of causal map output data. In structured CCM, using the hybrid or concept pool method, whilst there is no need of interpretive coding, efficient entry and processing of raw data from a larger sample are critical requirements. In both approaches, software must support selective analysis of output cause maps, using quantitative measures and indicators, and enable cause maps' visual representation and analysis. [20]
Qualitative researchers have increasingly adopted computer assisted qualitative data analysis software, so-called CAQDAS-applications such as Atlas.ti, MAXqda or NVivo (cf. LEVINS & SILVER, 2007; EVERS, MRUCK, SILVER & PEETERS, 2011). They have been designed especially for efficient and controlled handling of transcribed rich texts like narratives or pictorial data and for such data's interpretive coding and/or thematic analysis. In CCM-studies, however, standard CAQDAS-tools' applicability is limited. Based on keyboard entry of data like transcripts, they could enable pinpointing and coding causal statements in the texts and sorting them. Some support limited visual presentation. However, for the key CCM-tasks of comparison of respondents, aggregating for typical patterns, calculation of indicators or presenting and analyzing results in cause map-relevant formats, all-purpose CAQDAS- applications seem less suitable. [21]
At the moment, there are only two widely available CCM-specific software applications: Cognizer™, which is a commercial application designed for structured (hybrid) CCM (for a detailed discussion please see CLARKSON & HODGKINSON, 2005), and CMAP3 for Windows, which is an academic, non-commercial and freely downloadable application (please see Footnote 7). Notably, it can be used both in semi- and low-structured CCM and in structured CCM in small- and medium N-studies (N =< 50). CMAP3 consists of integrated modules (Figure 2) for data input, coding, data processing, and analysis tasks. It supports the basic CCM-tasks of eliciting and entering causal raw data, coding/standardizing to determine the embedded meanings' or referents' similarity or dissimilarity, and subsequent cause map-based analysis. The techniques of data entry and coding vary by the CCM-approach and are described in the manual (LAUKKANEN, 2008) and its current update, both downloadable without cost (please see Footnote 7). The following presents an overview of CMAP3's main functions and uses. [22]
3.1 CMAP3 in semi- and low-structured CCM
Interview or text-based methods of data acquisition produces rich natural data consisting of respondents' causal statements and expressions in their own language. The original concepts (called in CMAP3 natural language units, NLUs3)) refer to the entities and their attributes in the domain, as perceived and expressed by the respondents. The original causal statements (natural causal units, NCUs) correspond to the concepts' influence relations, as believed to exist by the respondents. In addition, depending on the elicitation method, there can be data which specify (see below) the causal links and, especially in low-structured interview transcripts, data that is more or less unessential and redundant in research terms. [23]
As explained in the CMAP3 documents (LAUKKANEN, 2008), in semi-structured interviewing the raw data exists usually first in the form of interviewer notes, which usefully mimic causal maps, ideally backed up by voice recordings. For CMAP3 entry, it is recommended to transcribe this data into simple raw data sheets (RDS). These contain columns and rows for the elicited original concepts and causal links, eventually with link specification, and in many cases, also the original concepts' tentative or even final codes. Using RDSs facilitates fast keyboard entry and minimizes errors, because only original concepts and causal links data need to be entered, not the whole interview transcript as is typical using CAQDAS-software. Although seemingly mundane, devising appropriate techniques is important especially when handling large data volumes. They make keyboard entry faster and more reliable, and create a transparent audit trail from the output back to the raw data level, useful, e.g., when examining and validating coding. [24]
In low-structured methods the data is usually first in the form of verbatim interview transcripts or, as in theTBCM-method, essays/texts written by the respondents. It is recommended to mark the relevant concepts and causal statements in such texts, and then to enter them manually into RDSs for keyboard entry. This reduces the amount of paper and facilitates the entry methods and other side benefits, mentioned above. [25]
As has been noted, the comparison and aggregation tasks in CCM require that the raw data is coded to determine the expressions' underlying meanings or referents and thus their mutual similarity/dissimilarity. This is called standardizing in CMAP3. In essence, it assigns the elicited expressions (words or word groups) into standard categories, which contain those natural concepts that are interpreted as having an identical meaning or the same referent. The categories are usually given a descriptive label, standard term, which can be a typical or central expression in the data or a meaningful synthetic short-hand term. [26]
Technically, the coding scheme, called standard term vocabulary (STV) in CMAP3, will be constructed and entered for each CMAP-project. The idea is that the STV consists of standard node terms (SNT), which will replace the original concepts (NLUs) and appear as the output cause maps' concepts (nodes). Each SNT has a tag or code (STAG), which will be input with the respective NLU to link it to the appropriate standard term and assign it to the correct STV-group, when the raw data is processed further (see below). The STV in CMAP3 can accommodate two parallel languages of SNTs, one usually for the respondents' language (e.g., Finnish), the other for reporting (e.g., English), depending on research needs. The STV has its own database and can contain an unlimited number of terms of different levels of generality, including provisory or tentative terms, also those not actively used in the project. [27]
In principle, coding/standardizing using CMAP3 is similar to what is generally done in qualitative or content analysis of documents or transcripts (WRIGHTSON, 1976; KRIPPENDORFF, 2004; MERRIAM, 2009). Depending on the study's method approach, the standard term vocabulary is constructed either a priori and before any NLUs are entered, or inductively simultaneously with NLU entry or only after all raw data has been entered. A priori standard term vocabularies would occur mainly in two cases. One, they correspond to the concept pool of structured CCM (see below). Two, they are used to represent some formal template concept system against which the respondents' beliefs patterns are compared, as discussed in Section 4. In contrast, in low- and semi-structured CCM, the standard term vocabularies must be created inductively and iteratively and gradually, starting from a set of a priori tentative categories. This is probably also the most typical case. [28]
When processing what is often voluminous data elicited by interview or text-based CCM-methods, it is, as noted, usually most practical to begin the STV-creation and NLU-coding with tentative concept groups, larger "baskets" of concepts, which have the same broad meaning or referent. Following the normal STV-creation procedures, such provisional groups are given names (SNT) and codes (STAG) and entered to the project's STV. The respective STAGs are then input simultaneously with the respective NLUs. The main benefit of such a "provisory" technique is that when all NLUs have been entered (equipped with tentative STAG-codes), it will be much easier and more transparent to examine the tentative NLU-groups' contents and create/enter new, more final standard terms into the STV and re-code the respective NLUs using them as necessary. [29]
For the above NLU-entry and standardizing tasks, CMAP3 has a special Node Data & Standardizing-module (Figure 3). In semi- and low-structured case it is used for keyboard entry of the NLUs (residing on the RDSs), and of the standard term vocabulary (STV). The technical coding operation, i.e., entry of the individual standardizing decisions, is done simply by linking (by mouse clicking) the input NLU with the appropriate standard term in the display. This will enter the respective STAG into to the NLU-database as shown in Figure 3. [30]
In CMAP3, the results and overall quality of coding/standardization can be examined first using the NLU-module by simply sorting the NLUs by their STAGs (or Excel-exporting of the NLU- base and then sorting and printing, see below). This will display the active SNTs' NLU-contents and helps assess the consistency of individual NLU-coding decisions. In addition, there is a special module, NLU/SNT-matrix, which displays the incidence (by respondent) of all active SNTs, showing which respondents used each SNT and how often, i.e., which respondent had respectively coded NLUs in the raw data. Both approaches are useful for assessing and developing the project's STV and/or individual coding decisions. [31]
Generally, in terms of final output and findings, standardizing/coding is an important, sometimes even critical operation. In studies where the coding scheme (STV) is identical or at least close to the original level of the respondents' expressions, coding is usually an unproblematic task of mainly compacting and editing. However, in some studies coding implies mapping the natural language expressions from the original level into a higher and sometimes very different one; e.g., from the original (emic) natural expressions to a system of general, theoretical (etic) concepts. This unavoidably raises issues of trustworthiness of the adopted coding scheme (STV) and of individual standardizing decisions. There are different strategies for assessing and ensuring the trustworthiness, in practice focusing on the semantic and face validity and internal consistency (reliability) of the realized coding. Some validation methods are considered in the CMAP3 documents. More detailed discussions about validity and reliability assessment can be found in qualitative methodology and content analysis sources (KRIPPENDORFF, 2004; MERRIAM, 2009).
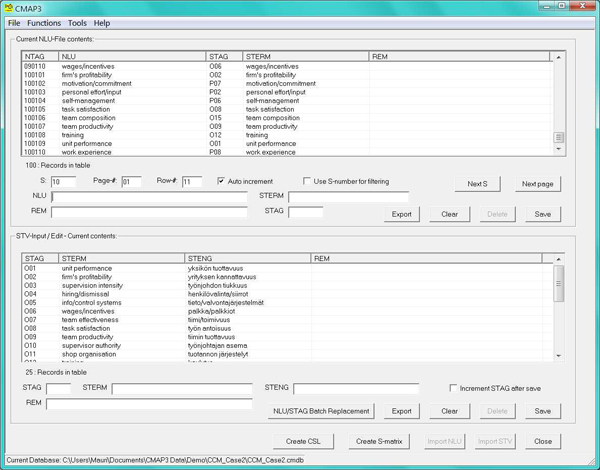
Figure 3: CMAP3's Node Data & Standardizing-module [32]
The above entry operations input the NLUs into CMAP3, with their standardizing codes. A second module (Figure 4) is used to enter the natural causal statements (NCUs) contained in the raw data and as available in the RDSs. Because the NLUs have already been entered, NCU-entry is reliable and fast by simple mouse clicks. This will link the NLUs to each other corresponding to the original causal links in the RDSs. In CCM-studies, where respondents must also specify causal links, this data will be entered along the causal links as well. [33]
Concerning NCU-specification, it is customary to use two dimensions: direction and weight (D, W). CMAP3 supports this practice, too. A typical 4) usage is that D (direction, with values + or -, default = +) tells whether the causal influence is perceived as direct (+) or reverse (-). In direct relationships an increase in the cause variable leads to an increase in the effect or consequent variable. The second item, W (weight), can refer as defined by the researcher, e.g., to strength, significance, certainty, or some other aspect of the causal relationship as perceived by the respondents, using a three-point scale (1, 2, 3). However, it is a good idea to assess the form and even the very usefulness and relevance of this practice in each case.
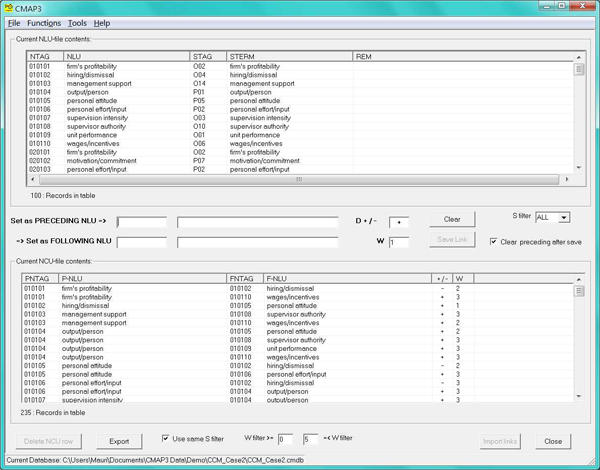
Figure 4: Original causal links' (Natural Causal Unit / NCU) entry/editing module [34]
As noted above, the distinctive feature of structured CCM such as the concept pool (aka hybrid) approach is the common concept pool (N = 50 +/- 5), predefined by the researcher. The respondents first pick from the pool (called in CMAP3 the concept selection list, CSL) a personal subset (n= 8-13) of concepts (=map nodes). Then, in a separate stage, they indicate their perceived causal links in some process of a paired comparison of their subset's concepts, or by joining those concepts by freehand drawing on paper or computer screen. In typical studies of this kind, respondents also specify the causal links, as discussed above. [35]
It follows from the concept pool technique that the raw data's concepts are pre-coded or -standardized, because the respondents must stay within the common concept pool and cannot give/use their own expressions. Whilst this can, as noted, raise issues of validity, one of the ensuing administrative advantages is that there is no need of ex post coding/standardizing. [36]
Using the concept pool approach with CMAP3, raw data entry could be done by keyboard, as above in the case of semi/low-structured data. However, it is more efficient to import the raw data into the CMAP3-project directly in the form of Excel-files using the same modules as above. The NLU-module is first used to construct and enter or import the concept pool, which in this case will create the project's standard term vocabulary (STV). When the STV is in place, the researcher can use the NLU-module further to produce the concept selection lists (CSL) for the respondents. They choose their own concept sets by selecting/marking in the CSL. CMAP3 can then import the CSL-Excel-files to create the NLU-base (ready-coded) for each respondent. [37]
For eliciting the causal links (NCUs), CMAP3 can create square (adjacency) matrices for each respondent as Excel-files. These contain, as row and columns, the respondent's concept subset (e.g., 12 * 12 concepts), assuming it imported from her/his CSL. Depending on the technique, the interviewer or the respondent indicates the perceived causal relations directly by marking the appropriate matrix cells, with eventual specifications (e.g., +1, -3, etc.). The marked matrices are successively imported into CMAP3, where they become the project's NCU-base. [38]
Different techniques are conceivable for eliciting raw data (NLUs, NCUs) in the concept pool approach. For instance, this author has emailed (as attached Excel-files) first the CSLs and then the NCU-square matrices to the respondents, who emailed them back to be imported into CMAP3. A more traditional in situ option is to use a stack of concept cards (= pool) and present them to the respondents' for choosing the personal concept sets (MARKÓCZY & GOLDBERG, 1995). Thereafter, a paired comparison or freehand drawing for the causal links could be administered. The resulting data could be first noted on appropriate forms and input later in spreadsheet format and imported into CMAP3. There could of course be further techniques and combinations of administrator/respondent roles and interaction. [39]
The entered and coded original concepts (NLUs) and causal links (NCUs) are raw data, which must be processed further. A key function of CMAP3 is to translate the original cause concepts and links into the standardized (coded) language of the STV. This produces, respectively, a set of standard node terms (SNTs) and standard causal units (SCUs), both having their own database in the project. The translation process, generation, which usually takes only some seconds, is the same in semi-/low-structured and structured CCM. In addition to the raw data-to-standardized data conversion, the generation calculates the incidence (ownership) of each SCU and SNT, showing which and how many (total frequency, TF) respondents had a correspondingly coded NLU and NCU in the original data. It also calculates the In-, Out-, and Total degree values (Id/Od/Td)5) for each emerging SNT.
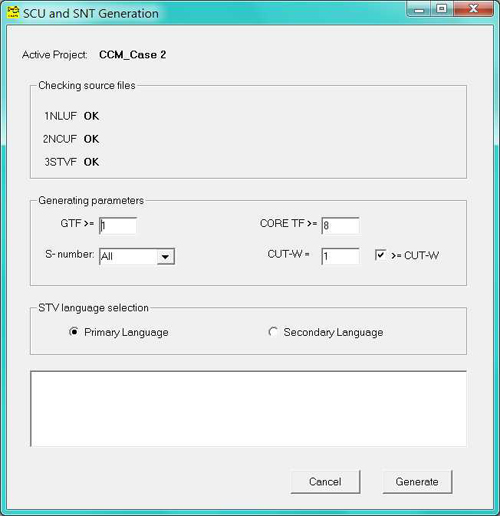
Figure 5: CMAP3 generation module [40]
For the conversion process CMAP3 contains a special module (Figure 5). At the outset, the researcher usually enters a set of parameters, which define the operation and its output. These include 1. a cut-off generation point (GTF): the minimum number of respondents (TF), whose data will be included in the output. If the cut-off point is higher than the default GTF>=1, the generation will exclude "outliers" (less-shared SCUs and SNTs), leading to an output of SCUs and SNTs, which the user defines typical or interesting. Another parameter is 2. CORE frequency: how many respondents must "own" an SCU/SNT so that it will be regarded (in that particular study) as a central or typical SNT/SCU. 3., SCU- and SNT-tables can be generated for all or a single respondent, which enables a more detailed analysis. Furthermore, 4. assuming the NCU-data contains specification data, the user can define a cut-off point for the W (weight) value (1, 2, and 3). In this way, e.g., only those NCUs will be observed and corresponding SCUs generated, which were considered most important. Finally, 5. assuming the STV contains two SNT-languages, the language of the SCU/SNT-tables (and all output based on them) is defined here. [41]
The generation process uses but does not change the NLU/NCU- or STV-data tables. Moreover, it can be repeated quickly and as often as useful. This enables, e.g., iterative testing of coding or different generation criteria when exploring hypotheses or doing evocative search.
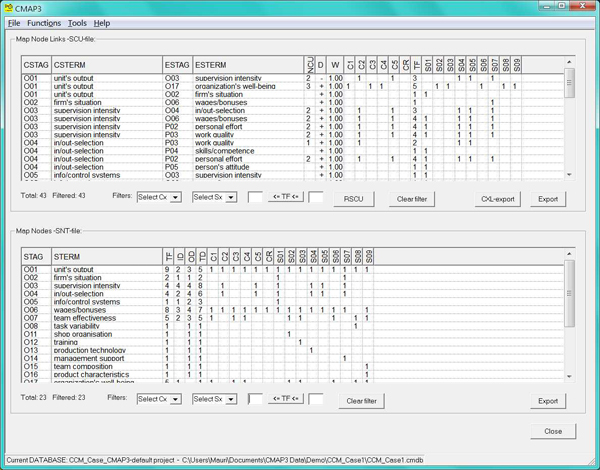
Figure 6: SCU- and SNT-browser with numerical incidence, frequency (TF), and Id/Od/Td-data. [42]
For a substantive, content-oriented analysis of the output cause maps, the researcher can, first, browse the generated standard causal unit and standard node bases (Figure 6) using different filters. This makes it possible to display SCUs or SNTs for a specific TF, predefined cluster of respondents or a single respondent. For a more detailed cause maps analysis there are two modules, which display so-called Domain Maps (DM) and Focal Maps (FM). Technically, these are SCU-sets selected and displayed by CMAP3 around a defined focal seed SNT-concept. DMs and FMs too are viewable using different filters and exportable. [43]
For a quantitative cause map analysis, CMAP3's Statistics-module6) (Figure 7) calculates a set of map-based numerical indicators. These include the numbers of raw and standard nodes and causal links, their ratios, and an indicator of map densities (ratio of elicited SCUs vs. maximal number of SCUs). In addition, CMAP3 calculates a C/D-index to indicate the degree of respondents' shared SNTs or SCUs. Thus, respondents' or the predefined clusters' mutual closeness to or distance from each other can be assessed in terms of either the used concepts or perceived causal ideas (as coded).
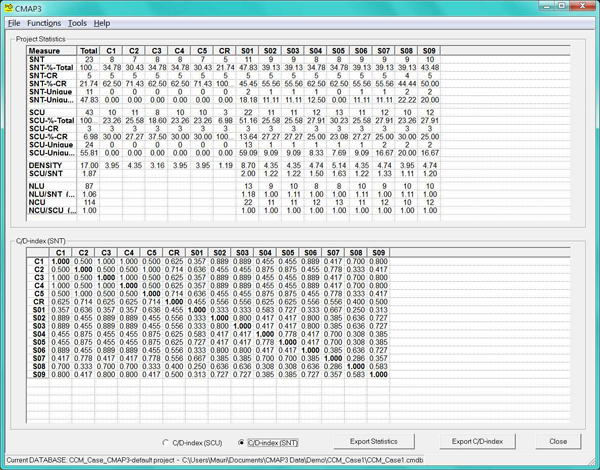
Figure 7: Cause map-based numerical indicators, correspondence/distance (C/D) index matrix. [44]
3.4 Output and visual cause maps
An important advantage of CMAP3 is that all entered raw data tables (NLU, NCU, STV) and all generated output tables (SCU, SNT, FM, DM, Statistics, C/D-index, NLU/SNT-matrix) can be exported from CMAP3 as standard Excel-files. This enables an external Excel-based data analysis and flexible paper printing. In addition, by exporting the C/D-index matrix in Excel-format, e.g., to SPSS, the researcher can use statistical methods such as cluster analysis. [45]
As discussed in Section 4, depending on the approach, CCM-research either emphasizes a substantive, content-oriented analysis of the emerging cause maps and concepts or uses numerical indicators for classification and cause map structure oriented analysis. It follows, perhaps paradoxically, that in typical CCM-studies with different scientific objectives visual causal maps serve mainly illustrative, supporting purposes. When visual maps are needed, CMAP3 offers two flexible alternatives. The faster and more convenient option is to export (all or filtered) SCUs, FMs or DMs into CmapTools (see Footnote 7). This is a free concept mapping application, suitable also for creating, editing and annotating causal maps (e.g., Figure 1). The second option especially for drawing complicated and annotated causal maps is to successively copy the SCU-sets produced by the FM-module into an application like PowerPoint. [46]
CMAP3 places no restrictions to the numbers of natural data (NLU, NCU), the standard vocabulary (STV) or output standardized concepts and causal links (SNT, SCU) in a single CCM-project. Thus, the original or the output cause maps (or equivalent forms) have no specific size limits. Moreover, the number of separate CCM-projects, which can be accessed by CMAP3, is not limited. This can be useful in studies, which use two or more parallel projects, e.g., having the same raw data base but using different coding systems (STV). [47]
The current main limitation is that the number of respondents (or distinct data sources like documents to be handled separately) in a single project is N = < 50. However, as a sample size, this seems more than adequate considering the majority of published CCM-studies, including the cases mentioned below (with the exception of CLARKSON & HODGKINSON, 2005). In some cases the N-limitation can be by-passed by using two or more parallel CMAP3-projects, which could share the same STV and coding strategies. [48]
A further general constraint is that CMAP3 is a PC-application, i.e., it works in Windows-computers (XP, Vista, 7). Moreover, the support applications MS Excel and CmapTools, possibly MS PowerPoint, must also be available in the same computer as CMAP3. [49]
CMAP3 is an academic project. Therefore, the software itself (with tutorial cases) and support documents can be downloaded7) without cost. The purpose is to thus offer interested researchers a convenient and affordable way of testing and using of the software. [50]
4. Discussion: Using Comparative Causal Mapping
This section concretizes the above discussion by describing types and cases of CCM-studies, which share the general causal map platform, but use different variants of CCM. An overview of how CCM has been applied to different target phenomena, research interests and method approaches hopefully demonstrates the versatility and potential of comparative causal mapping methods and CMAP3. [51]
Without attempting an exhaustive inventory of extant CCM-research at least six general CCM-study types can be discerned:
Capturing and describing the overall thought patterns that characterize a certain organization or a type or class of organizations, such as an industry. Examples of this type are the classic study of organizational cognitions of members of a jazz orchestra (BOUGON et al., 1977) and the recent investigation of mental representations of call center frontline employees (CLARKSON & HODGKINSON, 2005). Methodologically, both less and highly structured CCM-approaches with CMAP3 could be used in this study category, depending on research objectives and sample size.
Causal mapping methods can be used to classify (measure) actors in terms of their causal beliefs structures' characteristics, e.g., by clustering them into cognitively homogenous groups. Typical criteria (indicators) have been respondents' cognitive distance, i.e., the degree of correspondence of their causal beliefs, or structural dimensions such as individual cause maps' complexity or density. Often, these studies' objective is to test hypotheses, e.g., the impact of national cultures (MARKÓCZY & GOLDBERG, 1995) or the influence of respondents' membership in an organizational function like marketing or finance (TYLER & GNYAWALI, 2009). Some studies use structured methods, some semi- or low-structured CCM. As a technical platform CMAP3 is applicable in both cases, as long as N < 50.
Distilling aggregated patterns of shared knowledge and beliefs of organizational actors or domain experts about a specific issue or theme. An example of this is the SBA-study (LAUKKANEN & NIITTYKANGAS, 2010) mentioned above. It explored small business advisors' beliefs about the causal factors and consequences of nascent firms' success and failure and their growth/smallness tendencies. Such studies are often exploratory and would need semi- or low-structured CCM-methods, and can thus use CMAP3, too.
Overtly similar to Type 3, CCM-studies can focus on creating a model of how some target system or domain is constituted and functions, usually as perceived by knowledgeable respondents such as domain professionals. Their views can be elicited by interviewing, questionnaires or text-writing tasks. From this data an aggregated causal map would be distilled to serve as the target model. Examples of studies of this type are modeling commuter traffic (ROBERTS, 1976), the evocation of a "mid-range theory" of IT-support in organizations (NELSON, NADKARNI, NARAYANAN & GHODS, 2000), and modeling local small economies as conceived by small municipality directors (LAUKKANEN & NIITTYKANGAS, 2003). Corresponding to such studies' data and exploratory character, semi- or low-structured CCM-methods are typical. CMAP3 has been or could be used in such studies.
CCM-methods can be applied to study the short-term changes or the long-term evolution of some actors' belief patterns. The underlying idea could be to examine the effects of an intervention like educational measures or organizational change or how the evolution is driven by some external developments. A classic study of long-term evolution is that of HALL (1976). It focused on evolving organizational cognitive pathologies, i.e., erroneous strategic beliefs, which eventually culminated in the demise of a major weekly journal. A more recent study (LAUKKANEN, 2001) examined a single general manager's causal maps' change over a period of seven years, dominated by an economic depression. The objective was to understand the formative logic of managerial learning, specifically the adoption and unlearning of concepts so as to constantly maintain an adequate cognitive grip of the domain. In such studies, structured CCM-methods could be applied assuming very narrow issues and foreseeable but variable cognitive contents. If, as is more usual, the thought pattern contents cannot be known at the outset as is typical in exploratory studies, semi- or low-structured CCM is called for. CMAP3 has been or could be used in all these cases.
A final application type of CCM is comparing actors' like students', trainees' or lay persons' subjective concepts and causal notions about an important theme against some benchmark contents. Depending on the case, such a comparison template could represent scientific knowledge, textbook contents or expert views, etc. Studies like this have assessed the prevalence of some ideal contents (NADKARNI & NARAYANAN, 2005; PRIEM & ROSENSTEIN, 2000). They could also locate areas and types of "deviant" thinking. Technically, as noted above, the template would be entered in the coding system (STV) in addition to eventually emerging other concepts. Another possibility would be using dummy respondents to represent the template or deviant belief systems. Either structured or semi-/low-structured CCM-methods could be used. [52]
To summarize, three underlying dimensions characterize and differentiate the above CCM-study types. First, there are different conceptions about target phenomena. Typically, two interpretations and study genres exist: cognition-oriented and system-oriented. The cognitive view, the more frequent one, posits causal maps as representations of the cognitions of an individual, a collectivity (real or virtual), an organization, or even a larger social entity, as in industry or cultural studies. As discussed in the introduction, "cognitions" refer in this case to the actors' or collectivities' subjective knowledge and beliefs about how the domain or issue is structured and how it works, i.e., what entities the domain/issues comprises and what causal relationships are perceived there. [53]
In contrast, in system-oriented studies (Type 4) cause maps are primarily understood as visual models of a social or socio-technical system like a local economy or an IT-support process. Overtly, system-oriented CCM-studies may share methods and data with cognitively oriented studies, e.g., when eliciting knowledge by interviewing individuals who are assumed to know the domain. Thus, although the data is "cognitive" (actors' subjective knowledge and beliefs), the target is "non-cognitive" and conceptualized to exist independently of the individuals in a realist sense. In this case, cause maps and CCM-techniques serve mainly as data acquisition and control platforms and as devices for capturing, visually representing, and analyzing the actors' system-related knowledge. [54]
Conceivably, there could be further kinds of target conceptualizations with corresponding applications of CCM-methods. For instance, they could be adapted to communication studies focused on local vernaculars as in linguistic research comparing the discourse of different expert groups, or when analyzing typical patterns of attribution and causal argumentation (cf. MAOZ & SHAYER, 1987). [55]
Second, CCM-studies' research interests or goals represent the normal categories in social research. Some are essentially descriptive, focusing on revealing and describing what is typical in some actors' thinking in general or in terms of a specific issue (cf. Type 1). However, it is more common that CCM-studies have, in addition to descriptive goals, either explanatory objectives or evocative, theory-development purposes. Examples of this are studies seeking to understand the formative mechanisms of actors' knowledge (Types 2, 3), examining the implications of typical thought patterns (Type 3), or revealing a domain's internal structure and mechanisms for creating a tentative system model (Type 4). Finally, CCM-applications can have mainly pragmatic goals of trying to find out and understand a target system's structure and behavior in order to eventually influence either the system (Types, 4, 6) or sometimes rather the ways how relevant actors think about it. [56]
A recent development in CCM-research has been an attempt to introduce quantitative approaches (Types 1, 2) in order to enable traditional nomothetic hypothesis-testing and confirmatory studies. To be able to generalize findings, such CCM-studies need large samples and, consequently, mass elicitation methods and predominantly quantitative analysis of data (HODGKINSON & CLARKSON, 2005; CLARKSON & HODGKINSON, 2005). Correspondingly, they would be less interested in (or even capable of) understanding the substance and contents of respondents' thinking or their implications, as is typical of qualitative CCM. Rather, they would emphasize cause map-based structural analysis and quantitative indicators for clustering respondents using computer-supported techniques. [57]
Third, in terms of overall methodology and the nomothetic/idiographic-divide, most CCM-research published so far, including the majority of the above mentioned studies, are characteristically qualitative. They use small samples, whose composition and size is usually determined by saturation logic and exploratory, evocative, and inference objectives (NELSON et al., 2000; EISENHARDT & GRAEBNER, 2007), not by an intention to generalize findings to some population. Furthermore, the type of data and applied methods of acquisition, processing and analysis are characteristically qualitative, i.e., different semi- or low-structured approaches involving rich original data and interpretive coding. This does not, however, mean that structured CCM-methods or, perhaps more typically, different forms of numerical analysis and "counting the countable" would not be occasionally useful, even important also in small-sample, qualitatively oriented CCM-studies. [58]
In conclusion, it can be seen that the causal map platform and comparative causal mapping methods, combined with a software tool like CMAP3, have broad applicability in many areas of social studies with different research goals. This encompasses not only studies concerned with individual and intra- or inter-organizational knowledge/beliefs and sense making, but also other cognition-related studies of topics such as diffusion of ideas and innovations, organizational change or conflicts, team processes, cultural contents or cross-cultural studies. Such versatility is possible, first, because CCM-methods are inherently neutral in terms of how the target phenomena are conceptualized. Second, they enable tackling a wide range of research tasks and objectives from descriptive to exploratory and explanatory or pragmatic. Third, there exist (and can be devised) different modifications of CCM-methods for not only different methodological tasks, but to accommodate social researchers' varying preferences such as those representing the qualitative/quantitative divide. Fourth, as is increasingly expected by today's qualitative and quantitative researchers, there are accessible software applications and computerized environments for different CCM-approaches and tasks. Together, such elements provide objective conditions for CCM-methods and research. However, to inspire and launch innovative new CCM-studies, key to these methods' wider diffusion and academic acceptance, more awareness about the tradition itself and the research opportunities it offers may be needed particularly in continental EU. [59]
1) An earlier version of this article was presented at the Qualitative Computing: Diverse Worlds and Research Practices Conference, February 24-26, 2011, Istanbul, Turkey. The author wishes to thank the conference participants and especially the FQS Special Issue's editors and reviewers for their useful comments. <back>
2) The terminology is somewhat unsettled. In the beginning, AXELROD's (1976) seminal volume made "cognitive map/mapping" common. However, as it was recognized that there are many other aspects of cognitions (besides causal knowledge) that can be mapped, "causal/cause map/mapping" has become more dominant. Furthermore, unfortunately, some papers use the main terms (cognitive map and/or cause map) inconsistently to refer simultaneously both to the internal mental models and their external mapped representations. <back>
3) CMAP3 uses the following acronyms: NLU = natural language units (for respondents' original expressions defined as a unit); NCU = natural causal units (for original statements about a causal influence between two NLUs); STV = standard term vocabulary (the project's coding scheme); SNT = standard node term; SCU = standard causal unit. <back>
4) Although specifying causal links has been traditional in structured CCM, the utility of this practice deserves to be considered to assess how useful and valid the added data actually is in each case. E.g., the causal direction of a link (D, +/-) is often self-evident and would seldom really differentiate the respondents. W-values, indicating some subjective assessment of causal links in terms of dimensions like subjective importance, vary more, and could thus be potentially more informative. However, their transitivity and thus usefulness as valid comparison bases may be questionable. In any case, the acquisition D- and W-data necessarily demands time and vigilance and administrative effort, which might be better used to cover more of the domain/issue or in more detail. <back>
5) An indegree (Id) tells how many influences (as standardized) flow into a given standard map node (SNT); outdegree (Od) how many outgoing links an SNT has; total degree (Td) being their sum. They have been used to indicate (roughly) a cause map's nodes' (perceived) status in the mapped system or in the prevailing thought/belief patterns. For instance, an SNT with a low Id and high outdegree can be regarded as an influential givens- or tool-factor, and an SNT with high Id- and low Od-values a goal-type phenomenon. <back>
6) A C/D-value of 0 means that a pair of respondents (clusters) share no SCUs or SNTs (either can be used in CMAP3) in common, a value of 1 that their SCU- or SNT-bases (as generated) are identical. C/D-values can indicate the mutual proximity or distance of respondents or their eventual predefined clusters. CMAP3 calculates C/D-values based on the last generated SCU- or SNT-base. Thus, they depend, in addition to raw data, on the used GTF-value, and of course on the coding/standardizing, which partly regulate the emerging commonality. <back>
7) Developing CMAP3 is a project of University of Eastern Finland, Department of Business, Kuopio Campus, supported by the Finnish Foundation of Economic Education (Liikesivistysrahasto). The CMAP3 setup file, with two model projects, and updated support documents can be downloaded without cost at: http://koti.mbnet.fi/cmap3/. For downloading the (free) CmapTools for drawing cause maps, please go to: http://cmap.ihmc.us/download/. For examining CognizerTM, please visit: http://www.mandrake.myzen.co.uk. To obtain a free limited demo version of CognizerTM, please send an e-mail to: info@mandrake-technology.com (with Cognizer 1.1 Demonstrator Request in the subject line). <back>
Axelrod, Robert (Ed.) (1976). Structure of decision: The cognitive maps of political elites. Princeton, NJ: Princeton University Press.
Bandura, Albert (1986). Social foundations of thought and action. Englewood Cliffs, NJ: Prentice-Hall.
Bazerman, Max H. & Moore, Don A. (2008). Judgment in managerial decision making (7th ed.). Hoboken, NJ: Wiley.
Bougon, Michel G.; Weick, Karl E. & Binkhorst, Din (1977). Cognition in organizations: An analysis of the Utrecht Jazz Orchestra. Administrative Science Quarterly, 22, 606‑639.
Carley, Kathleen M. (1997). Extracting team mental models through textual analysis. Journal of Organizational Behavior, 18, 533-558.
Clarkson, Gail P. & Hodgkinson, Gerard P. (2005). Introducing CognizerTM: A comprehensive computer package for the elicitation and analysis of cause maps. Organizational Research Methods, 8(3), 317-341.
Cossette, Pierre (2002). Analysing the thinking of F.W. Taylor using cognitive mapping. Management Decision, 40(2), 168-182.
Eden, Colin & Ackermann, Fran (1998). Analysing and comparing idiographic causal maps. In Colin Eden & J.-C. Spender (Eds.), Managerial and organizational cognition: Theory, methods and research (pp.193-209). London: Sage.
Eisenhardt, Kathleen M. & Graebner, Melissa E. (2007). Theory building from cases: Opportunities and challenges. Academy of Management Journal, 50(1), 25-32.
Evans, Jonathan St. B.T (1988). The knowledge elicitation problem: A psychological perspective. Behaviour and Information Technology, 7(2), 111-130.
Evers, Jeanine C.; Mruck, Katja; Silver, Christina & Peeters, Bart (Eds.) (2011). The KWALON experiment: Discussions on qualitative data analysis software by developers and users. Forum Qualitative Sozialforschung / Forum: Qualitative Social Research, 12(1), http://www.qualitative-research.net/index.php/fqs/issue/view/36 [Accessed: April 5, 2012].
Frederiksen, Carl H. (2001). Propositional representations in psychology. In Neil J. Smelser & Paul B. Baltes (Eds.), International encyclopedia of the social & behavioral sciences (pp.12219-12224). Elsevier, Online edition [Accessed: April 5, 2012].
Gentner, Dedre (2001). The psychology of mental models. In Neil J. Smelser & Paul B. Baltes (Eds.), International encyclopedia of the social & behavioral sciences (pp.9683-9687). Elsevier, Online edition [Accessed: April 5, 2012].
Gephart, Robert P. (2004). Qualitative research and the Academy of Management Journal. Academy of Management Journal, 47(4), 454-462.
Hall, Roger I. (1976). A system pathology of an organization: The rise and fall of the old Saturday Evening Post. Administrative Science Quarterly, 21, 185-211.
Hodgkinson, Gerard P. & Clarkson, Gail P. (2005). What have we learned from almost 30 years of research on causal mapping? In V.K. Narayanan & Deborah J. Armstrong (Eds.), Causal mapping for research in information technology (pp.46-79). Hershey, PA: Idea Group Publishing.
Hodgkinson, Gerard P.; Maule, A. John & Bown, Nicola J. (2004). Causal cognitive mapping in the organizational strategy field: A comparison of alternative elicitation procedures. Organizational Research Methods, 7(1), 3-26.
Johnson-Laird, Philip N. (1983). Mental models. Cambridge: Cambridge University Press.
Johnson-Laird, Philip N. (2001). Reasoning with mental models. In Neil J. Smelser & Paul B. Baltes (Eds.), International encyclopedia of the social & behavioral Sciences (pp.12821-12824). Elsevier, Online edition [Accessed: April 5, 2012].
Krippendorff, Klaus (2004). Content analysis. An introduction to its methodology (2nd ed.). Thousand Oaks, CA: Sage.
Laukkanen, Mauri (1994). Comparative cause mapping of organizational cognitions. Organization Science, Special Issue on Managerial and Organizational Cognition, 5(3), 322-343.
Laukkanen, Mauri (1998). Conducting cause mapping research: Opportunities and challenges. In Colin Eden & J.-C. Spender (Eds.), Managerial and organizational cognition: Theory, methods and research (pp.168-189). London: Sage.
Laukkanen, Mauri (2001). Maintaining the cognitive grip: Managing and learning in a crisis. In Bo Hellgren & Jan Löwstedt (Eds.), Management in the thought-full enterprise (pp.93-120). Oslo-Bergen: Fagbogforlaget.
Laukkanen, Mauri (2008). Comparative causal mapping with CMAP3. A method introduction to comparative causal mapping and a user's manual for CMAP3. Kuopio University Occasional Reports H. Business and Information Technology 2, University of Kuopio, Finland, http://www.uku.fi/vaitokset/2008/isbn9789517815024.pdf [Accessed: April 5, 2012 ].
Laukkanen, Mauri & Niittykangas, Hannu (2003). Local developers as virtual entrepreneurs: Do difficult surroundings need initiating interventions? Entrepreneurship & Regional Development, 4, 309-331.
Laukkanen, Mauri & Niittykangas, Hannu (2010). Fostering entrepreneurship and sound small business? Exploring start-up-advisors' mindsets. Paper presented at the British Academy of Management Conference, September 14-16, 2010, Entrepreneurship Track, Sheffield, UK.
Levins, Ann & Silver, Christina (2007). Using software in qualitative research: A step-by-step guide. London: Sage.
Maoz, Zeev & Shayer, Anat (1987). The cognitive structure of peace and war argumentation: Israeli prime ministers versus the Knesset. Political Psychology, 8(4), 575-604.
Markman, Arthur B. & Gentner, Dedre (2001). Thinking. Annual Review of Psychology, 52, 223-247.
Markóczy, Livia & Goldberg, Jeff (1995). A method for eliciting and comparing causal maps. Journal of Management, 21, 305-333.
Merriam, Sharan B. (2009). Qualitative research. A guide to design and implementation. San Francisco, CA: Jossey-Bass.
Nadkarni, Sucheta & Narayanan, V.K. (2005). Validity of the structural properties of text-based causal maps: An empirical assessment. Organizational Research Methods, 8, 9-40.
Narayanan, V.K. (2005). Causal mapping: An historical overview. In V.K. Narayanan & Deborah J. Armstrong (Eds.), Causal mapping for research in information technology (pp.1-19). Hershey, PA: Idea Group Publishing.
Nelson, Kay M.; Nadkarni, Sucheta; Narayanan, V.K. & Ghods, Mehdi (2000). Understanding software operations support expertise: A revealed causal mapping approach. MIS Quarterly, 24(3), 475-507.
Nicolini, Davide (1999). Comparing methods for mapping organizational cognition. Organization Studies, 20(5), 833-860.
Pinker, Steven (2008). The stuff of thought: Language as window into human nature. New York: Penguin Books.
Priem, Richard L. & Rosenstein, Joseph (2000). Is organization theory obvious to practitioners? A test of one established theory. Organization Science, 11(5), 509-524.
Roberts, Fred S. (1976). Strategy for the energy crisis: The case of commuter transportation policy. In Robert Axelrod (Ed.), Structure of decision: The cognitive maps of political elites (pp.142-179). Princeton, NJ: Princeton University Press.
Rouse, William B. & Morris, Nancy M. (1986). On looking into the black box: Prospects and limits in the search for mental models. Psychological Bulletin, 100(3), 349-363.
Tyler, Beverly B. & Gnyawali, Devi R. (2009). Managerial collective cognitions: An examination of similarities and differences of cultural orientations. Journal of Management Studies, 46(1), 93-126.
Walsh, James P. (1995). Managerial and organizational cognition: Notes from a trip down memory lane, Organization Science, 6(3), 280-321.
Wenger, Etienne C. & Snyder, William M. (2000). Communities of practice: The organizational frontier. Harvard Business Review, January-February, 139-145.
Wrightson, Margaret T. (1976). The documentary doding method. In Robert Axelrod (Ed.), Structure of decision: The cognitive maps of political elites (pp.291-332). Princeton, NJ: Princeton University Press.
Mauri LAUKKANEN, Dr.Sc. (econ.), is professor emeritus at the Department of Business, University of Eastern Finland, Kuopio Campus, Finland.
Contact:
Mauri Laukkanen
Ruoriniemenkatu 22 B 32
FIN-15140 Lahti
Finland
Phone: +358-40-5506552
E-mail: Mauri.Laukkanen@uef.fi
Laukkanen, Mauri (2012). Comparative Causal Mapping and CMAP3 Software in Qualitative Studies [59 paragraphs]. Forum Qualitative Sozialforschung / Forum: Qualitative Social Research, 13(2), Art. 13,
http://nbn-resolving.de/urn:nbn:de:0114-fqs1202133.

Creative Commons Attribution 4.0 International License