Volume 13, No. 2, Art. 14 – May 2012
An Application of Qualitative Geographic Information Systems (GIS) in the Field of Urban Sociology Using ATLAS.ti: Uses and Reflections
Joan Miquel Verd & Sergio Porcel
Abstract: Geographic information systems (GIS) have been used for many years to integrate social and territorial information in quantitative research, but only recently have they been used in qualitative research. Recent advances have allowed qualitative GIS to be incorporated in the latest versions of computer-aided qualitative data analysis software. This article describes how qualitative GIS integrated in ATLAS.ti were used to perform a recent study of the social production of urban space. It considers the role played by geocoding and georeferencing in this study, and the implications of using qualitative GIS in urban sociology and in sociological research in general.
Key words: urban space; multi-method design; geographic information systems (GIS); geocoding; georeferencing; ATLAS.ti
Table of Contents
1. Introduction
2. The Consolidation of GIS as a Methodological Tool beyond the Field of Geography
3. The Incorporation of GIS in CAQDAS Programs: Georeferencing and Geocoding as New Procedures for Qualitative Analysis
4. Qualitative GIS: New Possibilities for Analysis in Urban Sociology
5. An Application of Qualitative GIS in the Field of Urban Sociology: The Case of the Parc dels Tres Turons [Three Hills Park] in Barcelona
5.1 Background
5.2 The social production of urban space as an object of study
5.3 Methodological aspects
5.4 The role of qualitative GIS in the study
5.4.1 Information management
5.4.2 Conceptual work
5.4.3 Graphic presentations
6. Conclusions
Geographic Information Systems (GIS) can be defined as a set of methods, software and technologies developed for the storage, analysis and mapping of geographic information. For decades, the integration of social and territorial information through GIS was exclusively quantitative, and qualitative data were neglected. However, in recent years qualitative GIS have been greatly favored by the coming together of critical human geography and the social sciences in the study of socio-spatial phenomena. In fact, this breakthrough in the design and use of GIS has also become an important resource for mixed method and multi-method approaches. Computer-aided qualitative data analysis software (CAQDAS) has also been affected by this trend, incorporating GIS technology and thus offering the possibility of georeferencing and geocoding1) qualitative information. [1]
The role played by the latest developments of qualitative software in incorporating GIS in the social sciences is of paramount importance. These developments have overcome one of the barriers that just a few years ago hindered the integration of geographic data and qualitative data, thus opening new technical possibilities for a qualitative approach to socio-spatial reality. Qualitative (and quantitative) GIS have thus become a fundamental tool in the field of urban sociology, which is specifically interested in studying the interweaving of social and spatial phenomena. The inclusion of GIS technology in CAQDAS can help to strengthen the presence of the qualitative approach in this discipline and to overcome its traditional subordination to quantitative methods. [2]
Taking this situation as a starting point, this article explains in depth the use of a CAQDAS (ATLAS.ti) integrating GIS and assesses their role in the management and coding of socio-spatial information within the framework of a sociological study on urban transformation in the city of Barcelona. This study followed a multi-method design with a strong ethnographic character and made extensive use of socio-spatial data. [3]
The article is divided into five main sections. In Section 2 we consider how GIS and the social sciences have come together. In Section 3 we describe how GIS have been introduced in recent versions of the main CAQDAS packages. In Section 4 we place this technological advance in the methodological context of urban sociology. In Section 5 we describe how qualitative GIS were used in our study of the social production of urban space, and evaluate their potential and limitations. Finally, in conclusion, we make some comments on the role played by GIS in the study and the role that they can play in the future in the field of urban sociology, and by extension, in sociology in general. [4]
2. The Consolidation of GIS as a Methodological Tool beyond the Field of Geography
The rapid development of GIS from the 1980s until now has created new possibilities in the world of cartography and territorial analysis. The definition of GIS as a specific research area within geography2) in the late 1980s helped to foster new applications and improve existing ones, substantially increasing the number of possible applications. However, this would not have been possible without the relentless and exponential progress of information and communication technologies. These two circumstances explain why GIS have become a powerful and extremely versatile new platform for representing geographic information through interactive maps (SCHUURMAN, 2004; COPE & ELWOOD, 2009). One of the most important recent developments has been the simplification of the operation of GIS, and especially of the way in which spatial information is collected, handled and analyzed, favoring its application in other fields outside geography (LONGLEY, GOODCHILD, MAGUIRE & RHIND, 2005). [5]
In the early 1990s, the adoption of this resource by critical human geography, especially from a feminist perspective, brought GIS to the study of socio-spatial issues (SHEPPARD, 2005; O'SULLIVAN, 2006). Furthermore, this shift in the use of GIS towards social mapping was accompanied by growing interest in qualitative methods within human geography, arising from the need to cover comprehensive objects of study, such as gender understood as a social construct (KWAN, 2002). In the search for a deeper and more effective knowledge of socio-spatial phenomena, human geographers were forced to rely on qualitative or mixed methods (AITKEN & CRAINE, 2009; KNIGGE & COPE, 2006, 2009; McLAFFERTY, 2002; NIGHTINGALE, 2003; PAVLOVSKAYA, 2002). [6]
Other authors choose to recognize the analytical potential of GIS in the broader sense, emphasizing their suitability for studying socio-spatial reality and thus separating them from the positivism and the quantitative and logical-deductive methodology to which they had been linked since their inception (SHEPPARD, 1995; PICKLES, 1995; MILLER, 1995). These authors evaluate the capacity of GIS as an analytical tool in itself, emphasizing their compatibility with mixed methods and even with qualitative methods. They also mention their suitability for inductive research models because of their reliability as exploratory techniques (SHEPPARD, 2005). The new methodological features of GIS thus mean that they are not limited to the representation of socio-spatial information but can also be used as an analytical tool and a device for integrating different methodologies. [7]
This set of parallel processes has helped other social sciences interested in the study of space, such as sociology and anthropology, to consider the possibility of using GIS. An example of this trend can be found in the integration of ethnography and GIS performed by MATTHEWS, DETWILER and BURTON (2005) in a study on the social development of children from low-income families and the role of state aid in the United States. Though it also used data from a specific survey, the study integrates ethnographic data from various sources (interviews, observations, documents, etc.) through GIS, in a procedure called "geo-ethnography" (MATTHEWS et al., 2005; SKINNER, MATTHEWS & BURTON, 2005). These authors point out the effectiveness of GIS as a tool of analysis, stating that the maps improve the understanding of the data and that GIS are able to integrate different types of information. Another example is that of the urban ecologists SAMPSON, MORENOFF and EARLS (1999), who show another sociological application of GIS, this time a quantitative one, in a study on neighborhood effects of youth development in the city of Chicago. The data they used came from a survey and the census, on which they performed various multivariate analyses and plotted the results on maps. The mapping of data using GIS shows how the socio-spatial differences are distributed in the neighborhoods studied. [8]
Space is a great meeting point between disciplines, because it provides a framework for integrating social, or rather socio-spatial, processes that encompass several domains of the social sciences (GOODCHILD, ANSELIN, APPELBAUM & HARTHORN, 2000), and GIS is an important methodological tool for analyzing these processes. FIELDING and CISNEROS (2009) reflect on the convergence between qualitative geography and qualitative social sciences, a synergy that they also transfer at a more technical level to GIS and qualitative analysis programs. These authors note that both orientations have emerged in relation to new research technologies, using these new developments in favor of systematic, formal and transparent analytical practices. They also claim that the two disciplines are complementary for studying space. Whereas geography can teach social science to be sensitive in scale, location, context and flows, social science can teach geography to improve the documentation of processes and cultural variations, and to adopt formal analytical strategies. [9]
3. The Incorporation of GIS in CAQDAS Programs: Georeferencing and Geocoding as New Procedures for Qualitative Analysis
The dissemination of qualitative GIS outside the specific field of geography has benefited (and will benefit even more in the future) from their incorporation in the latest versions of software for qualitative analysis. The most recent editions of ATLAS.ti, NVivo and MAXQDA incorporate, albeit with some differences, the possibility of georeferencing and/or geocoding. [10]
In ATLAS.ti, the program that we used in our research, the geocoding (and also georeferencing) procedure is done by assigning the Google Earth mapping program as a primary document. Like a fragment of text, any part of the earth's surface can be delimited as a territorial quotation, which can be given a code or linked to a memo. In addition, Google Earth is embedded in ATLAS.ti as an external application and remains operative throughout the analysis, leaving all its features available for data processing. [11]
In the case of NVivo, the procedure is very similar. The only difference is that it also allows researchers to add more kinds of moldable "forms" than ATLAS.ti to the images provided by Google Earth, in order to highlight or mark areas of space that are being analyzed. Finally, MAXQDA is perhaps the program that provides the most sophisticated integration with GIS technology. In addition to the functions outlined above, this software allows users to create a link to ArcGIS, offering the possibility of creating new maps other than the aerial photographs of Google Earth. However, although MAXQDA provides this option that improves the graphical representation of the maps, it does not involve at the end too many differences from the other two qualitative analysis programs. In the case of ATLAS.ti and NVivo, KML and KMZ files3) generated by Google Earth also can end up being exported to ArcGIS by an external way.4) [12]
As stated in the introduction, this incorporation of qualitative GIS in social research has consolidated the use of the terms georeferencing and geocoding, but the distinction between them is not very clear. Georeferencing is the most common term in the literature, although ATLAS.ti, for example, uses the term geocoding. In fact both terms refer almost always to the same analytical procedure, although it is possible—and even desirable—to establish some semantic differences. [13]
Strictly speaking, georeferencing should be understood as the type of information processing that consists in the geographical localization and placing of qualitative material such as photographs, field notes, text fragments of documents and any other information. As pointed out by FIELDING and CISNEROS (2009), georeferenced information can come from the content of the materials used (for example, text fragments of interviews and other documents that refer explicitly to particular locations), or it can refer to the place where the data were produced (for example, the setting in which interviews were conducted). Obviously, in certain qualitative materials (photographs, observation notes, etc.) the content and the place where they were produced coincide. The aim is to establish a connection, or hyperlink, between the territory and the rest of the information being used, without this involving an analytical exercise in itself, but simply a process of "localization." As JUNG (2009) has correctly pointed out, georeferencing has a function of display or graphical presentation of specific locations, without a more developed analytic function.5) This link allows one to later analyze the geographically most contextualized and best localized data, so that the spatial dimension is incorporated in the process of reflection. [14]
In addition to its role of "context" or "container," the territory may also act as a "document" in itself, as socio-spatial information that is relevant to the analysis (the morphology of the territory, socio-spatial properties, the presence or absence of some kind of infrastructure or municipal facilities, etc.). In these cases the term georeferencing is somewhat forced, because no information on the territory is "referenced" or localized, but rather territorial information is processed analytically. This spatial information (the "document" provided by Google Earth within the qualitative analysis programs) can be encoded as any other qualitative document, even using codes that may be the same as those assigned to the other materials used. This encoding task is what should strictly be called geocoding. The territory consists here of information connected analytically to other data through codes. Geocoding can thus be said to produce dense codes that combine social and territorial information. Before CAQDAS programs incorporated qualitative GIS, this task had to be done manually (as was traditionally done in the encoding of texts). Today, however, territorial coding allows a deep analysis to be carried out at different levels, so the geographic and qualitative information enrich each other and improve the data analysis. [15]
4. Qualitative GIS: New Possibilities for Analysis in Urban Sociology
Despite the initial predominance of qualitative methods in urban sociology, especially thanks to the early contributions of the Chicago School (AZPURÚA, 2005), the qualitative approach has been largely neglected in this discipline. Indeed, the qualitative, ethnographic and markedly inductivist nature of the early work of urban ecologists at the University of Chicago led them to be criticized by some authors in the 1970s in their attempt to re-establish urban sociology (CASTELLS, 1971, 1976, 2004 [1972]; DELLA PERGOLA, 1973). These authors questioned the scientific value of the main studies by members of the Chicago School such as Robert PARK (1984 [1925]) and Louis WIRTH (1938), accusing them of being mere descriptions or journalism. The consolidation in the 1980s of New Urban Sociology, 6) a trend arising from these criticisms, and the adoption of quantitative methods by later ecologists (SHEVKY & BELL, 1955; BERRY & KASARDA, 1977) led the quantitative approach to become dominant and to eclipse qualitative work in urban sociological research. Qualitative methods did not cease to be applied in urban studies, but their use was relegated to community studies focusing on ghettos, immigrants, poverty and ethnic culture (GANS, 1982 [1962]; SUTTLES, 1968; HANNERZ, 2004 [1969]) and the ethnography of urban public space (JOSEPH, 1988; LOFLAND, 1998). The issues dealt with were more typical of urban anthropology than urban sociology, and the aim was to analyze everyday practices, dysfunctions and the alienation of modern life in cities. [16]
In the 1990s, new ways of understanding the city and growing interest in addressing the complexity of urban reality favored the resurgence of qualitative approaches outside the above fields (JACOBS, 1993). Qualitative methods were also obtaining greater recognition in science; thanks to their increasing consistency, transparency and rigor (FIELDING, 2005). In addition, urban sociologists desired to recover some of the tenets of inductivism. This epistemological shift was largely a reaction to criticism of the radical deductivism in the first Marxist models proposed by the New Urban Sociology (SAUNDERS, 1981). [17]
Because of their methodological suitability, the introduction of GIS in qualitative analysis programs is a further step towards the consolidation of the qualitative approach in urban sociology. The emergence of CAQDAS revolutionized qualitative analysis by simplifying information management, allowing several analytical elements (codes, memos and quotations) to be linked, and facilitating the recovery of text segments (KELLE, 1995; RICHARDS, 2005). The recent incorporation in these programs of some features of GIS as analytical tools offers a new range of possibilities, especially for qualitative socio-spatial analysis. [18]
5. An Application of Qualitative GIS in the Field of Urban Sociology: The Case of the Parc dels Tres Turons [Three Hills Park] in Barcelona
This section explains the role played by qualitative GIS in the already mentioned study of the urban transformation project called Pla del Parc dels Tres Turons, in the city of Barcelona (Spain). This project, initiated by the municipal government, involves the construction of an urban park through the expropriation and demolition of hundreds of inhabited houses, so it has been strongly opposed by the local community. The study focuses on the process of configuring urban space, understood as a social process. In this study we used ATLAS.ti 6.0 as a tool for qualitative analysis, so our comments on the use of qualitative GIS are strongly conditioned by the way in which this particular program incorporates this technology. However, as most programs have the same characteristics, these comments can be understood as a general assessment of all software that incorporates GIS technology. To place the subject in context, we will now introduce the design and objectives of the study. [19]
The urban area of Tres Turons in Barcelona, characterized by the protuberance of the three hills7) that give it its name, Turó de la Rovira, Turó del Carmel and Turó del Coll, has been subject to controversy for years. Although it is located right in the heart of the city (see Figure 1), it is still a poorly urbanized and fragmented part of the urban fabric that has been pending conversion into a large park for decades. [20]
The Tres Turons area was first zoned as an urban park in the 1950s, placing many privately owned houses and plots under the threat of expropriation. From then on the area required a specific project for its transformation into a park. In 1967 a partial development plan, the Plan Parcial de Ordenación de los Cerros de la Montaña del Carmelo, Turó de Rubira y Montaña Pelada y sus zonas adyacentes, was approved but it was never implemented, mainly because of the large number of properties that would be expropriated. In the 1960s, a period of explosive growth and lack of housing in Barcelona, thousands of immigrants from other parts of Spain started to build huts in Tres Turons (BOU & GIMENO, 2007). Over the years, self-built houses came to share the space with the earlier summer residences of the bourgeoisie, and some parts of it were rezoned to allow the construction of apartment blocks (FABRE & HUERTAS CLAVERÍA, 1976). This mixture of urban processes resulted in a highly heterogeneous urban setting, and made intervention in the area increasingly complex.
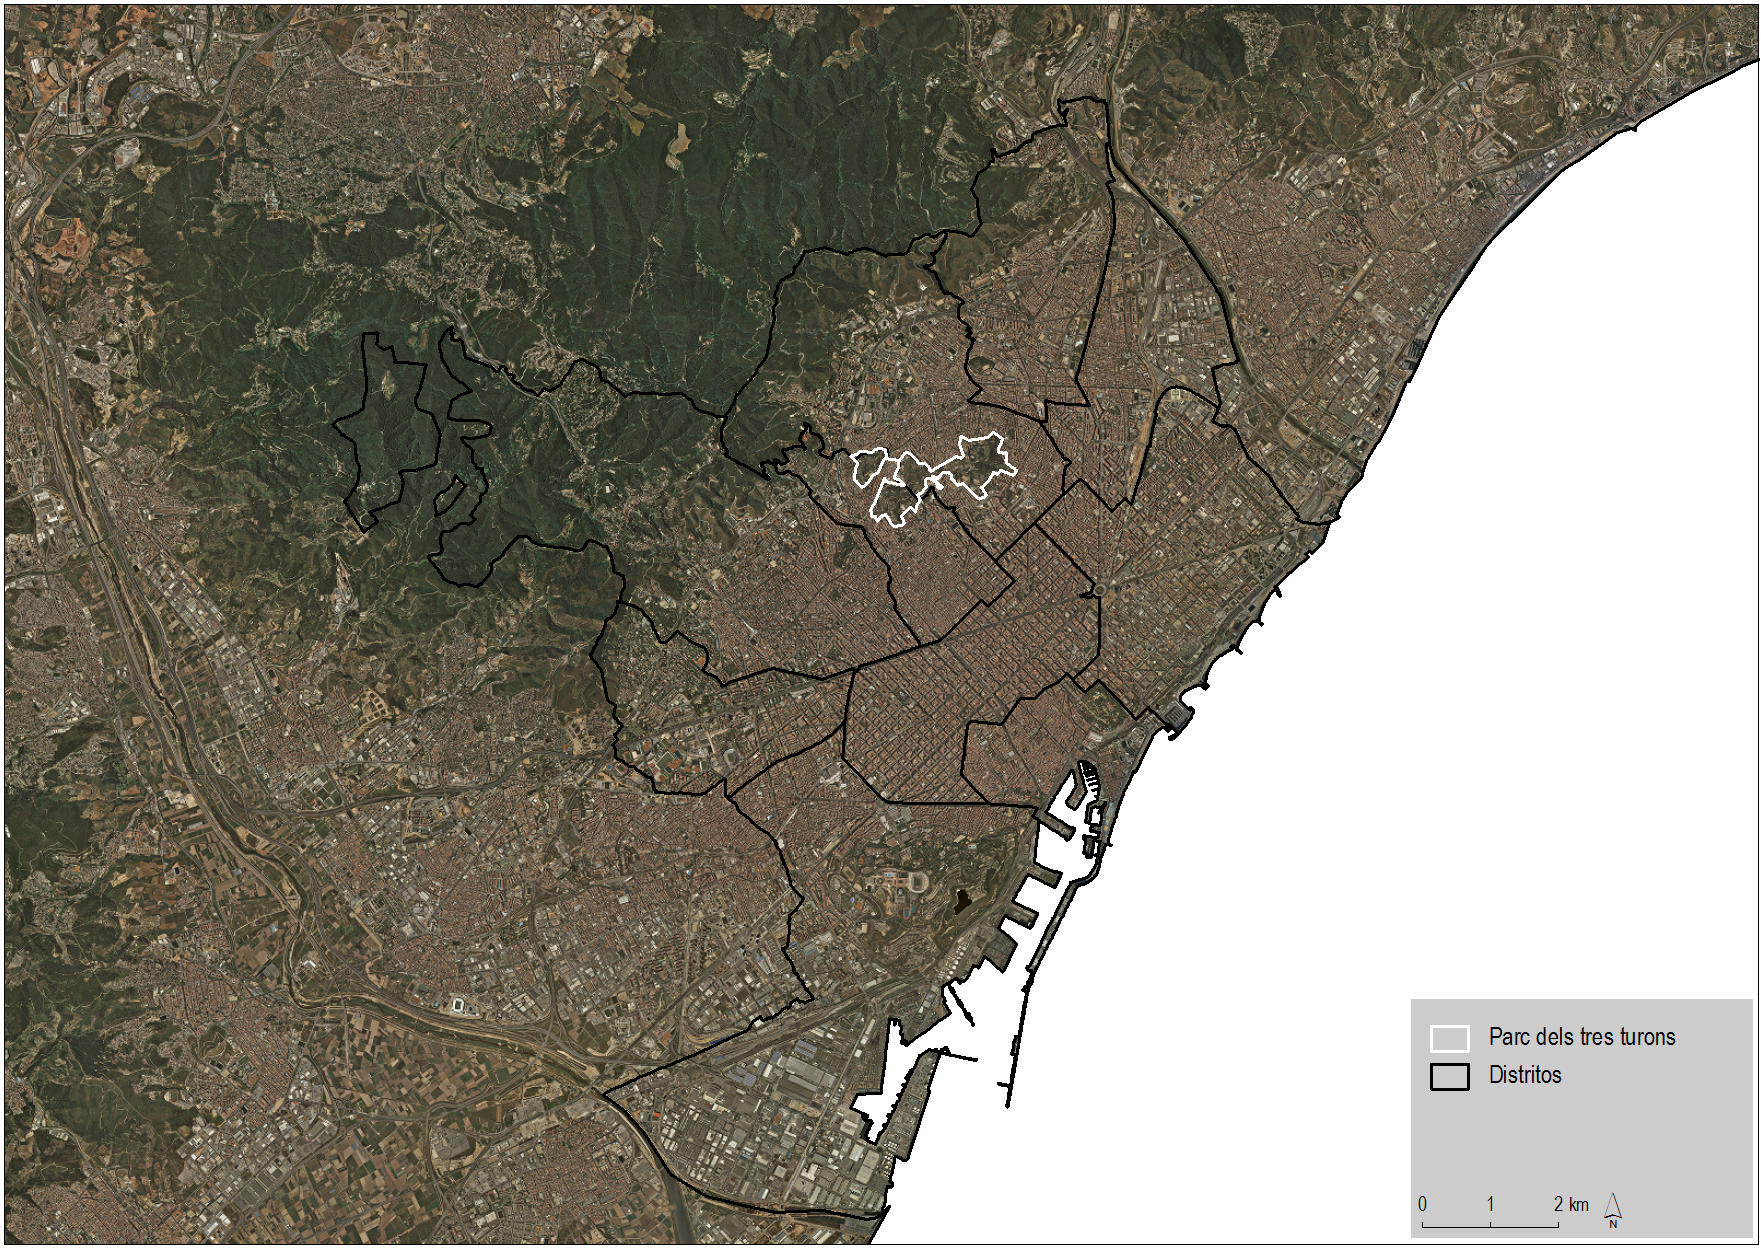
Figure 1: Location of the Parc dels Tres Turons (Three Hills Park) in the city of Barcelona8) (enlarge this figure here) [21]
In 1976, at the end of the dictatorship, a general metropolitan plan that is still in force today confirmed the classification of Tres Turons as a green area but left it once more pending a plan for conversion into a park. All dwellings that had been built up to that time were now threatened with expropriation. This situation lasted for decades, until in 2000 the City Council launched the definitive plan to convert Tres Turons into a green lung for the city. However, the Pla del Parc dels Tres Turons was opposed right from the start by a large proportion of the affected residents. [22]
Initially, this plan involved the expropriation and demolition of over 800 houses that had been inhabited for decades. The neighborhood organizations rejected this proposal and called for a mixed park that conserved the existing homes. After nearly ten years of unsuccessful negotiations, in January 2009 the Council achieved the initial approval of an amendment to the 1976 General Development Plan for Tres Turons. The new development proposal introduced a dual zoning, with a core of green park and a perimeter defined as a transition zone where homes were authorized. This significant change to the existing development plan was aimed at removing the obstacles that had long hindered the project. The new proposal reduced the number of homes expropriated to less than half and satisfied many of the organizations of residents affected by the plan. This final period of reconfiguration of the urban development of Tres Turons was the one considered in our study. [23]
5.2 The social production of urban space as an object of study
The focus of the study was the transformation of urban space, understood as a process of social production. The urban space is seen as a dialectical process resulting from the endless struggle between designers, planners, traders, politicians and users, which is continuously producing changes (LEFEBVRE, 1991 [1974]). That is, "the urban space is not presupposed, something that is there before any human activity breaks into it. It is above all a work, a result [...], a production" (translated from DELGADO, 2004, p.10). Understood in these terms, the object of this study was precisely the process by which urban space is transformed or acquires its forms. [24]
Particular attention is paid to the tensions that arise among the actors involved and how these tensions are transferred to the reconfiguration of the urban planning. We studied the production of conceived space as it is understood by LEFEBVRE (1991 [1974]) in his theory of space. Conceived space is one of the three ways in which space is expressed.9) Unlike the others, this one is abstract: it is an idea, a project, something as yet non-existent that has great power. It is a mental map, or the negotiated space between the economic, social, political and technical actors previous to an urban planning action. [25]
The methodological design of the study was essentially qualitative. It was a case study with ethnographic components (CRESWELL, 2007, pp.68-72, LOFLAND, SNOW, ANDERSON & LOFLAND, 2006) in which, as explained above, we wished to carry out an in-depth analysis of the rezoning of Tres Turons. To address this question in all its complexity we used a multi-method approach based on the integration of different types of qualitative data. [26]
We use the term multi-method to indicate that it involves an integration not of quantitative and qualitative methods but rather of different qualitative methods. We therefore follow the distinction made by TEDDLIE and TASHAKKORI (2003), who refer to multi-method designs as ones that combine the use of more than one technique within either a quantitative or a qualitative framework, whereas mixed-method designs are those that use both quantitative and qualitative techniques or data. [27]
The type of articulation that we carried out cannot be considered triangulation either, because the analysis was based on the complementary nature of the data sets rather than a comparison between them. As several authors have pointed out (HUNTER & BREWER, 2003; ERZBERGER & KELLE, 2003; BRYMAN, 2007), the idea of triangulation is based on the classical (positivistic) theory of measurement and on the objective of improving the validity of the data. In our case we sought to obtain a broader view of the object of study and to articulate it from different angles, with the intention of enriching the interpretation and deepening the analysis (BARBOUR, 1998; FIELDING & FIELDING, 1986). The variety of textures that comes together in the different data sets allows us to explore different dimensions of the phenomenon under study, facilitating and enhancing our understanding by offering a "complete picture." The terms crystallization (RICHARDSON, 2000) or meshing (MASON, 2009; MORAN-ELLIS et al., 2009) are more suitable to describe the design that was used. The idea is that there are many ways to approach a phenomenon in order to address its multiple dimensions. [28]
The analytical corpus obtained (see Figure 2) in the context of this study was made up of the following data types:
Field notes from observation.
In-depth interviews with key actors.
Urban documents and plans.
Photographs.
Press releases.
Documents of formal communication between the actors.
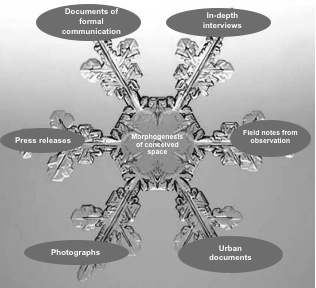
Figure 2: Crystallization of the different types of data regarding the object of study [29]
All this information was managed and analyzed through the qualitative analysis program ATLAS.ti, version 6.0. Considering the diversity of sources, in the qualitative analysis the data were integrated in such a way that each type retained its methodological nature (CRONIN, ALEXANDER, FIELDING, MORAN-ELLIS & THOMAS, 2008). This allowed us to respect the nature of all the data analyzed, so that they could all make an equal contribution to answering the research question. The result was a set of data that overlapped in some areas and not others, thus providing a broader and richer view of the object of study. [30]
5.4 The role of qualitative GIS in the study
Qualitative GIS proved to be a valuable tool because of the predominantly territorial nature of much of the information analyzed and the fact that the object of study was urban space. The advantages of using this tool through ATLAS.ti will be laid out below. Before proceeding, however, we should explain that we did not use a default approach or one suggested by the program. In other words, the operations that we present here provide both a description and a proposal of use of qualitative GIS within ATLAS.ti. LEWINS and SILVER (2007) rightly caution that the flexibility and versatility of ATLAS.ti mean that it can be used in a great variety of ways. Indeed, this flexibility may mislead and even completely discourage new users. One of the objectives of this article is therefore to show a particular form of use that may serve as a suggestion or even help further research. Together with the description, we make an assessment of the benefits of the tasks for studying the production of urban space. Then we describe the use of qualitative GIS, distinguishing three levels of task: information management, conceptual work and graphic presentation.10) [31]
The task of information management was related primarily to two types of data: town planning documents and photographs taken on the ground. In both cases it was decided initially to give some order to the available information in order to facilitate the analysis. Given the highly territorial nature of these data, the most effective means to achieve this order was to localize the information in the territory. This procedure can be described as georeferencing in the terms mentioned in Section 3. [32]
The content of the urban planning documents was as relevant to the study as it was difficult to analyze. Because of its highly technical tone, textual analysis was not very productive. Therefore, we chose to select the most relevant information for the objectives, locating it on the territory (i.e.georeferencing it) through Google Earth. This information was used mainly for two types of operation. [33]
The first operation was to reproduce the boundaries of the urban park or green area proposed by the successive development plans through "polygons," an option of Google Earth that is left active in ATLAS.ti (Figure 3). Moreover, these boundaries were associated as a comment with the most significant fragments of the urban plans and projects (Figure 4).
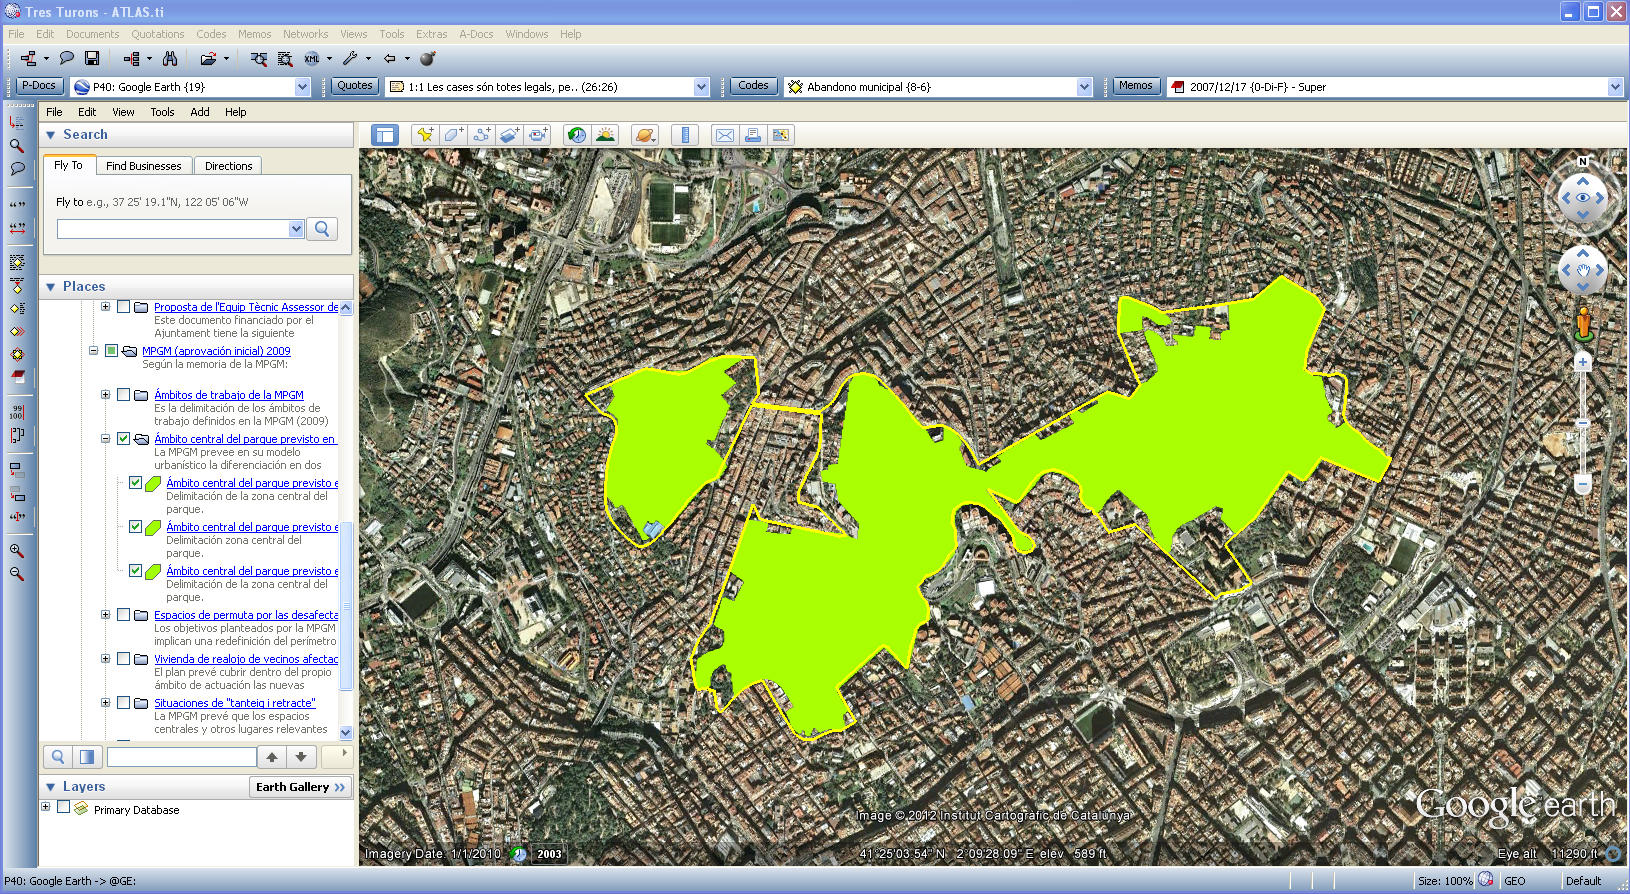
Figure 3: Boundaries of the land classification taken from the planning documents11) (enlarge this figure here)
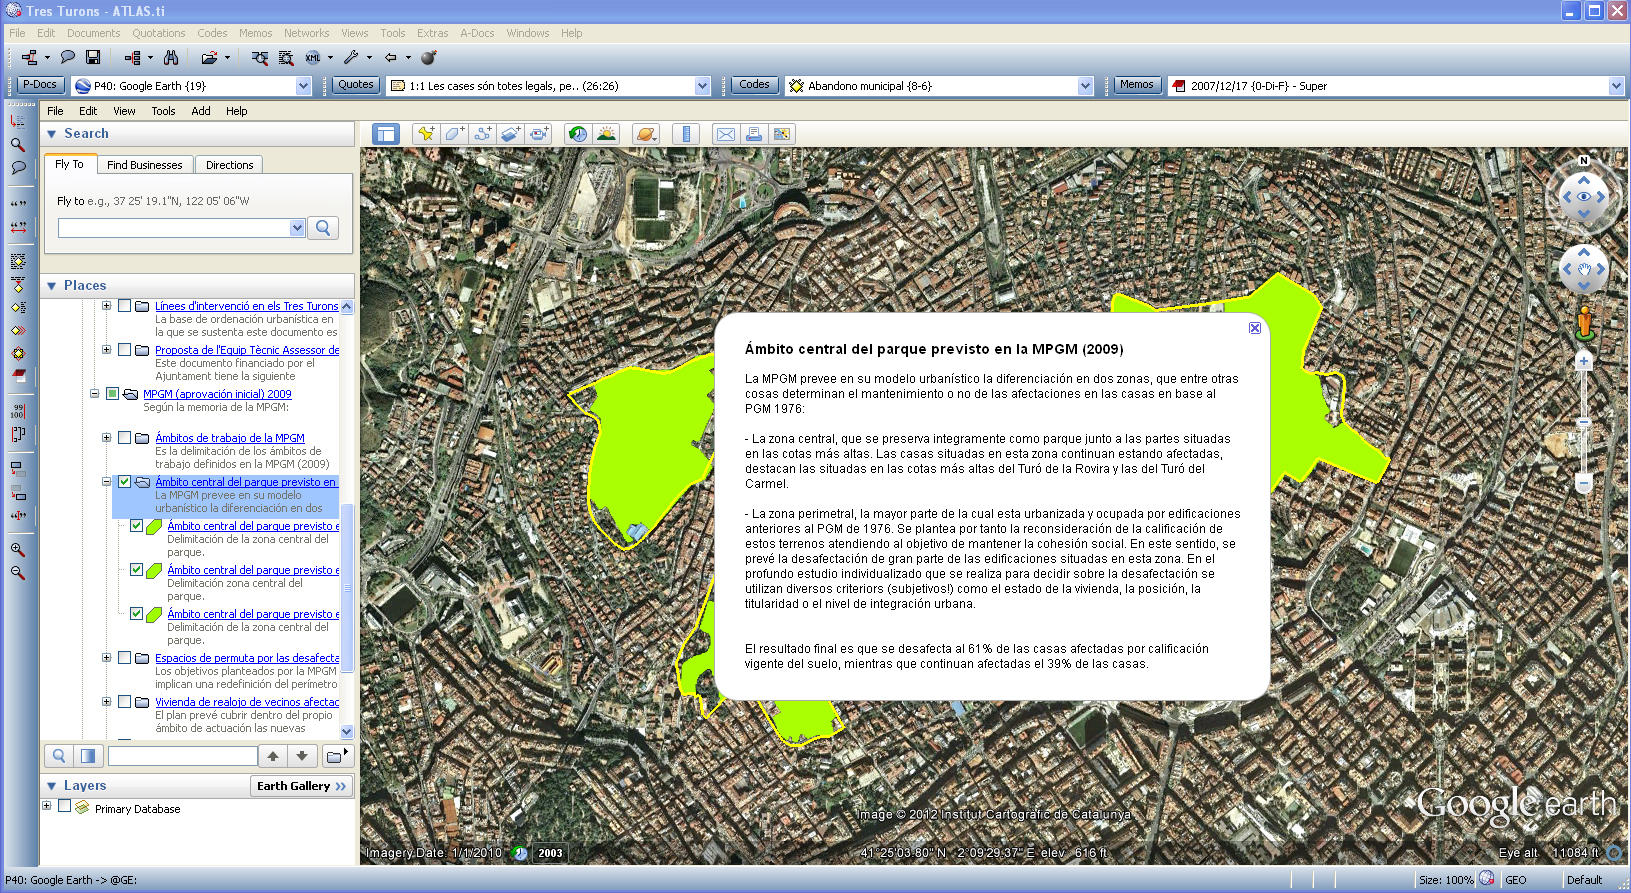
Figure 4: Fragments of the content of the planning documents associated with the proposed boundaries12) (enlarge this figure here) [34]
The second operation was to introduce the more specific information of the planning documents, referring to specific sites in the area (such as the blocks of houses for which the residents were demanding maintenance, the situation of rehousing for affected residents, etc.). This type of information was processed by comments associated with "placemarks," another tool of Google Earth that is left active in ATLAS.ti (Figure 5).
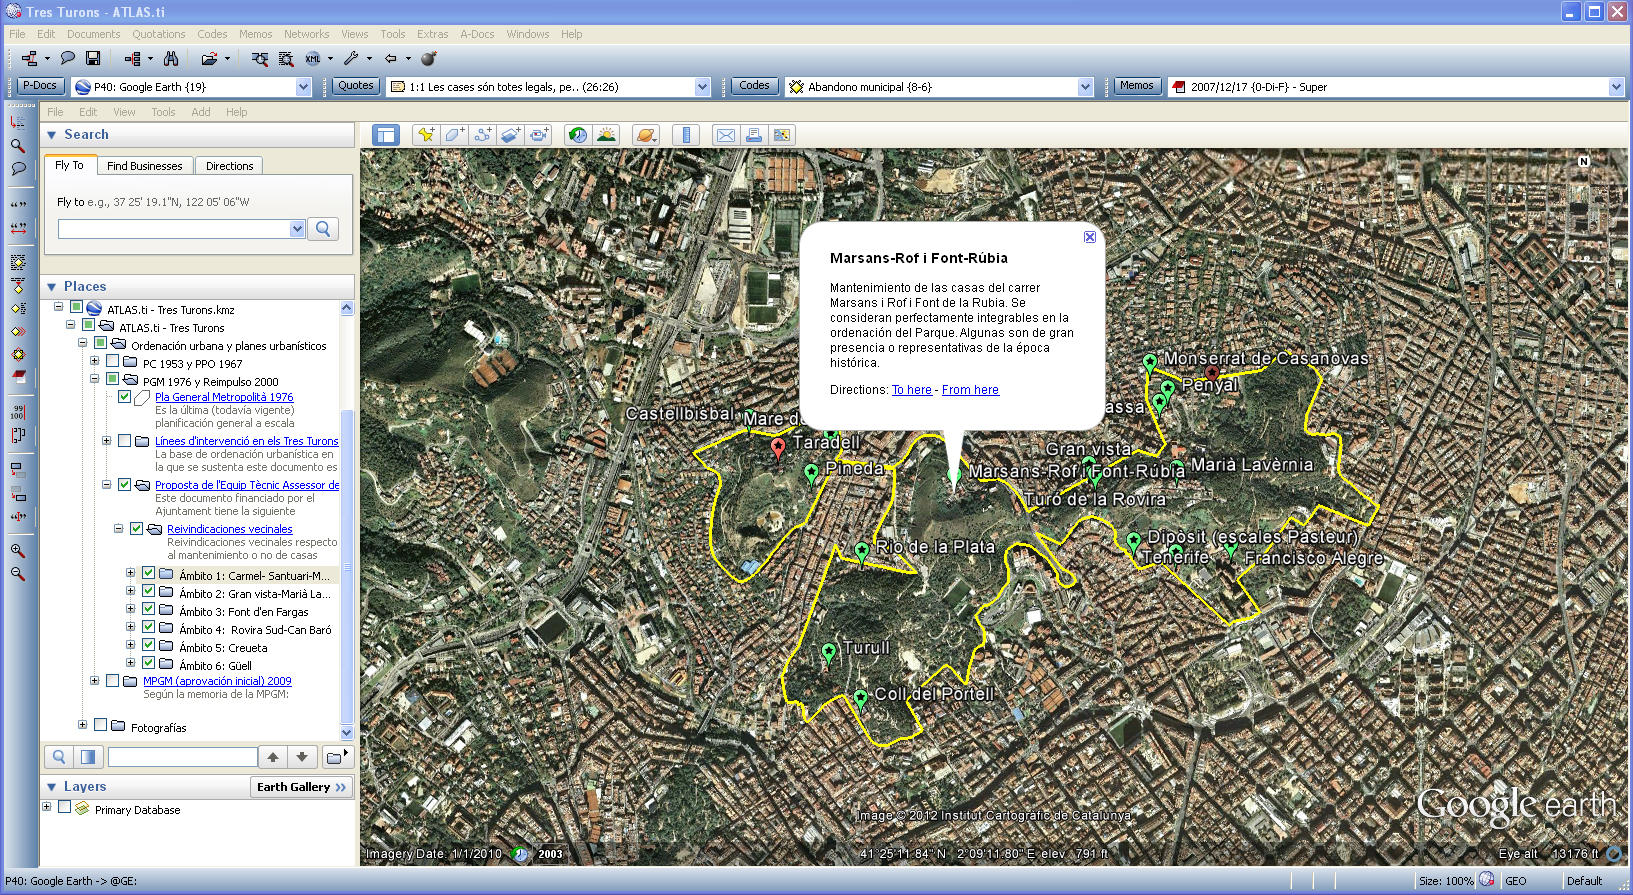
Figure 5: Specific notes on specific locations of the territory taken from the planning documents13) (enlarge this figure here) [35]
With the photographs the procedure used was technically similar to that of the planning documents, though their function was analytically different. Google Earth was used from within ATLAS.ti to embed them directly in the territory in the places where they were taken. This procedure enriches the analysis by relating the information contained in photographs with information from their geographical context. The program also allows you to enter comments on the photographs, which is very useful for adding ethnographic memos (Figures 6 and 7). [36]
Once the information has been georeferenced, it is integrated into Google Earth in layers that can be enabled or disabled by the researcher. These layers are accessible to the right of the screen, so accessing, handling and viewing them is extremely easy (see Figures 3, 4 and 5).

Figure 6: Comment associated with a photo14) (enlarge this figure here)
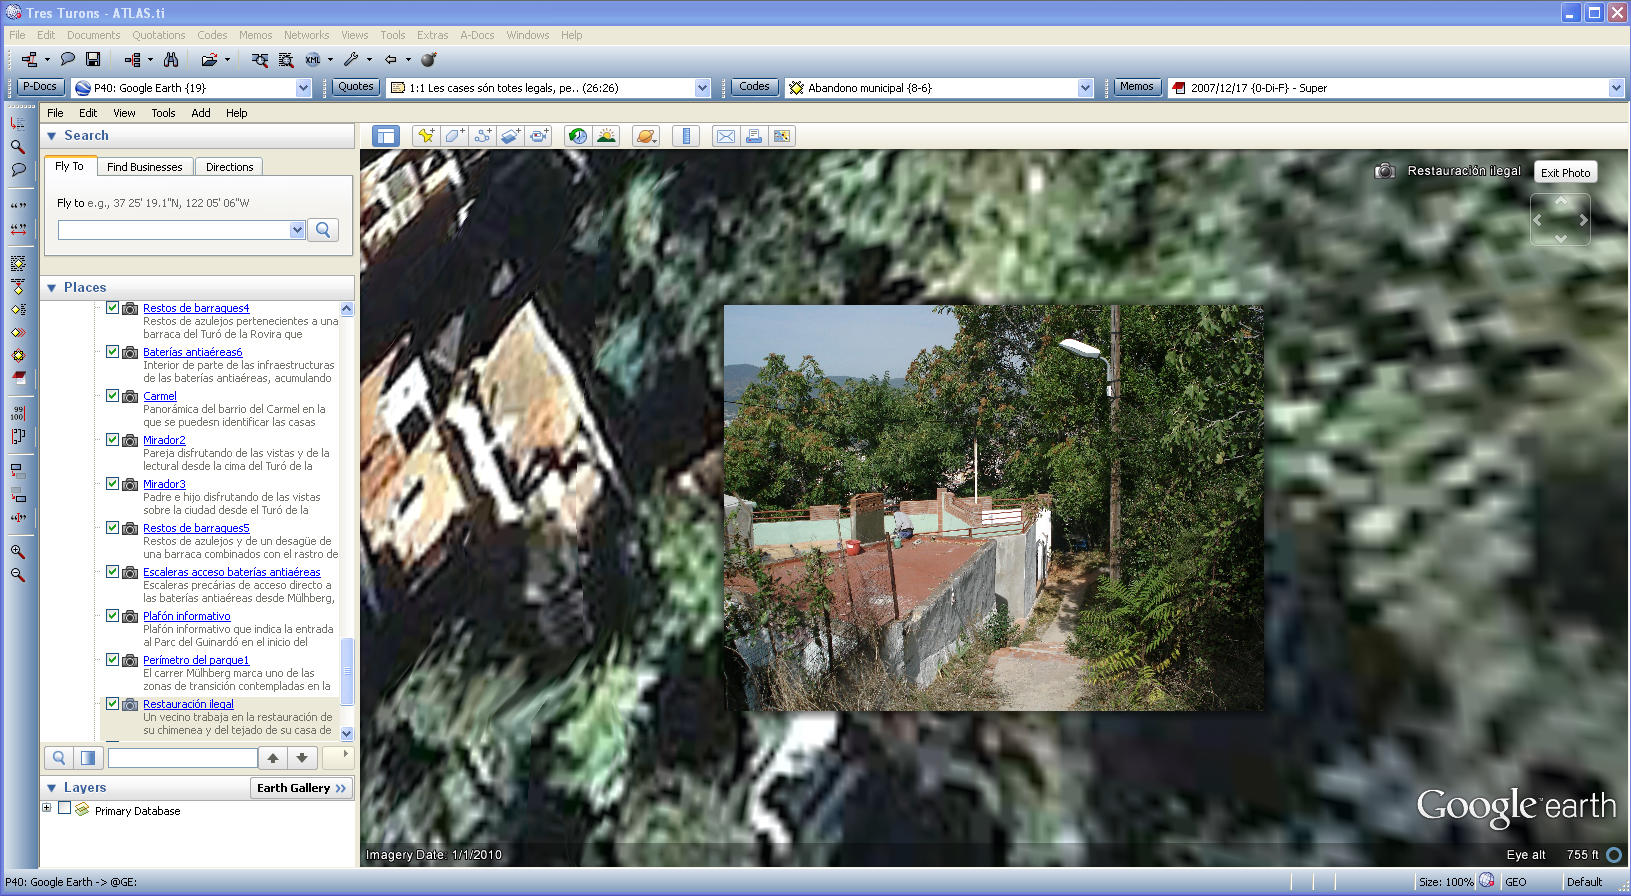
Figure 7: Zoom of a photo localized in the territory15) (enlarge this figure here) [37]
As a result of this set of procedures related to information management, the different types of data remained accessible and easily manageable, and were integrated in the space to which they referred. This technical feature allowed spatial information related to urban planning to be integrated with the current morphology of the urban space. At a methodological level, these processes offered a perfect combination of the ethnographic work—whose most palpable results were the field notes and photographs—with the work based on the collection and analysis of the planning documents. [38]
With respect to the conceptual work, there is a greater integration between GIS and CAQDAS. Qualitative GIS within ATLAS.ti offers two main contributions. First, the combination of the analytical tools of ATLAS.ti and Google Earth allows you to assign codes and memos to "territorial quotations." The codes in particular can emerge from the strict analysis of the territory as a "primary document" and from the analysis of other non-geographical material,16) that is, material strictly linked to textual analysis. Any of the codes generated by ATLAS.ti can be associated with specific points of the territory defined as "territorial quotations" (Figure 8). As discussed in Section 3, this procedure should be referred to as geocoding, as far as geographic information is not used to locate other kinds of data but used as a direct input for analysis. This resource has an analytic function and also serves indirectly to strengthen the integration of the different elements of the corpus analyzed, because the same code or notation can be linked to various types of information.
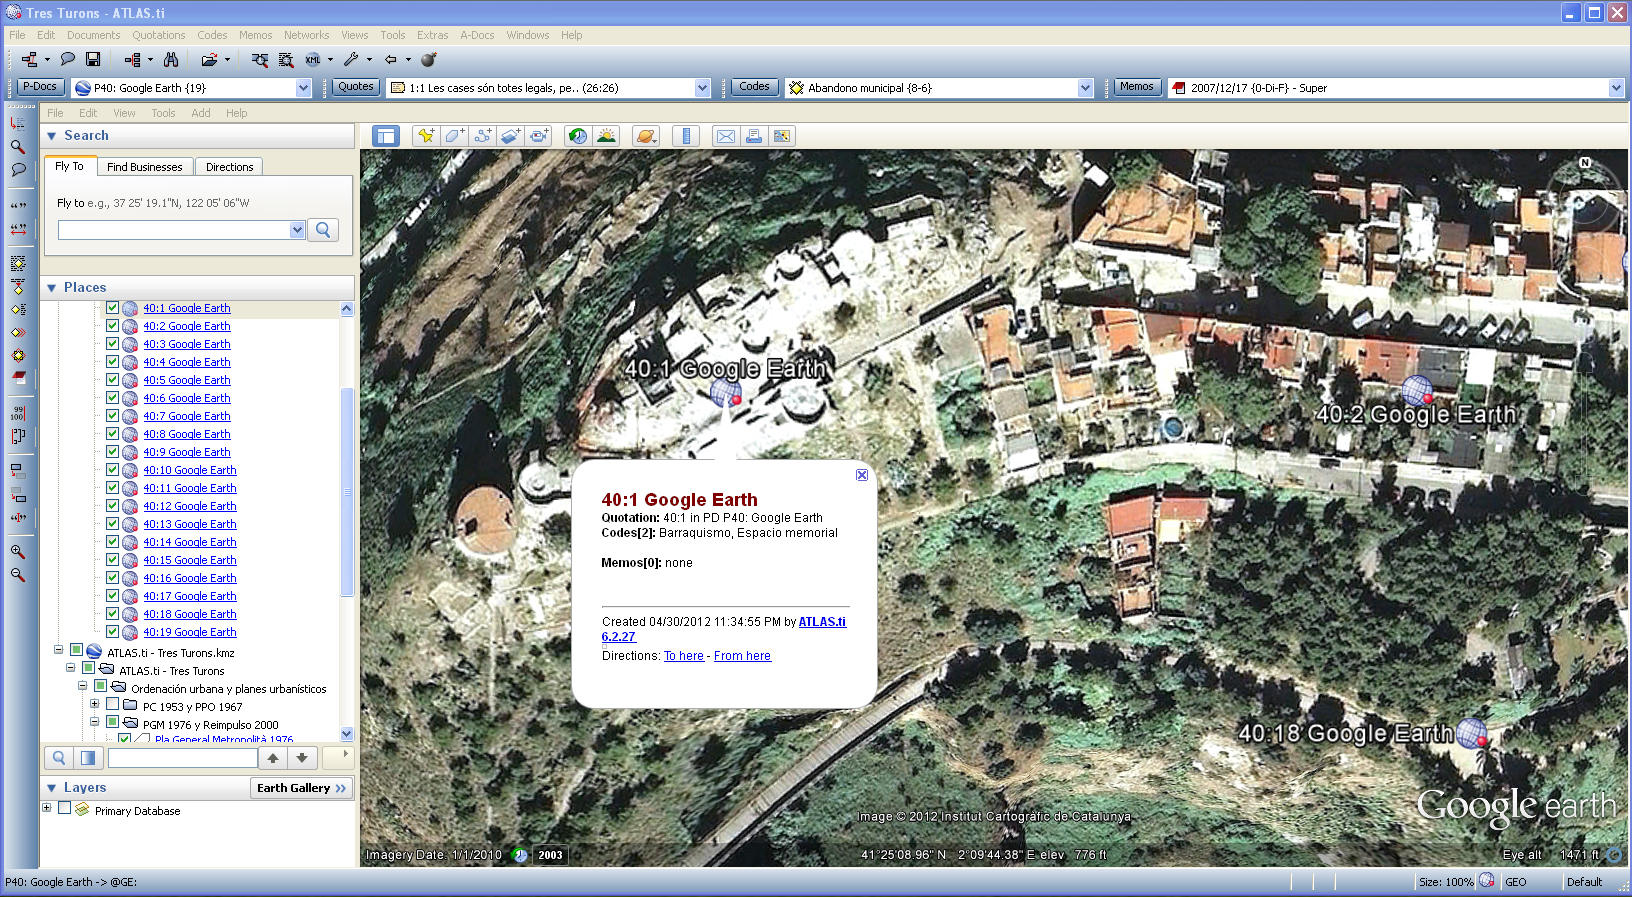
Figure 8: Arrangement of several territorial quotations with assigned codes17) (enlarge this figure here) [39]
Second, the analysis function is more integral, thanks to the capacity of Google Earth within ATLAS.ti to display all the information analyzed, distributed on the map of the urban area studied. The synthesized display and the easy access to the information help to validate interpretations and suggest new ones. This provides the researcher with great analytical sensitivity rooted in the territory during the data processing, which is highly fruitful for achieving the objectives. [40]
The graphic presentations offered by ATLAS.ti in combination with Google Earth are perhaps the most limited feature of the program. ATLAS.ti does not allow users to create their own maps but only provides aerial photos taken from Google Earth. These include the selected georeferenced and/or geocoded information but do not offer the possibility of adding descriptive captions to explain the symbols inserted into the map. The aerial photos are evocative and visually stimulating, and help to make some approaches of the research report more understandable. However, it would be desirable to include a mechanism offering greater cartographic quality and increasing the analytical and explanatory power of the graphic presentations. One possibility for obtaining better graphic features is to export the KMZ file generated by Google Earth to ArcGIS, with all the elements worked on in ATLAS.ti. This was done in the example shown in Figure 9.18)
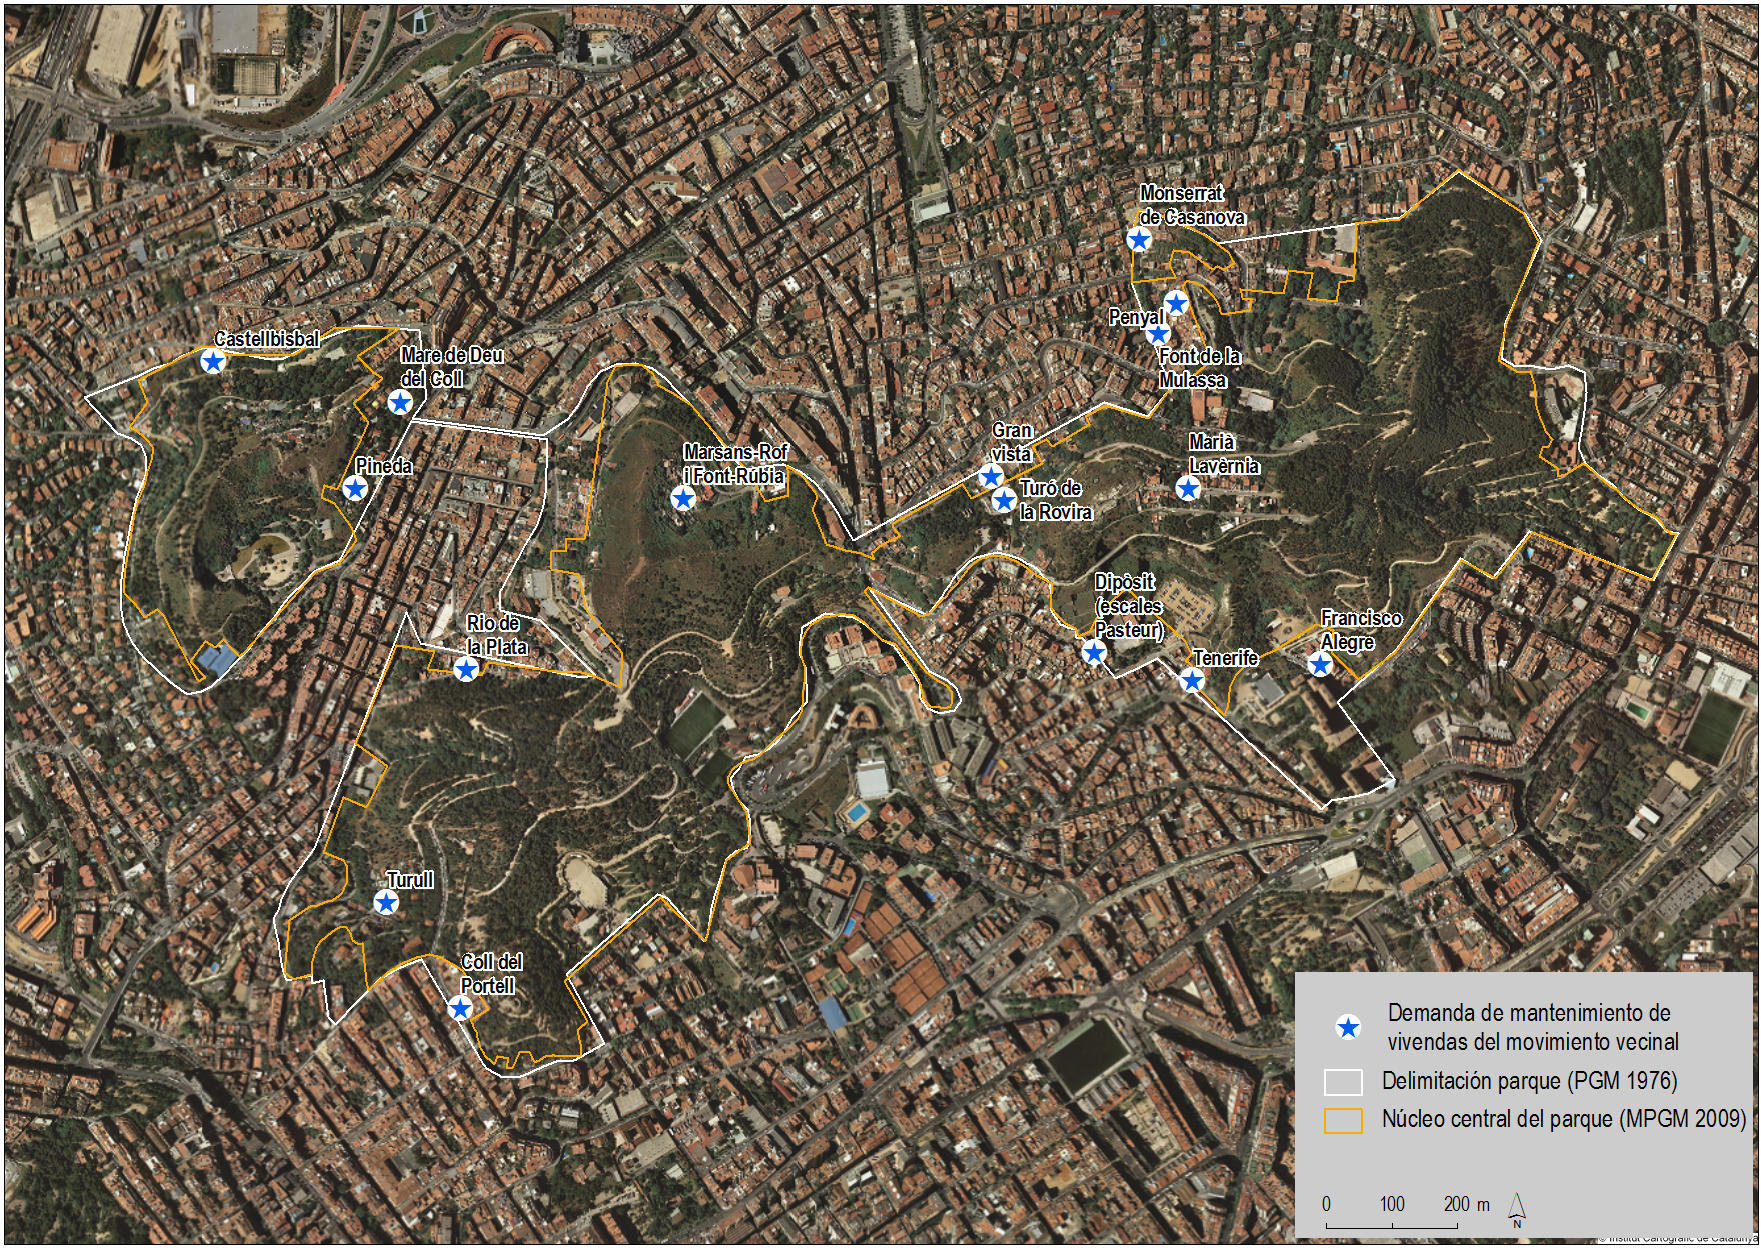
Figure 9: Residents' demands for exemption from expropriation of houses that were met in the amendment to the General Metropolitan
Plan of 1976 with regard to the Tres Turons area19) (enlarge this figure here) [41]
Therefore, an alternative is to continue working in specific GIS programs (such as ArcGIS) on the basis of the analysis carried out in the CAQDAS program. Doing so even increases the options of analysis and methodological integration. However, CAQDAS programs should continue to develop and refine the performance of qualitative GIS in their environment. [42]
The kind of use of Google Earth within ATLAS.ti we have made allows us to draw a set of conclusions on the potential of qualitative GIS for urban sociology in particular and sociology in general. [43]
From a purely technical standpoint, Google Earth tools are well integrated with the other tools of ATLAS.ti. The standard functions of creating quotations, codes and memos are fully functional on the aerial photos provided by Google Earth, and on the other hand, Google Earth remains fully active in the environment of ATLAS.ti. Furthermore, the program offers the same capacity to create hyperlinks between the different types of qualitative material supported by the program (textual, graphic and audiovisual materials) as that offered in current means of geographic presentation. It therefore improves on the initial potential of ATLAS.ti for integrating data of various kinds. [44]
However, the most notable limitation of this resource within ATLAS.ti is the graphic presentation and outputs that it offers. Users cannot create their own maps, a feature that could be useful and add value to the analysis. In fact, this is a great difference from quantitative GIS, which have extensive mapping capabilities. It is true that quantitative data are better suited to representation in map form than qualitative data, but this is the most important challenge for qualitative GIS at present. [45]
From a methodological standpoint, the integration of qualitative GIS in CAQDAS played a key role in our study on urban transformation as far as the territory was the unifying framework for a variety of information, facilitating implementation of the multi-method design. Using complex and diverse information and through the application of the functions of qualitative GIS, we finally achieved an extremely simple data management. We obtained wide access to the different types of information, integrated throughout the territory, which made the analysis more flexible. [46]
From an epistemological standpoint, the inclusion of GIS in qualitative analysis programs is a definite improvement for qualitative approaches in the social sciences, and particularly in the field of urban studies. As stated in this article, both georeferencing and geocoding involve developing an analytical vision that is anchored in the territory, a feature that is especially important in the study of socio-spatial phenomena. Undoubtedly, this technological breakthrough helps to reinforce the qualitative approach in urban sociology, providing clarity, transparency and consistency in the analysis of socio-spatial information. [47]
Going beyond urban sociology, the incorporation of GIS in qualitative analysis programs will foster the development of a sociology that is more sensitive to the spatial dimension of social phenomena. Although it is not always evident in the research design, all social activities have a territorial nature: they are embedded in a given space that is socially and sociologically significant. Therefore, the incorporation of the territory as data, or simply the referencing on the territory of the material being analyzed, can help to develop what MASON (2009) called contextual explanations, understood as those in which an effort is made to show that all social activity is always localized. MASON links this type of explanation to studies in which the design allows one to "think qualitatively," which does not necessarily mean purely qualitative designs. In fact, she states that mixed designs are the ones that most clearly encourage "thinking qualitatively." The aim is ultimately to introduce a clearly multidimensional approach to sociological analysis. However, at a technological level, a further development of CAQDAS is pending in order to offer better integration of quantitative and qualitative materials in the same environment. Meanwhile, there is no doubt that the qualitative use of geographic information systems is a step forward. [48]
We would like to thank César CISNEROS and the Boğaziçi University for their splendid work in the organization of the Conference "Qualitative Computing: Diverse Worlds and Research Practices" in Istanbul on 24 to 26 February 2011. This text is a version of the article presented to the Conference.
1) The meaning of these two terms is confusing in the literature. They are rarely used at the same time, possibly because they are taken as synonyms. See, on this question, Sections 3 and 5.4 of this article. <back>
2) See on this question SCHUURMAN (2004). <back>
3) KML and KMZ are the file formats used to display geographic data in Google Earth. <back>
4) In our case, we used this possibility to make the maps in Figures 1 and 9. <back>
5) This possibility of georeferencing existed before the incorporation of qualitative GIS in CAQDAS programs. Many authors had developed it using commercially available programs for presenting and analyzing geographic information. <back>
6) A thorough reflection about this theoretical strand can be found in ZUKIN (1980) and WALTON (1981). <back>
7) In Catalan, turó means "hill." <back>
8) Our elaboration using ATLAS.ti 6.0 and ArcGIS on the basis of the ortophoto image of Catalonia 1:5.000 from the Institut Cartogràfic de Catalunya. <back>
9) According to LEFEBVRE (1991 [1974]) space occurs simultaneously in three forms: as perceived space (at a physical level), conceived space (at a cognitive or mental level), and lived space (at a social level). <back>
10) The differentiation between these three tasks is partly based on the distinction made by the manuals of ATLAS.ti (MUHR, 1997, 2004) between work at the textual and conceptual level (the latter also includes the task of graphic presentation). <back>
11) Our elaboration using Google Earth and ATLAS.ti 6.0. <back>
12) Our elaboration using Google Earth and ATLAS.ti 6.0. <back>
13) Our elaboration using Google Earth and ATLAS.ti 6.0. <back>
14) Our elaboration using Google Earth and ATLAS.ti 6.0. <back>
15) Our elaboration using Google Earth and ATLAS.ti 6.0. <back>
16) In this case, from the content analysis conducted on the in-depth interviews, the formal communication documents, the press reports and the field notes. <back>
17) Our elaboration using Google Earth and ATLAS.ti 6.0. <back>
18) And also in Figure 1. <back>
19) Our elaboration using ATLAS.ti 6.0 and ArcGIS on the basis of the ortophoto image of Catalonia 1:5.000 from the Institut Cartogràfic de Catalunya. <back>
Aitken, Stuart C. & Craine, Jim (2009). Into the image and beyond: Affective visual geographies and GIScience. In Meghan Cope & Sarah Elwood (Eds.), Qualitative GIS. A mixed methods approach (pp.139-155). London: Sage.
Azpurúa, Fernando (2005). La Escuela de Chicago. Sus aportaciones para la investigación en las ciencias sociales. SAPIENS: Revista Universitaria de Investigación, 2, 25-36.
Barbour, Rosaline (1998). Mixing qualitative methods: Qualitative assurance or qualitative quagmire? Qualitative Health Research, 8, 352-361.
Berry, Brian & Kasarda, John (1977). Contemporary urban ecology. New York: Macmillan.
Bou, Lluís & Gimeno, Eva (2007). El Carmel ignorat: Història d'un barri imposible. Barcelona: Ajuntament de Barcelona & Agència de Promoció del Carmel i Entorns.
Bryman, Alan (2007). Barriers to integrating quantitative and qualitative research. Journal of Mixed Methods Research, 1(1), 8-22.
Castells, Manuel (1971). Problemas de investigación en sociología urbana. Madrid: Siglo XXI.
Castells, Manuel (1976). Is there an urban sociology? In Chris Pickvance (Ed.), Urban sociology: Critical essays (pp.33-59). London: Tavistock Publications.
Castells, Manuel (2004 [1972]). La cuestión urbana. Madrid: Siglo XXI.
Cope, Meghan & Elwood, Sarah (Eds.) (2009). Qualitative GIS. A mixed methods approach. London: Sage.
Creswell, John (2007). Qualitative inquiry and research design: Choosing among five approaches. Thousand Oaks, CA: Sage.
Cronin, Anne; Alexander, Victoria; Fielding, Jane; Moran-Ellis, Jo & Thomas, Hilary (2008). The analytic integration of qualitative data sources. In Pertti Alasuutari, Leonard Bickman & Julia Brannen (Eds.), The SAGE handbook of social research methods (pp.572-584). Thousand Oaks, CA: Sage.
Delgado, Manuel (2004). De la ciudad concebida a la ciudad practicada. Archipiélago: Cuadernos de crítica de la cultura, 62, 7-12.
della Pergola, Giuliano (1973). La conflictualidad urbana. Barcelona: Dopesa.
Erzberger, Christian & Kelle, Udo (2003). Making inferences in mixed methods: The rules of integration. In Abbas Tashakkori & Charles Teddlie (Eds.), Handbook of mixed methods in social and behavioral research (pp.457-488). Thousand Oaks, CA: Sage.
Fabre, Jaume & Huertas Clavería, Josep M. (1976). Tots els barris de Barcelona vol. IV: Els Tres Turons i els barris de Montjuïc. Can Baró, el Carmel, el Coll, el Poble Sec, Montjuïc i els seus barris (Can Clos, Can Tunis, Magòria, Port, SEAT, el Polvorí). Barcelona: Edicions 62.
Fielding, Nigel (2005). The resurgence, legitimation and institutionalization of qualitative methods. Forum Qualitative Sozialforschung / Forum: Qualitative Social Research, 6(2), Art. 32, http://nbn-resolving.de/urn:nbn:de:0114-fqs0502324 [Date of access: June 15, 2011].
Fielding, Nigel & Cisneros, Cesar (2009). CAQDAS-GIS convergence: Toward a new integrated mixed research practice? Journal of Mixed Methods Research, 3(4), 349-370.
Fielding, Nigel & Fielding, Jane (1986). Linking data. Beverly Hills: Sage.
Gans, Herbert J. (1982 [1962]). The urban villagers: Group and social class in the life of Italo-Americans. New York: Free Press.
Goodchild, Michael; Anselin, Luc; Appelbaum, Richard & Harthorn, Barbara (2000). Toward spatially integrated social science. International Regional Science Review, 23(2), 139-159.
Hannerz, Ulf (2004 [1969]). Soul side: Inquiries into the ghetto culture and community. Chicago: The University of Chicago Press.
Hunter, Albert & Brewer, John (2003). Multimethod research in sociology. In Abbas Tashakkori & Charles Teddlie (Eds.), Handbook of mixed methods in social and behavioral research (pp.577-594). Thousand Oaks, CA: Sage.
Jacobs, Jane M. (1993). The city unbound: Qualitative approaches to the city. Urban Studies, 30(4-5), 827-848.
Joseph, Isaac (1988). El transeúnte y el espacio urbano: Ensayo sobre la dispersión del espacio público. Buenos Aires: Gedisa.
Jung, Jin-Kyu (2009). Computer-aided qualitative GIS: A software-level integration of qualitative research and GIS. In Meghan Cope & Sarah Elwood (Eds.), Qualitative GIS. A mixed methods approach (pp.115-135). London: Sage.
Kelle, Udo (1995). Introduction: An overview of computer-aided methods in qualitative research. In Udo Kelle (Ed.), Computer-aided qualitative data analysis: Theory, methods and practice (pp.1-17). London: Sage.
Knigge, LaDona & Cope, Meghan (2006). Grounded visualization: Integrating the analysis of qualitative and quantitative data through grounded theory and visualization. Environment and Planning A, 38, 2021-2037.
Knigge, LaDona & Cope, Meghan (2009). Grounded visualization and scale: A recursive analysis of community spaces. In Meghan Cope & Sarah Elwood (Eds.), Qualitative GIS. A mixed methods approach (pp.95-114). London: Sage.
Kwan, Mei-Po (2002). Feminist visualization: Re-envisioning GIS as a method in feminist geographic research. Annals of the Association of American Geographers, 92(4), 645-661.
Lefebvre, Henri (1991 [1974]). The production of space. Oxford: Blackwell Publishers.
Lewins, Ann & Silver, Christina (2007). Using software in qualitative research. A step-by-step guide. London: Sage.
Lofland, Lyn H. (1998). The public realm: Exploring the city's quintessential social territory. New York: Aldine Gruyter.
Lofland, John; Snow, David A.; Anderson, Leon & Lofland, Lyn H. (2006). Analyzing social settings. A guide to qualitative observation and analysis. Belmont,CA: Wadsworth.
Longley, Paul; Goodchild, Michael; Maguire, David & Rhind, David (2005). Geographic information systems and science. Chichester: Wiley.
Mason, Jennifer (2009). Mixing methods in a qualitatively driven way. Qualitative Research, 6(1), 9-25.
Matthews, Stephen; Detwiler, James & Burton, Linda (2005). Geo-ethnography: Coupling geographic information analysis techniques with ethnographic methods in urban research. Cartographica: The International Journal for Geographic Information and Geovisualization, 40(4), 75-90.
McLafferty, Sara (2002). Mapping women's worlds: Knowledge, power and the bounds of GIS. Gender, Place and Culture, 9, 263-269.
Miller, Roger (1995). Beyond method, beyond ethics: Integrating social theory into GIS and GIS into social theory. Cartography and Geographic Information Systems, 22 (1), 98-103.
Moran-Ellis, Jo; Alexander, Victoria D.; Cronin, Ann; Dickinson, Mary; Fielding, Jane; Sleney, Judith & Thomas, Hilary (2009). Triangulation and integration: Processes, claims and implications. Qualitative Research, 6(1), 45-59.
Muhr, Thomas (1997). ATLAS.ti short user's manual. Berlin: Scientific Software Development.
Muhr, Thomas (2004). ATLAS.ti 5.0. User's guide and reference. Berlin: Scientific Software Development.
Nightingale, Andrea (2003). A feminist in the forest: Situated knowledge's and mixing methods in natural resource management. ACME: An International E-Journal for Critical Geographies, 2(1), 77-90.
O'Sullivan, David (2006). Geographical information science: Critical GIS. Progress in Human Geography, 30(6), 783-791.
Park, Robert E. (1984 [1925]). The city: Suggestions for the investigation of human behavior in the urban environment. In Robert E. Park, Ernest W. Burgess & Morris Janowitz (Eds.), The city: Suggestions for the investigation of human behavior in the urban environment (pp.1-46). Chicago: The University of Chicago Press.
Pavlovskaya, Marianna (2002). Mapping urban change and changing GIS: Other views of economic restructuring. Gender, Place and Culture, 9(3), 281-289.
Pickles, John (1995). Representations in an electronic age: Geography, GIS and democracy. In John Pickles (Ed.), Ground truth: The social implications of geographic information systems (pp.1-30). New York: The Guilford Press.
Richards, Lyn (2005). Handling qualitative data. A practical guide. London: Sage.
Richardson, Laurel (2000). New writing practices in qualitative research. Sociology of Sports Journal, 17, 5-20.
Sampson, Robert; Morenoff, Jeffrey & Earls, Felton (1999). Beyond social capital: Spatial dynamics of collective efficacy for children. American Sociological Review, 64(5), 633-660.
Saunders, Peter (1981). Social theory and the urban question. London: Unwin Hyman.
Schuurman, Nadine (2004). GIS: A short introduction. Oxford: Blackwell Publishing.
Sheppard, Eric (1995). GIS and society: Towards a research agenda. Cartography and Geographic Information Science, 22(1), 5-16.
Sheppard, Eric (2005). Knowledge production through critical GIS: Genealogy and prospect. Cartographica: The International Journal for Geographic Information and Geovisualization, 40(4), 5-21.
Shevky, Eshref & Bell, Wendell (1955). Social area analysis: Theory, illustrative application and computational procedures. Stanford: Stanford University Press.
Skinner, Debra; Matthews, Stephen & Burton, Linda (2005). Combining ethnography and GIS technology to examine constructions of developmental opportunities in contexts of poverty and disability. In Thomas Weisner (Ed.), Discovering successful pathways in children's development: Mixed methods in the study of childhood and family life (pp.223-239). Chicago: The University of Chicago Press.
Suttles, Gerald (1968). The social order of the slum: Ethnicity and territory in the inner city. Chicago: The University of Chicago Press.
Teddlie, Charles & Tashakkori, Abbas (2003). Major issues and controversies in the use of mixed methods in the social and behavioral sciences. In Abbas Tashakkori & Charles Teddlie (Eds.), Handbook of mixed methods in social and behavioral research (pp.671-701). Thousand Oaks, CA: Sage.
Walton, John (1981). The new urban sociology. International Social Science Journal, 33, 374-390.
Wirth, Louis (1938). Urbanism as a way of life. The American Journal of Sociology, 44(1), 1-24.
Zukin, Sharon (1980). A decade of the new urban sociology. Theory & Society, 9, 575-601.
Joan Miquel VERD is associate professor and researcher at the Department of Sociology of the Universitat Autònoma de Barcelona (UAB). He is member of the Centre d'Estudis Sociològics sobre la Vida Quotidiana i el Treball (QUIT) and the Institut d'Estudis del Treball (IET). His research interests include sociology of labor, social network analysis, narrative and life-course analysis, and qualitative text analysis in general.
Contact:
Joan Miquel Verd
Department of Sociology
Facultat de Ciències Polítiques i Sociologia
Campus Universitat Autònoma de Barcelona. Edifici B
08193 Cerdanyola del Vallés (Barcelona)
Spain
Tel.: +34 93 581 24 04
Fax: +34 93 581 24 05
E-mail: joanmiquel.verd@uab.cat
Sergio PORCEL is researcher at the Institut d'Estudis Regionals i Metropolitans de Barcelona (IERMB). He is currently a PhD candidate in Sociology, Universitat Autònoma de Barcelona (UAB). The research areas that most interest him are the social production of urban space, socio-spatial phenomena, youth transitions and social research methods.
Contact:
Sergio Porcel
Institut d'Estudis Regionals i Metropolitans de Barcelona
Campus Universitat Autònoma de Barcelona.
Plaça Nord, edifici MRA, planta 2
08193 Cerdanyola del Vallés (Barcelona)
Spain
Tel.: +34 93 586 88 64
Fax: +34 93 581 44 33
E-mail: sergio.porcel@uab.cat
Verd, Joan Miquel & Porcel, Sergio (2012). An Application of Qualitative Geographic Information Systems (GIS) in the Field
of Urban Sociology Using ATLAS.ti: Uses and Reflections [48 paragraphs]. Forum Qualitative Sozialforschung / Forum: Qualitative Social Research, 13(2), Art. 14,
http://nbn-resolving.de/urn:nbn:de:0114-fqs1202144.

Creative Commons Attribution 4.0 International License