Volume 14, No. 2, Art. 3 – May 2013
Using CAQDAS in the Analysis of Foundation Trust Hospitals in the National Health Service: Mustard Seed Searches as an Aid to Analytic Efficiency
Paul G. Dempster, David Woods & John S.F. Wright
Abstract: This article reflects on the development of Computer Assisted Qualitative Data Analysis Software (CAQDAS) briefly before describing how the software can be harnessed to aid the process of research. It shows how data from a multi-user project looking at governance in UK Foundation Trust hospitals was enhanced and made clearer through the application of a specific method of gathering and coding data using a qualitative data analysis software package: Applying searches based on word frequency counts within NVivo 8 provided an initial categorisation of topics in an efficient manner allowing for a targeted examination of the overall data. This technique has been called by us the Mustard seed approach as it starts small and builds into something bigger over time.
Key words: coding; qualitative methods; CAQDAS; qualitative software; word frequency
Table of Contents
1. Introduction
2. CAQDAS: History and Development
2.1 The KWALON experiment
2.2 CAQDAS' supporting role in complex research
2.3 Keyword search strategies
2.4 How we used NVivo 8 word frequency counts to generate keywords, categories and codes
3. The Research: Contextualising Foundation Trust Hospitals
3.1 Finding categories from within the text
4. Using CAQDAS Software: The Mustard Seed Approach
4.1 The Mustard seed approach in detail
4.2 Mustard seed: The phases involved
4.2.1 Alignment
4.2.2 Loading transcripts into the software
4.2.3 Organising the data
4.2.4 Creating searches
4.2.5 Sorting the data
4.2.6 Splitting the data into analytically interesting pieces
5. Example of the Mustard Seed Search
6. Conclusion
This article shows how data from a multi-user project looking at governance in Foundation Trust hospitals in the UK was enhanced and made clearer through the application of a specific method of gathering and coding data using a qualitative data analysis software package. In this case, searches of word frequency counts within NVivo 8 were used to provide the initial categorisation of topics (and topic headings) in an efficient manner which allowed for targeted examination of the overall data. New developments in NVivo 8 have made this approach possible, in ways that whilst achievable, were slower and more involved in the past. [1]
We recognise that techniques using Computer Assisted Qualitative Data Analysis Software (CAQDAS) are often not as clearly documented as we would wish. For example the report and papers published from this research project provide only the scantest mention of the methods employed (ALLEN et al., 2010, 2012a, 2012b; WRIGHT, DEMPSTER, KEEN, ALLEN & HUTCHINGS, 2012, forthcoming). This article tries to address this balance and seeks to encourage others to share methods and ways of working which will promote wider use and discussion of CAQDAS methods. [2]
In Section 2 we briefly explore the history and development of CAQDAS before turning to the more recent KWALON experiment, which gave the same dataset to a number of software manufacturers and developers. The experiment found that there were considerable similarities amongst the software packages. However researchers have begun to appropriate new ways of using digital tools, finding "clever solutions" to research problems. The development of CAQDAS has been intertwined with the rise of more powerful personal computers, which allow more sophisticated analysis of data, through tools such as searching and autocoding. Keyword searching has a distinguished pedigree within qualitative research and a new tool within NVivo 8 can be appropriated by researchers to utilise word frequency counts allowing analysis of large amounts of data quickly. [3]
Section 3 provides an overview of a research project based in the UK which looked at governance within newly formed Foundation Trust Hospitals within the National Health Service. The data from this project was analysed using a new keyword search which we have termed the Mustard seed approach, as it starts small and builds into something big. [4]
We provide a detailed outline in Section 4 of the Mustard seed approach along with a breakdown of the phases employed. We explore aligning the data, loading the data, organising the data, creating searches, sorting the data, and splitting it into analytically interesting pieces. Finally the article provides a detailed example of the search. [5]
2. CAQDAS: History and Development
There is a group of software products which Nigel FIELDING and Raymond LEE (1991) called CAQDAS, "Computer Aided Qualitative Data Analysis Software". This phrase continued to be used when referring to software (FIELDING & LEE, 1998, 2002; GIBBS, 2002; GIBBS, FRIESE & MANGABEIRA, 2002; JOHNSTON, 2006; KELLE, 1995, 2007; KELLE & LAURIE, 1995; OHLBRECHT, 2004; Tom RICHARDS, 2002; Lyn RICHARDS, 2002, 2005; RICHARDS & RICHARDS, 1995; WEITZMAN, 2000; see also http://onlineqda.hud.ac.uk/index.php and http://www.surrey.ac.uk/sociology/research/researchcentres/caqdas/). [6]
The label is often attached to software specifically written for the task of "doing" the cataloguing, coding, memo-ing and organising of qualitative research. Ann LEWINS and Christina SILVER (2009) provide a useful breakdown of the functionality of CAQDAS packages labelled. Meike OHLBRECHT (2004) mentions that there are around 25 packages, while Udo KELLE (2007) and Christina SILVER and Nigel FIELDING (2008) figure 20. There is fluctuation in defining how many packages are used in qualitative research and blurred distinctions between software which is designed specifically for qualitative data analysis and other packages which have been appropriated for use because they have features which are useful (PAULUS, LESTER & DEMPSTER, in press). Some packages have a long pedigree, e.g. ATLAS ti, MAXQDA, NUD*IST/NVivo, and are described as "mainstream" (SEALE, 2010). For information about features and functionality see Ann LEWINS and Christina SILVER (2007) and also the special issue of FQS (EVERS, MRUCK, SILVER & PEETERS, 2011) which highlights features of current software packages. [7]
The literature tends to focus on three main types of software being text retrievers, code-and-retrieve packages, and theory-building software (SILVER & FIELDING, 2008). In this article we are interested in the concepts of text coding and retrieving. [8]
CAQDAS has come on leaps and bounds, compare for example Graham GIBBS et al. (2002) and Jeanine EVERS et al. (2011). Nigel FIELDING (2012) moots that currently users adopt less apologetic views than a decade ago, where researchers now are more open to qualitative research and to technological possibilities (CISNEROS PUEBLA & DAVIDSON, 2012).There is a recognition of the slow take up of technology within qualitative research (compared with other non digital tools and methods) and a divide between software users and non users (DAVIDSON, 2012; DAVIDSON & DI GREGORIO, 2011a, 2011b). Further the software is changing, and rapidly growing features, indeed current software has moved away from providing a platform for grounded theory methodology (MacMILLAN & KOENIG, 2004; WOODS & ROBERTS, 2001). [9]
Nigel FIELDING (2012, §21) argues that CAQDAS has become more embedded as "part of the everyday practice of social research" and as such it is beginning to influence methods. For example he believes "it has had an increasing role in promoting new approaches to analysis, using sophisticated data representation features like charts, matrices and word clouds, and systematic analytic techniques like Boolean retrieval strategies ... that enable causal analysis with qualitative data". This is clearly an example of software influencing research and research influencing software. [10]
An issue of FQS is devoted to the KWALON experiment, which gave leading software developers the same dataset to explore, producing some interesting results around the ways data can be analysed and represented (DI GREGORIO, 2011; EVERS et al., 2011). The experiment highlighted that software developers chose particular types of data (i.e., text, video, audio, etc.) which worked better in their products. Furthermore, the results presented different aspects of the data influenced in part by the software's ability to work with that type of data (DEMPSTER & WOODS, 2011; FRIESE, 2011; KUCKARTZ & SHARP, 2011; LEJEUNE, 2011; WILTSHIER, 2011). The experiment was also an opportunity for developers and users to discuss new features within their products (WOODS & DEMPSTER, 2011). [11]
The experiment highlighted that there are still similarities in process and ways of conducting analysis common to many CAQDAS packages (DI GREGORIO, 2011). The commonality reflects the methods used in analysis (LEWINS & SILVER, 2009) i.e. together collecting data, breaking it down into manageable parts, performing some form of analysis, often through coding and comparing data, rebuilding data into a final product i.e. report or final analysis. The distinctions of which CAQDAS package is best for which type of data is becoming more blurred as some packages try to take on more and more features. It should be recognised that the ability to work with a type of data does not always mean that that particular software is the most efficient way to do this, e.g. MAXQDA 10 (VERBI-SOFTWARE, 2011) recommend using video based analysis software such as Transana (WOODS & FASSNACHT, 2012) for specific tasks. [12]
One further development is that researchers are looking beyond CAQDAS to find solutions to research problems. Again this is not new, researchers have often sought "clever solutions" by using features not explicitly designed to undertake qualitative analysis (HAHN, 2008; MEYER & AVERY, 2009). What is different is that it is reaching mainstream research audiences, see our forthcoming book (PAULUS et al., in press). This is not limited to the use of CAQDAS. This technological adoption allows researchers to develop new techniques to incorporate a much wider range of mediums in their work. The following are just a flavouring of different techniques being employed, such as video games (WOODS & DEMPSTER, 2011), MP3 and audio i.e. the use of iPods in traditional interviews (GALVEZ, MANKOWSKI, BRAUN & GLASS, 2009), documents i.e. using mobile phones and texts (STEEH, BUSKIRK & CALLEGARO, 2007; ZUWALLACK, 2009), focus groups on the web (O'CONNOR & MADGE, 2003), surveys and health research (EYSENBACH & WYATT, 2002) and Internet-based research (MURTHY, 2008). There really is such a plethora of methods and mediums available, being written and published suggesting that the conservatism illustrated by Lyn RICHARDS (2002) is fading. [13]
2.2 CAQDAS' supporting role in complex research
The development of CAQDAS has allowed qualitative researchers to theoretically undertake much more complex data analysis than was possible in years past (FIELDING & LEE, 1993; Tom RICHARDS, 2002). Whilst not exhaustive, three possible reasons are suggested here. Firstly the capacity and flexibility of computers and software has made it possible to tackle diverse and complex data; secondly user interface improvements encourage ease of use; thirdly availability of CAQDAS via site licences brings products to the masses. [14]
It is possible to tease out these reasons a little more. For example the capacity (and ability) of computers has progressed at a startling rate meaning they can manage much more data. CAQDAS can be taken into the field if required, rather than relying on a mainframe for computational power. However caveats apply for example the quantity of data managed is never to be confused with quality of data analysis (KELLE, 2004), clearly however the role of CAQDAS to act as a management tool is recognised (SINKOVICS & PENZ, 2011; SMYTH, 2006). [15]
In terms of ease of use, the user interface is easier, not requiring the levels of programming skills and command line intervention (KELLE, 1995). However additional functionality and features may require additional training and considerable investment in learning (AULD et al., 2007) making it inappropriate for use with small projects. Researchers comment on problems of over coding data (often occurring with inexperienced users and sometimes called the coding trap; see GILBERT, 2002; GOBLE, AUSTIN, LARSEN, KREITZER & BRINTNELL, 2012; JOHNSTON, 2006). CAQDAS is not suitable for all projects and the implications should be weighed up (GOBLE et al., 2012). [16]
More universities now have site licences for CAQDAS products, meaning that the software is easily available, which can encourage take up. However proficiency in use requires training to be available regularly for users. Having software available can mean that users will just opt for what is available, rather than sourcing the correct tools for the job. In teams (as was the case in our project) it is conceivable that there may be users familiar with completely different packages or none at all. This again suggests that training might be a joint enterprise across teams rather than being left to a sole individual who is expected to become the "group expert". [17]
Literature suggests that CAQDAS has a number of potential supporting benefits, such as providing accountability (JOHNSTON, 2006; SEALE, 2003; SINKOVICS & PENZ, 2011), providing support for "routine" tasks (ROBERTS & WILSON, 2002), or structure to a project (GÖRANSSON, EHRENBERG, EHNFORS & FONTEYN, 2007). Indeed Clive SEALE (2010) suggests that the three main advantages of software can be categorised as speed (i.e. of handling large amounts of data and also capacity meaning samples can be more representative); rigour (i.e. demonstration of cases through counting); team research (including the development of consistent coding across a team). [18]
CAQDAS can be used to autocode data (GOODKIND, HESS, GORMAN & PARKER, 2012) a technique we will return to when we describe our methods later. This is not unique just to CAQDAS: For example Laurence MOSELEY, MEAD and MURPHY (1997) developed a way of searching through data to autocode it. They created search strings to be able to look for particular information. Autocoding is a feature that is particularly useful in CAQDAS, for example Kieran O'HALLORAN (2011) automated the quantitative part of their research whilst using a qualitative package to store quotes and undertake analysis. Pat BAZELEY (2006) used NVivo to autocode sections of qualitative work to use in mixed methods approaches. [19]
Autocoding needs organised data and still benefits from user input. It seems that every generation of CAQDAS users has to point out that the central role of the researchers and how their actions remain paramount in the process of analysis and that software is an aid to achieving results (KING, 2009), but does not "mechanise thinking". SILVER and FIELDING (2008, p.335) discuss this eloquently:
"After over twenty years of CAQDAS, the evidence is that the myths recur; each generation of users (and non-users) re-negotiates the notion of a 'pushbutton PhD' where the computer 'does' your analysis for you, and that software will come between researchers and their data, or will obscure the context so important to interpreting the data, and so on. A recurrent worry is that software will somehow 'take over' the analysis, dictating a standard approach and drawing on hidden assumptions". [20]
What is clear is that the researcher is always "involved" directly in the process of analysis, the computer does not analyse (ROBERTS & WILSON, 2002), but supports the process (KING, 2009). [21]
In this section we briefly outline the use of keyword searches as an analytical strategy. We will cover the way we used them in more depth a little later. The use of keyword searching has been likened to "an aerial view of the landscape" (SEALE, 2010, p.254). which can allow coders to see more clearly an overview of the texts that they are dealing with. Influenced by corpus linguistics, Clive SEALE suggests that counting keywords as an initial process can root out data that may otherwise be overlooked; for further discussion of keyword analysis see (BAKER, 2006; SEALE, 2006; SEALE, CHARTERIS-BLACK, MacFARLANE & McPHERSON, 2010). Clive SEALE uses a package called Wordsmith tools to help with this process. We applied a simplified way of doing this using NVivo 8. [22]
For Clive SEALE (2010) this initial mapping of words can highlight high incidence words that may require further investigation. These may be collected together. Having created larger snapshot categories, based on the keyword, a process of fine-coding occurs. This involves creating subcategories, either through extensive reading or through the use of searches to locate topics. CAQDAS is employed in the categorisation and searching and subsequent naming of codes. [23]
Andrew KING (2009) used NVivo to examine the accounts of young people's gap years. He used a number of processes such as searching for individual keyword phrases, combining this with a frequency count. He developed a number of stages of coding, comparing, searching and combining categories using the tools in NVivo to help process the data. Some of the processes that he outlines are similar to our own approach. [24]
2.4 How we used NVivo 8 word frequency counts to generate keywords, categories and codes
Our own approach described here is a procedural account of a software-facilitated analytic strategy, based on a high level semi-automated first pass through the data, followed by more conventional qualitative data analysis code-based work on finer-grained material hooked in by the first pass. It uses functionality in the software to allow word frequency searches to be conducted on the dataset. Applying searches based on word frequency counts within NVivo 8 provided an initial categorisation of topics (and topic headings) in an efficient manner allowing for a targeted examination of the overall data in a manner similar to KING. In essence we used NVivo 8 to facilitate creating keywords which are converted into codes, making the data manageable, by splitting it into chunks. These chunks can be fine coded or further examined before additional coding and searching is applied. [25]
3. The Research: Contextualising Foundation Trust Hospitals
The research examined the governance arrangements of four Foundation Trust hospitals in the UK National Health Service (NHS) between 2007 to 2009 (ALLEN et al., 2010) paying particular attention to the role of governors and members (WRIGHT et al., 2012). These organisations were a new development within the NHS in Britain (ALLEN, BARTLETT, PEROTIN, ZAMORA & TURNER, 2011). These new forms of hospital (ALLEN et al., 2012a) were given greater financial and management freedoms and were considered at the time to be pioneering new ways of providing healthcare (DEPARTMENT OF HEALTH, 2005). This was because nothing like it had existed before (ALLEN et al., 2012b). [26]
At the time the study commenced, all the hospitals had recently been established and were evolving, changing, finding different ways to define and explore their new-found status and powers. Four sites for the case studies were selected purposively to reflect a range of factors such as the type of hospital, the stage in their development (as a newly formed Foundation Trust) and geographical setting. The research team picked locations which reflected rural and urban settings within the North and South of England. The research was overseen by a principal investigator with the assistance of a full time research fellow in the South and a lead investigator, a part time senior research officer and part time research fellow in the North. [27]
Currently, there are around 141 of these Foundation Trust hospitals in operation (see MONITOR, 2010), most of which are acute hospitals, but there are also some mental health units. The government's intention at the time of the research was that by 2011, Foundation Trusts would be responsible for the delivery of all acute and mental health care in England. In order to address the complexity of the Foundation Trust programme, we required a technique capable of consolidating larger conceptual ideas and also geographically specific semi-structured interviews gathered by a range of researchers from a variety of sources. [28]
3.1 Finding categories from within the text
The research team, based in different locations in the country had to find ways to make sense of each other's data. This raised an important question: approaching the data as outsiders, how do you impose a systematic way of searching, understanding and developing hierarchical categories which provide a useful way of understanding the texts? Further how will these categories help with understanding the research area in question? [29]
Studying Foundation Trust hospitals was a new field of research. Given that this research occurred at an early stage of implementation of a new governmental policy we found that the participants\interviewees were not sure what they were doing and there was little previous work to look at. In research interviews the directors commented that they were to an extent making it up as they went along. [30]
4. Using CAQDAS Software: The Mustard Seed Approach
We called this approach of creating keywords and undertaking searches and coding the Mustard seed approach, as it starts very small and builds into something much bigger. So where do you start? The software used to undertake the analysis was NVivo 8 (QSR INTERNATIONAL, 2008). This qualitative data analysis software is structured mainly although not explicitly around developing "nodes". For those not familiar with the software-specific terminology, according to "NVivo help",
"[a] node is a collection of references about a specific theme, place, person or other area of interest. You gather the references by reading through sources, such as interviews or focus groups, and categorizing information into the relevant nodes—this is called 'coding'" (QSR INTERNATIONAL, 2011, http://help-nv8-en.qsrinternational.com/NVivo_8_Help.htm [Accessed 20/01/12]. [31]
The following diagram highlights very briefly the process undertaken. We developed a range of keywords directly from the text. These were examined as keywords and from these we created nodes from the initial first pass of important words and phrases. Nodes in this instance are really collections where words were combined around a central phrase. These collections were later examined in detail, searched and coded on, creating themes and categories.
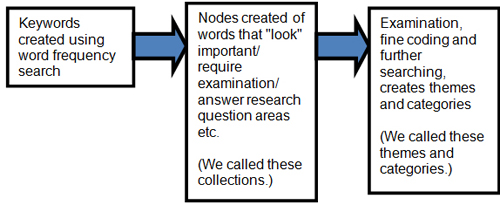
Figure 1: Mustard seed process [32]
Through a process of sifting and searching these were further refined. As understanding shifted and moved it created new searches which in turn created new topic headings. We found the hierarchical tree node structure was useful as it imposed some order on our developing headings. There was little in the way of pre-existing notions of what Foundation Trust hospitals were and how they would function, so the process relied on a constant comparative model to examine the data. [33]
Given the size and complexity of the texts (111 interviews ranging from 50 minutes to 2 hours across two phases and four sites) it would be impossible to deliver the level of analytical work within the timescales suggested had more traditional methods of coding been employed. The resulting analysis was thorough and timely, allowing ongoing exploration of themes as they were uncovered or developed. [34]
4.1 The Mustard seed approach in detail
The Mustard seed approach in essence creates nodes before their contents are examined or coded as analytically significant. Creating large numbers of nodes allows a researcher to search the landscape of interview conversations broadly, akin to Clive SEALE's (2010) aerial view described above; these form a range of categories for broad understanding. The approach does not need researchers to systematically go through all of the raw data (in the first instance) line by line; instead a process of automatically funnelling data into "large nodes" (FIELDING & LEE, 1998; FIELDING & WARNES, 2009; SILVER & FIELDING, 2008) for the researcher to search and code later is encouraged. [35]
The approach is ideal for large data sets, where a researcher may need to search through a large quantity of materials quickly to get an initial sense of "what is happening". It enables researchers to ask questions such as: What are the big issues that are being talked about? What phrases keep coming up? Where can I most efficiently focus my energies initially? The process gains rigour (and also momentum) by constantly going back to the data to find other examples. Furthermore it allows a targeted approach to analysis. NVivo 8 also aids the process of audit as it is always possible for members of the team to check what has been done and how the researcher has got to that point. [36]
The Mustard seed approach starts small and builds into something rather larger, embracing the idea of real world research (ROBSON, 2002) which needs to be time limited and focused. The purpose and focus is to develop a range of codes quickly and to start making sense of the data by coding in more detail the findings. NVivo 8 is well placed to aid the management of this process. Sense-making of data involves cutting out the "white noise" and being left with manageable chunks of data with which to process meaning. [37]
In this case, the technique was applied to a large set of semi-structured interviews that had been conducted by multiple members of the research team in multiple locations. This process of contextual engagement with the data (in other words reading the keywords in context) created the framework of reference (a range of categories) within the texts which were developed into more finely coded nodes. [38]
4.2 Mustard seed: The phases involved
The approach has a number of phases: aligning the data; loading the data; organising the data; creating searches; sorting the data; splitting it into analytically interesting pieces. Some of these phases are self-explanatory and genuinely straightforward. They are shared here as a matter of course to highlight fully the methods used. [39]
The first phase is alignment. This involves the process of harmonising transcripts to make sure that they are formatted in a similar way and also that the language is written in the same way. Before transcription begins, documents need to be laid out consistently and proofread. With hindsight we would insist on having a template or a simple protocol which could be used by each transcriber to ensure that small details like font, line spacing and type size match. This means that each time quotes were taken directly from NVivo 8 (using cut and paste, or the report function) the source does not need to be tidied up unnecessarily. It can be a little work early on to avoid a lot of work later. This is particularly important when research is occurring at multiple locations. [40]
More important is to standardise how particular words, phrases, and abbreviations are written. Failure to attend to this detail can be time consuming when using this technique. The aim is not to change what is said, but to develop uniformity in the transcription where possible. [41]
For example, General Practice Doctors (Physicians) were referred to as general practitioners, GP's, Geepees, GPwSI (General Practitioners with special interests), even "gypsies" at different times in our texts by various transcribers. Having a standard form used for all references in all transcripts is an essential aid when searching for the concept. The following transcript finds a general manager mentioning GP's who have special interests in three different ways. They have been underlined for sake of clarity.
"... are some of these services better provided in the community? So all the specialist GP's might be able to manage some of these services and are we looking for recruiting staff just for the sake of it whereas really GP's with special interests, [GPwSI] GP's who've done the dermatology course, could potentially pick some of this work up rather than us going on a major recruitment drive over[seas]" (3$, see below for the abbreviation). [42]
In this example we have inserted GPwSI in brackets after "GP's with special interests", to show where we would use standardisation. [43]
Thorough reading of all transcripts is important for two main reasons. Firstly we were beginning to get an idea of the research area, and secondly, small processes of alignment are achievable, for example where names need to be spelled consistently. Overall the process is one of standardisation rather than additions or a modification of the text. [44]
It is possible to develop analytically interesting names which add to the research process. For example where an area is named in a document, we quickly developed a confidential naming strategy. For names of hospitals we used a number followed by a "$". Each hospital was given a name 1$-4$. These have an additional analytical significance in that they represented the date of becoming a Foundation Trust hospital. This meant that every time this place was named we would substitute a number and symbol (e.g.3$)1). A governor's comment, for instance, becomes:
"... I mean this is an older site so some of the wards were inadequate, some of the toilet facilities were and money is being found and put in and improvements made within this site. 3$ didn't need quite as much doing but it's had the car parks ticketed and that, so that the flow of cars is much better and people find it easier to get in ...". [45]
4.2.2 Loading transcripts into the software
The second process involved in the Mustard seed approach involves loading in the transcripts into NVivo 8. On the initial setting up of the database, the transcript files were loaded into NVivo. The process of loading the transcript file into NVivo 8 is relatively straightforward. Files were imported in batches which corresponded with the folders we wished to place them in. These could then be moved into the chosen location. [46]
The third process involves organising the data. Once transcripts had been loaded into NVivo 8 and organised into folders corresponding to area, we made use of another feature for bringing together groups of data that we wanted to look at, e.g. North or South of England transcripts, clinicians transcripts, etc. This involved using NVivo's sets function. This simple device in the software provides a shortcut to different types of data into a single clickable source which can be named. Putting transcriptions into or out of the set did not disturb the data and any way; it merely changed the scope of searches conducted using that particular set. [47]
Finally using classifications (data that some people would call attributes) allowed the data to be quickly scoped. This type of data is often associated with mixed methods and can be more quantitative in nature (DI GREGORIO & DAVIDSON, 2008). We used the classifications in a simple way with information added about location, staff designator (e.g. clinician, governor, manager, nurse, staff member, board member), location, etc. These were created in an Excel file and imported in. Later, finer searching and coding benefited from classifications as a way to split up or bring together distinct groups of transcripts. So for example after searching for combinations of a particular keyword, the results could be sorted into "what the clinicians said" and "what the managers said" as separate virtual piles. Or searches could be made using the classifications that we had created to help locate areas e.g. find examples of a particular keyword that happen in the North rather than in the South. Sets and classifications were a useful way of allowing us to manage the complexity of later searches, allowing us to target particular groups. [48]
The fourth part of the Mustard seed approach involves creating searches. Here we use the terminology to describe the procedure of using searches to create codes (rather than creating elaborate search strings). There are a number of types of searches used. In the first instance, a full word frequency search is carried out to give an outline of all words that are stored in the database. The word frequency search can be found within "queries", which is NVivo's term for searches. NVivo 8 gives an option about the length of words. By selecting the checkbox for all words this search allows quick identification of all words used. Originally we would run the search with four letters or more. We do not particularly want words like "and", "the", and "can". However we did want important words such as "bed" or "ill" or phrases often abbreviated such as "Primary Care Trust", "Practice Based Commissioning" and "General Practitioners" often shortened to "PCT", "PBC" and "GPs", hence going back to selecting all words. What makes this search particularly powerful is not the mechanics of counting, but the fact that every word searched has the potential to become a node. This greatly increases the speed at which a researcher can begin to work their way round large amounts of transcripts (and the concepts contained therein). Essentially with the press of a few buttons, dozens (or indeed hundreds) of potentially interesting nodes can be identified and created for further exploration. [49]
Having searched through the data for commonly used words or phrases (using a policy of "creating nodes as you go") we were beginning to make sense of what has been said. For example, by looking through the frequency search, we might spot words that we would like to search as a "compound"2), such as "waiting and list*" or "18 week(s)"3). The frequency search does not pick up nuanced or subtle parts to language. Each further search however continues to build on previous ones, often based on information found in that previous search. The process is iterative and reflexive, based in the data. [50]
The fifth process involves sorting the data. In the first instance we use this to mean clumping together similar words or phrases into collections. There is a hyperlink feature built into the word frequency searches, meaning that the frequency list is connected to the word selected in the actual transcripts. The benefit becomes apparent when a word is selected from the word frequency list. By right-clicking with the mouse, you can make a word into a node (which will include all examples of the keyword across all transcripts). The most important thing to keep in mind is that as researchers we were looking for things that are analytically interesting but only at the level of single words or phrases. These analytically interesting components are given a title and stored as a node. NVivo 8 has recently added this function to the software making it possible to do these multiple searches (thousands at a time) and leave it up to the researcher to decide whether or not to make them into nodes. [51]
The first thing that we normally would do is examine the list of words along with the number of "hits". We looked for synonyms and similar words, so words that were essentially the same could be merged. This is one aspect of work that is easier done on paper as we could scribble notes on the margins or quickly flick through to find other examples4). At the simple end, variations of doctor such as General Practitioner, doctors, surgeries, and practices would be prime examples, as would plural words such as bed and beds. All this time, we were building awareness of word patterns, "hits" and variants. Figure 2 below shows an extract from the word frequency query. In this example there were 38 "hits" around adverts. These could be converted to a single node and thoroughly searched later.
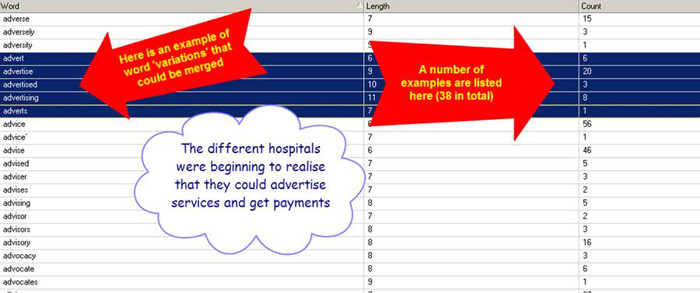
Figure 2: Extract from the word frequency query [52]
4.2.6 Splitting the data into analytically interesting pieces
The final process of splitting data into analytically interesting pieces involved making sense of the collections (i.e. nodes which contain keywords and phrases). The word frequency and subsequent simple sorting and searching of keywords creates a first level pass which hooks in keywords and phrases which are important to the research project. This final process involves reading and searching through the collections and coding on the data. We recognise that researchers may wish to use different coding methodologies, see for example the multiplicity of methods offered by Johnny SALDANÄ (2009). We used a "modified grounded theory" approach (ALLEN et al., 2010) which according to its originator (MILES, 1979) requires an adaptable framework to be applied to observations and fieldwork to ensure that the results are targeted and meaningful. The principle investigator developed a framework, which was a series of topics and areas that were important to the research project based on the research questions. This "framework" was developed and adapted throughout the life of the project. [53]
Using the collected-together-node "advertising" discussed above in Figure 1, we can show how coding revealed analytically interesting data. Reading through the collection based around the keyword "advert*" revealed that hospitals were beginning to experiment with advertising various patient services as they could receive payments for the work that they do. Within the National Health Service this was quite novel as hospitals were non-profit-making organisations. Foundation Trusts were allowed to reinvest any surplus profits that they made within their organisation (which was highly radical). Advertising was the start of a new understanding of financial rewards based on the ability to save surplus money. Further searches of nodes around "services" were made to understand what patient services were being advertised (revealing that there were services which were considered "cash cows") and searches using classifications revealed that this new understanding was coming from managers who understood the financial rewards (whilst clinicians were less interested). [54]
Targeted searching becomes an important part of splitting the data into analytically important pieces. For example, further searches and coding around the theme of telephoning (i.e. "calling", "ringing", "speaking", "conversations over the phone", etc.) revealed the phrase "doing well". Searching through nodes related to phone calls we realised this phrase came up again and again. It transpired that "doing well" an in vivo phrase was directly related to managing the hospital within the terms of regulatory imposed targets. The regulator would phone up a number of times a day to check on the hospitals and make sure they were "doing well". The litmus test for managers was to try and get the regulators to "remain at a distance". One interviewee summed this up: "you know they don't bother us. That's the test isn't it with (the regulator), if they are not ringing you up every two minutes, you are not doing too badly". [55]
In each of the Mustard seed searches, a node was created. This would be examined and coded on, splitting the data into finer and finer analytically interesting pieces. Coding into analytically interesting pieces should raise a number of questions, i.e. what does this mean and are there other examples of this? Essentially the process of searching and coding continues iteratively until the data is satisfactorily split into analytically interesting components useful for further searching, analysis or write up. [56]
Memos became a useful tool to communicate ideas and develop thinking. Where ideas for new searches became apparent, these would be duly noted in a memo, along with some information that located the idea behind the search. (Such memos were particularly useful as aide memoirs, as analysis work was shared across multiple researchers and multiple days or weeks.) The analytically interesting pieces were often raised and discussed at team meetings. This was an opportunity to interpret, share and fine tune the emerging framework. The only downside of using memos is that NVivo 8 is only able to assign one memo to each transcript, which is a limiting factor. [57]
One further useful feature of CAQDAS packages is that often searches can be saved. This becomes important later on when new data is added or simply when different members of the team want to check what searches have already been performed. Looking through saved searches shows a "list" of what has been done by others in the team. [58]
5. Example of the Mustard Seed Search
A good example of this type of searching would be the concept of "monitor". Monitor is an organisation which essentially licenses and oversees the financial aspects of a Foundation Trust hospital's work. They were an arms-length regulatory organisation brought into existence by the government as a way of solely regulating Foundation Trust hospitals. The organisation often used the rhetoric of letting hospitals get on with running themselves, but actually (as searches later revealed) they were actively involved in overseeing the areas around finance, enforcing specific targets (such as getting patients seen within 18 weeks) and keeping low scores on Methicillin-resistant Staphylococcus aureus (MRSA), an infection that the Department of Health was particularly interested in. Their chief executive at the time, Bill Bunter5), gained a reputation for his tough but fair stance. The word frequency search brought up a number of hits for "monitor", "bill" and "bunter" and also "regulator" and "regulation". It was likely that not all of the hits for "monitor" or "bill" would relate to this individual or "his" organisation. However it made sense to merge these together and sift or "code down" through the results; this is a relatively mechanical task. [59]
Taking an example from the above node "monitor" (an amalgam of "bill", "bunter", "monitor", "regulat*6)"), data would sometimes not be relevant. In the example below, a director talks about the wrong type of bill; he is talking about "racking up a bill" rather than talking about the target keyword of the node, Bill Bunter:
"... if emergency admissions continue to rise and you do loads of extra lists to get your waiting lists down, you're going to rack up a bill that's got to be paid, but they [PCT] may not have budgeted for that". [60]
This can be quickly removed from a node (uncoded) by a single button press. In this case the text was highlighted in NVivo 8 and coded to PCT payments. [61]
Below are further examples of text coded to the node "monitor".
"Well I suppose that the changing relationship with Monitor is going to be crucial and of course, that will often be in response to political pressure. One doesn't know what's happening in the world of Monitor but the way he responds to us is a reflection of what pressures are being placed on him obviously. So I think the changing relationship with Monitor and that will affect all the external pressures that we're under".
"The Monitor required us to have our governance rated check up by an external audit firm, they've been audited, pretty good, clean bill of health. So on the one hand the world is telling us we're doing alright actually, and then on the other hand we have this big threat hanging over us of intervention".
"There is a regulator watching all the time. I couldn't believe it when they decided to red flag us ... with less, than places like 1$, and yet the red flag ... it's crazy but ...". [62]
A researcher would want to search for further examples of "political pressure", "drivers", "external influence", "red flags", "responses from Monitor" and "relationships with Monitor" to see if other examples presented themselves. For example the phrase "clean bill of health" picked up because it has the word "bill" in it, would be prime for removing from the node bill/bunter/regulat*/monitor. However rather than just discarding this, further searches revealed that a "clean bill of health" was a regularly used phrase which describes a telephone call comment about a visit from another regulator, the Healthcare Commission, who inspected one hospital site and was satisfied with the levels of performance (what is interesting is that this Healthcare Commission inspects yet had no enforcing jurisdiction). Further searching on the "Healthcare Commission" found that they were still actively involved within hospitals (again outwith their jurisdiction). The whole point of creating Foundation Trust hospitals was that there would be less regulation and yet the searches start to reveal that other regulators continue to be involved, demonstrating overlapping regulation, something the Government was anxious to avoid. [63]
"Telephone", "calls" and "conversations" were also found to be analytically interesting. Through examining the material held within the nodes and coding down through this, it was found that Monitor would call hospitals, phoning them a couple of times a day to ensure that behaviours were changed or modified, data was provided or paperwork returned. This is not to be seen as negative, "harassing conversations", which superficial coding would suggest, these were just occasions where Monitor was undertaking its role of enforcement seriously. As the regulator Monitor was beginning to find out, the NHS had geographical and organisational variations across the country and Monitor had to adapt regulation to take into account "normal organisational variation". The process of regulation meant understanding these differences and being able to act accordingly, a process which according to interviewees took some time. Calls changed from procedural actions to checking if they were "doing well". [64]
Overall there is a general process in play. Sense-making of data involves cutting out the "white noise" and being left with manageable chunks of data with which to process meaning. In some cases, this will be a note, a memo, a diagram, a process, audio or video, a framework, part of an in depth look at a conversation, a pattern, or a series of codes which may, individually or in groups, form hierarchies which explain the data in question. The literature provides ample examples of how this can be achieved both with and without CAQDAS. For us the process was enhanced through using CAQDAS. [65]
The Mustard seed approach is borne out of a need for efficiency and a targeted examination of data from which we could make decisions about which aspects of the data to explore and code in greater detail (MILES, 1979). It achieves this through adapting the word count feature in NVivo 8 as a first pass through the data (to create keyword collections) before following up with more complex searching and coding (to create categories or themes). Overall this places us more in control of the data, focusing analytical attention where required, such as on the research questions, or following up analytically interesting occurrences in the data. The approach however relies on accurate, consistent transcription, indeed the more consistent the transcription is, the better. [66]
Some of these techniques described here have been used in adapted forms for years and are well documented in the literature. What we are highlighting is both the relevance of these methods and how it is possible to undertake these in a partially automated way. Similarly the development of software and computers has resulted in changes in the way we deal with data (often resulting in the collection of more rather than less). [67]
We recognise that there are other tools similarly or better suited to this task, but also we consider that researchers often have to work with the tools at their disposal and adapt them to suit their needs, hence our use of NVivo 8. One thing we are clear about is that nothing replaces the hard work of fine coding; and the computer will thankfully never replace the researcher as the main instrument or conduit through which research is interpreted and understood. CAQDAS should work for the researcher rather than the other way around. [68]
One benefit of this type of approach is that the overall data is examined without being swamped and overrun with minute detail (in the first instance). Creating a systematic searchable framework of content from within texts where little existed externally is powerful and desirable. The accuracy of line by line coding or systematic understanding of data that comes from constant comparison, are not dispensed with. They merely happen later in the analytic process. [69]
Colin ROBSON (2002) talks about real world research, something that many of the "research how to" textbooks do not consider. In reality, research is time-limited with a specific remit. The luxury of doing open ended research, such as during a research thesis, is often impossible to replicate in the "real world". There are a number of real world limitations relating to using CAQDAS that naturally need to be overcome. These include availability of software, experience, resources and training, and lack of tools to encourage team working within the software. [70]
As more researchers publish in-depth accounts of how they undertake work whilst using CAQDAS it creates a growing body of literature to draw on. It also creates dialogue between users and may encourage software developers to join the debate and publish tools which serve their needs. [71]
What we found is that the limitation of qualitative research tends to be based on two major resource factors: the whole time available and the sheer volume of related data that needs analysis. CAQDAS is very useful as a tool to organise and process large amounts of data and when using approaches such as Mustard seed searching can speed up some of the mundane aspects of a researcher's workload leaving the researcher time to work on areas that are important. [72]
Acknowledgements
The research was funded by the NIHR Service Delivery and Organisation Research & Development Programme under grant number 08/1618/157. Original members of the team included: Dr. Paul G. DEMPSTER and Mrs. Jean TOWNSEND, Prof. Justin KEEN from the University of Leeds; Dr. John S.F. WRIGHT, Dr. Pauline ALLEN (PI), and Dr. Andrew HUTCHINGS, London School of Hygiene & Tropical Medicine; Dr. Andrew STREET and Dr. Rossella VERZULLI from the University of York.
We would like to thank Dr. Pauline ALLEN, Dr. Andrew HUTCHINGS, Dr. Andy HILD and Rose PEACOCK for their comments on earlier drafts.
1) The number and dollar sign could be quickly highlighted and later changed back if required using the replace function within Microsoft Word. <back>
2) This is an NVivo search that allows two separate things to be searched together. <back>
3) The "*" at the end of a word represents a truncated search. So for example a search will include plural versions of words. <back>
4) One technical solution that worked well is to use a tablet laptop and the ink function within Microsoft Word which means annotations can be sent around the team. <back>
5) The name has been anonymised. <back>
6) The star is used to represent truncated words. Thus a search will look for the letters "regulat" and will return any words which start with these letters. A search would therefore return words such as regulate, regulation, regulator, regulates, regulations, etc. <back>
Allen, Pauline; Bartlett, Will; Perotin, Virginie; Zamora, Bernarda & Turner, Simon (2011). New forms of provider in the English National Health Service. Annals of Public and Cooperative Economics, 82, 77-95.
Allen, Pauline; Townsend, Jean; Dempster, Paul G.; Wright, John S.F.; Hutchings, Andrew & Keen, Justin (2012). Organizational form as a mechanism to involve staff, public and users in public services: A study of the governance of NHS Foundation Trusts. Social Policy and Administration, 46, 239-257.
Allen, Pauline; Wright, John S.F; Keen, Justin; Dempster, Paul G.; Hutchings, Andrew; Townsend, Jean; Street, Andrew & Verzulli, Rossella (2010). Investigating the governance of NHS Foundation Trusts. London: NIHR Service Delivery and Organisation Programme.
Allen, Pauline; Wright, John S.F.; Keen, Justin; Dempster, Paul G.; Hutchings, Andrew; Townsend, Jean; Street, Andrew & Verzulli, Rossella (2012). Investigating the governance of autonomous public hospitals in England: Multisite case-study of NHS foundation trusts. Journal of Health Services Research and Policy, 17, 94-100.
Auld, Garry W.; Diker, Ann; Bock, M. Ann; Boushey, Carol J.; Bruhn, Christine M.; Cluskey, Mary; Edlefsen, Miriam; Goldberg, Dena L.; Misner, Scottie L.; Olson, Beth H.; Reicks, Marla; Wang, Changzheng & Zaghloul, Sahar (2007). Development of a decision tree to determine appropriateness of NVivo in analyzing qualitative data sets. Journal of Nutrition Education and Behavior, 39, 37-47.
Baker, Paul (2006). Using corpora in discourse analysis. London: Continuum.
Bazeley, Pat (2006). The contribution of computer software to integrating qualitative and quantitative data and analyses. Research in the Schools, 13, 64-74.
Cisneros Puebla, César A. & Davidson, Judith (2012). Qualitative computing and qualitative research: Addressing the challenges of technology and globalization. Forum Qualitative Sozialforschung / Forum: Qualitative Social Research, 13(2), Art. 28, http://nbn-resolving.de/urn:nbn:de:0114-fqs1202285 [Accessed: July 20, 2012].
Davidson, Judith (2012). The journal project: Qualitative computing and the technology/aesthetics divide in qualitative research. Forum Qualitative Sozialforschung / Forum: Qualitative Social Research, 13(2), Art. 15, http://nbn-resolving.de/urn:nbn:de:0114-fqs1202152 [Accessed: July 20, 2012].
Davidson, Judith & di Gregorio, Silvana (2011a). Qualitative research, technology, and global change. In Norman K. Denzin & Michael Giardina (Eds.), Qualitative inquiry and global crises (pp.79-96). Walnut Creek, CA: Left Coast Press.
Davidson, Judith & di Gregorio, Silvana (2011b). Qualitative research and technology: In the midst of a revolution. In Norman K. Denzin & Yvonna S. Lincoln (Eds.), Handbook of qualitative research (4th ed., pp.627-643). Thousand Oaks, CA: Sage.
Dempster, Paul G. & Woods, David K. (2011). The economic crisis though the eyes of Transana. Forum Qualitative Sozialforschung / Forum: Qualitative Social Research, 12(1) Art. 2, http://nbn-resolving.de/urn:nbn:de:0114-fqs1101169 [Accessed: July 20, 2012].
Department of Health (2005). A short guide to NHS Foundation Trusts. London: Department of Health.
di Gregorio, Silvana (2011). Comment: KWALON conference: Is qualitative software really comparable? Reflections on "the experiment": An "expert" view. Forum Qualitative Sozialforschung / Forum: Qualitative Social Research, 12(1), Art.16, http://nbn-resolving.de/urn:nbn:de:0114-fqs1101C35 [Accessed: July 20, 2012].
di Gregorio, Silvana & Davidson, Judith (2008). Qualitative research design for software users. Berkshire: Open University Press.
Evers, Jeanine; Mruck; Katja; Silver, Christina & Peeters, Bart (2011). The KWALON experiment: Discussions on qualitative data analysis software by developers and users. Forum Qualitative Sozialforschung / Forum: Qualitative Social Research, 12(1), Art. 13, http://nbn-resolving.de/urn:nbn:de:0114-fqs1101381 [Accessed: July 20, 2012].
Eysenbach, Gunther & Wyatt, Jeremy (2002). Using the Internet for surveys and health research. Journal of Medical Internet Research, 4(2), e13.
Fielding, Nigel (2012). The diverse worlds and research practices of qualitative software. Forum Qualitative Sozialforschung / Forum: Qualitative Social Research, 13(2), Art. 3, http://nbn-resolving.de/urn:nbn:de:0114-fqs1202124 [Accessed: July 20, 2012].
Fielding, Nigel & Lee, Raymond (1991). Using computers in qualitative research. London: Sage.
Fielding, Nigel & Lee, Raymond (Eds.) (1993). Using computers in qualitative research. London: Sage.
Fielding, Nigel & Lee, Raymond (1998). Computer analysis and qualitative research. London: Sage.
Fielding, Nigel & Lee, Raymond (2002). New patterns in the adoption and use of qualitative software. Field Methods, 14, 197-216.
Fielding, Nigel & Warnes, Richard (2009). Computer-based qualitative methods in case study research. In David Byrne, & Charles Ragin (Eds.), The SAGE handbook of case-based methods (pp.271-288). London: Sage.
Friese, Susanne (2011). Using ATLAS.ti for analyzing the financial crisis data. Forum Qualitative Sozialforschung / Forum: Qualitative Social Research, 12(1), Art. 3, http://nbn-resolving.de/urn:nbn:de:0114-fqs1101397 [Accessed: July 20, 2012].
Galvez, Gino; Mankowski, Eric S.; Braun, Margaret F. & Glass, Nancy (2009). Development of an iPod audio computer-assisted self-interview to increase the representation of low-literacy populations in survey research. Field Methods, 21, 407-415.
Gibbs, Graham (2002). Qualitative data analysis. Buckingham: Open University Press.
Gibbs, Graham; Friese, Susanne & Mangabeira, Wilma (2002). Using technology in the qualitative research process. Forum Qualitative Sozialforschung / Forum: Qualitative Social Research, 3(2), Art. 1, http://nbn-resolving.de/urn:nbn:de:0114-fqs020287 [Accessed: July 20, 2012].
Gilbert, Linda (2002). Going the distance: "Closeness" in qualitative data analysis software. International Journal of Social Research Methodology, 5, 215-228.
Goble, Erika; Austin, Wendy; Larsen, Denise; Kreitzer, Linda & Brintnell, Sharon (2012). Habits of mind and the split-mind effect: When computer-assisted qualitative data analysis software is used in phenomenological research. Forum Qualitative Sozialforschung / Forum: Qualitative Social Research, 13(2), Art. 17, http://nbn-resolving.de/urn:nbn:de:0114-fqs120227 [Accessed: July 20, 2012].
Göransson, Katarina E.; Ehrenberg, Anna; Ehnfors, Margareta & Fonteyn, Marsha (2007). An effort to use qualitative data analysis software for analysing think aloud data. International Journal of Medical Informatics, 76, Supplement 2, S270-S273.
Goodkind, Jessica; Hess, Julia Meredith; Gorman, Beverly & Parker, Danielle (2012). We're still in a struggle. Qualitative Health Research, 22, 1019-1036.
Hahn, Chris (2008). Doing qualitative research using your computer. London: Sage.
Johnston, Lynne (2006). Software and method: Reflections on teaching and using QSR NVivo in doctoral research. International Journal of Social Research Methodology, 9, 379-391.
Kelle, Udo (Ed.) (1995). Computer-aided qualitative data analysis: Theory, methods and practice. London: Sage.
Kelle, Udo (2004). Computer-assisted analysis of qualitative data. In Uwe Flick, Ernst von Kardorff & Ines Steinke (Eds.), A companion to qualitative research (pp.276-293). London: Sage.
Kelle, Udo (2007). Computer assisted qualitative data analysis. In Clive Seale, Giampietro Gobo, Jaber Gubrium & David Silverman (Eds.), Qualitative research practice (pp.443-460). London: Sage.
Kelle, Udo & Laurie, Heather (1995). Computer use in qualitative research and issues of validity. In Udo Kelle (Ed.), Computer-aided qualitative data analysis: Theory, methods and practice (pp.19-28). London: Sage.
King, Andrew (2009). "Membership matters": Applying Membership Categorisation Analysis (MCA) to qualitative data using Computer Assisted Qualitative Data Analysis (CAQDAS) software. International Journal of Social Research Methodology, 13, 1-16.
Kuckartz, Anne & Sharp, Michael J. (2011). Responsibility: A key category for understanding the discourse on the financial crisis—analyzing the KWALON data set with MAXQDA 10. Forum Qualitative Sozialforschung / Forum: Qualitative Social Research, 12(1), Art. 4, http://nbn-resolving.de/urn:nbn:de:0114-fqs1101222 [Accessed: July 20, 2012].
Lejeune, Christophe (2011). From normal business to financial crisis ... and back again. An illustration of the benefits of Cassandre for qualitative analysis. Forum Qualitative Sozialforschung / Forum: Qualitative Social Research, 12(1), Art. 5, http://nbn-resolving.de/urn:nbn:de:0114-fqs1101247 [Accessed: July 20, 2012].
Lewins, Ann & Silver, Christina (2007). Using software in qualitative research: A step by step guide. London: Sage.
Lewins, Ann & Silver, Christina (2009). Choosing a CAQDAS package. NCRM Working Paper, http://eprints.ncrm.ac.uk/791/ [Accessed: July 20, 2012].
MacMillan, Katie & Koenig, Thomas (2004). The wow factor. Social Science Computer Review, 22, 179-186.
Meyer, Daniel Z. & Avery, Leanne M. (2009). Excel as a qualitative data analysis tool. Field Methods, 21, 91-112.
Miles, Matthew (1979). Qualitative data as an attractive nuisance—the problem of analysis. Administrative Science Quarterly, 24, 590-594.
Monitor (2010). NHS Foundation Trust Directory. London: Monitor, http://www.monitor-nhsft.gov.uk/home/about-nhs-foundation-trusts/nhs-foundation-trust-directory [Accessed: January 20, 2012].
Moseley, Laurence; Mead, Donna & Murphy, Fiona (1997). Applying lexical and semantic analysis to the exploration of free-text data. Nurse Researcher, 4, 46-68.
Murthy, Dhiraj (2008). Digital ethnography: An examination of the use of new technologies for social research. Sociology, 42, 837-855.
O'Connor, Henrietta & Madge, Clare (2003). Focus groups in cyberspace: Using the Internet for qualitative research. Qualitative Market Research, 6, 133-143.
O'Halloran, Kieran (2011). Investigating argumentation in reading groups: Combining manual qualitative coding and automated corpus analysis tools. Applied Linguistics, 32, 172-196.
Ohlbrecht, Meike (2004). Resources for qualitative researchers. In Uwe Flick, Ernst von Kardorff & Ines Steinke (Eds.), A companion to qualitative research (pp.373-381). London: Sage.
Paulus, Trena; Lester, Jessica & Dempster, Paul G. (in press). Digital tools for qualitative research. London: Sage.
QSR International (2008). NVivo 8. Adelaide: QSR International, http://www.qsrinternational.com/products_nvivo.aspx [Accessed: November 20, 2009].
QSR International (2011). NVivo 8 online help: Using the software: Nodes, http://help-nv8-en.qsrinternational.com/NVivo_8_Help.htm [Accessed: January 20, 2012].
Richards, Lyn (2002). Qualitative computing—A methods revolution. International Journal of Social Research Methodology, 5, 263-276.
Richards, Lyn (2005). Handling qualitative data: A practical guide. London: Sage.
Richards, Tom (2002). An intellectual history of NUD*IST and NVivo. International Journal of Social Research Methodology, 5, 199-214.
Richards, Tom & Richards, Lyn (1995). Using hierarchical categories in qualitative data analysis. In Udo Kelle (Ed.), Computer-aided qualitative data analysis (pp.80-95). London: Sage.
Roberts, Kathryn A. & Wilson, Richard W. (2002). ICT and the research process: Issues around the compatibility of technology with qualitative data analysis. Forum Qualitative Sozialforschung / Forum: Qualitative Social Research, 3(2), Art. 16, http://nbn-resolving.de/urn:nbn:de:0114-fqs0202234 [Accessed: July 20, 2012].
Robson, Colin (2002). Real world research. London: Blackwell.
Saldaňa, Johnny (2009). The coding manual for qualitative researchers. London: Sage.
Seale, Clive (2003). Computer assisted analysis of qualitative interview data. In James Holstein & Jaber Gubrium (Eds.), Inside interviewing, new lenses, new concerns (pp.651-670). London: Sage.
Seale, Clive (2006). Gender accommodation in online cancer support groups. Health, 10, 345-360.
Seale, Clive (2010). Using computers to analyse qualitative data. In David Silverman (Ed.), Doing qualitative research (pp.251-265). London: Sage.
Seale, Clive; Charteris-Black, Jonathan; MacFarlane, Aidan & McPherson, Ann (2010). Interviews and Internet forums: A comparison of two sources of qualitative data. Qualitative Health Research, 20, 595-606.
Silver, Christina & Fielding, Nigel (2008). Using computer packages in qualitative research. In Carla, Willig & Wendy, Stainton-Rogers (Eds.), The Sage handbook of qualitative research in psychology (pp.334-351). London: Sage.
Sinkovics, Rudolf R. & Penz, Elfriede (2011). Multilingual elite-interviews and software-based analysis. International Journal of Market Research, 53, 705-724.
Smyth, Robyn (2006). Exploring congruence between Habermasian philosophy, mixed-method research, and managing data using NVivo. International Journal of Qualitative Methodology, 5, 1-11, https://ejournals.library.ualberta.ca/index.php/IJQM/article/view/4395/3521 [Accessed: July 20, 2012].
Steeh, Charlotte; Buskirk, Trent D. & Callegaro, Mario (2007). Using text messages in U.S. mobile phone surveys. Field Methods, 19, 59-75.
Verbi-Software (2011). MAXQDA 10. Marburg: Verbi Software, http://www.maxqda.com/ [Accessed: March 4, 2013].
Weitzman, Eben (2000). Software and qualitative research. In Norman K. Denzin & Yvonna S. Lincoln (Eds.), Handbook of qualitative research (pp.803-820). London: Sage.
Wiltshier, Fiona (2011). Researching with NVivo. Forum Qualitative Sozialforschung / Forum: Qualitative Social Research, 12(1), Art. 6, http://nbn-resolving.de/urn:nbn:de:0114-fqs1101234 [Accessed: July 20, 2012].
Woods, David K. & Dempster, Paul G. (2011). Tales from the bleeding edge: The qualitative analysis of complex video data using Transana. Forum Qualitative Sozialforschung / Forum: Qualitative Social Research, 12(1), Art. 15, http://nbn-resolving.de/urn:nbn:de:0114-fqs1101172 [Accessed: July 20, 2012].
Woods, David K. & Fassnacht, Chris (2012). Transana v2.50. Madison: The Board of Regents of the University of Wisconsin System, http://www.transana.org [Accessed: March 4, 2013].
Woods, Leslie & Roberts, Paula (2001). Generating theory and evidence from qualitative computerised software. Nurse Researcher, 8, 29-41.
Wright, John S.F; Dempster, Paul G.; Keen, Justin; Allen, Pauline & Hutchings, Andrew (2012). The new governance arrangements for NHS foundation trust hospitals: Reframing governors as meta-regulators. Public Administration, 90, 351-369.
Wright, John S.F; Dempster, Paul G.; Keen, Justin; Allen, Pauline & Hutchings, Andrew (forthcoming). How do we evaluate the impacts of policy? The case of payment by results and the 18 week patient pathway in English hospitals. Policy Studies.
Zuwallack, Randal (2009). Piloting data collection via cell phones: Results, experiences, and lessons learned. Field Methods, 21, 388-406.
Paul G. DEMPSTER is a research fellow at the University of York UK. He is a medical sociologist, with interests in mental health and thanatology, specialising in qualitative research within randomised control trials. He is currently researching a computerised cognitive behavioural therapy intervention with teenagers who have depression and developing a Social Stories manual for teachers who work with children who have autism. He has a longstanding research interest in the use of qualitative research software, its development and application in new and distinctive ways and has co-authored a text on digital tools for qualitative researchers.
Contact:
Paul G. Dempster, Ph.D.
Room A/RC/OO2E
ARRC Building
Department of Health Sciences
University of York
Heslington
YO10 5DD, UK
Tel.: +44 (0)1904 32 1371
E-mail: p.dempster@york.ac.uk
David WOODS is a researcher at the Wisconsin Center for Education Research at the University of Wisconsin, Madison. His primary interest is in facilitating the analytic work of researchers, particularly those with challenging data or innovative analytic approaches. He is the lead developer of Transana, software for the transcription and qualitative analysis of video and audio data.
Contact:
David K. Woods, Ph.D.
Wisconsin Center for Education Research
University of Wisconsin, Madison
1025 W. Johnson St., #345-A
Madison, WI 53706-1706
USA
Tel.: +1 608 262 1770
Fax: +1 608 265 9300
E-mail: dwoods@wcer.wisc.edu
URL: http://www.transana.org/
John S.F. WRIGHT is a senior research fellow in the Department of Social Policy at the London School of Economics and Political Science. His primary research interests are political ideas, political theory and regulation and governance. Currently, he is working on methodologies for health technology assessment in the European Union.
Contact:
Dr. John Wright
Senior Research Fellow
Department of Social Policy
London School of Economics and Political Science
LSE Health
Houghton Street
London WC2A 2AE, UK
Tel.: +44 (0)20 7955 6377
E-mail: j.s.wright@lse.ac.uk
Dempster, Paul G.; Woods, David & Wright, John S.F. (2013). Using CAQDAS in the Analysis of Foundation Trust Hospitals in
the National Health Service: Mustard Seed Searches as an Aid to Analytic Efficiency [72 paragraphs]. Forum Qualitative Sozialforschung / Forum: Qualitative Social Research, 14(2), Art. 3,
http://nbn-resolving.de/urn:nbn:de:0114-fqs130231.

Creative Commons Attribution 4.0 International License