Volume 14, No. 3, Art. 2 – September 2013
"I Don't Know What's Right Anymore": Engaging Distressed Interviewees Using Graphic-Elicitation
Geoff Kuehne
Abstract: Graphic-elicitation appears to be a research method that potentially has much to offer, particularly so when working with distressed and disaffected groups. It can be especially suited to presenting contentious ideas with unwelcome implications to sceptical interviewees, in this case irrigation farmers who were questioning aspects of climate change. Five images were introduced in the course of conducting in-depth personal interviews. The interviews were recorded and analysed for recurrent themes related to the images. The graphic-elicitation method allowed some participants to preserve or build their sense of optimism by viewing the graphic-elicitation images in particular ways—they saw in them what they wanted to see. Encouraged by the images some attempted to transfer their felt responsibility toward climate change responses to the government and upstream irrigators by blaming them for their low water availability.
Key words: graphic-elicitation; farmer interviews; Australia; rural sociology; climate change; beliefs; scepticism; interviews
Table of Contents
1. Introduction
2. Method
3. Results and Discussion
3.1 First mini-poster: MDBA "Drought Update"
3.2 Second mini-poster: 50-year wet and dry periods
3.3 Third mini-poster: Water in storage and irrigation allocations
3.4 Fourth mini-poster: Water allocations under differing drought and climate change scenarios
3.5 Fifth mini-poster: Before and after photographs of Lake Albert
3.6 How participants viewed the mini-posters
4. Conclusion
This article reports on the use of the graphic-elicitation method—the introduction of visual images into a personal interview with the aim of enhancing the depth and quality of the information obtained. The interviews were part of a larger study investigating the potential options for climate change adaptation of irrigation farmers in the Loxton region of the South Australian Riverland. These farmers were reliant on uncertain supplies of water from the River Murray to grow a range of horticultural and viticultural crops. [1]
The research question was "What are farmers' beliefs about climate change and how does this affect their perceptions of their potential climate change adaptation options". In-depth face-to-face interviews were used to 1. better understand farmers' beliefs about climate change, 2. uncover and identify farmers' perceptions of their adaptation options, and 3. establish how their past and intended adaptation responses varied according to their beliefs about climate change (KUEHNE, in press). This article addresses those study aims and also describes the potential usefulness of the graphic-elicitation method for enhancing personal interviews. [2]
The personal interviews were used as a way to gain cooperation from a group who were facing a large threat to their future in the form of profound impacts from climate variability in the form of a debilitating decade-long drought and low commodity prices. This meant that at the time of the interviews dealing with climate change was far from their most concerning problem; instead it was their struggle for business survival. [3]
The graphic-elicitation method was chosen because with only 27% of Australian farmers believing that human activity is causing climate change (DONNELLY, MERCER, DICKSON & WU, 2009)1) the study group was also expected to be strongly sceptical of mainstream climate change science. In addition, due to the severe effects of the drought and low commodity prices on their businesses, they were expected to be somewhat disheartened and emotionally stressed about their financial situation and their future farming prospects (KUEHNE, BJORNLUND & LOCH, 2010). [4]
Graphic-elicitation is one of the suite of research methods that are becoming increasingly used as visual communication becomes more ubiquitous (KNOBLAUCH, BAER, LAURIER, PETSCHKE & SCHNETTLER, 2008). It uses visual images that can be researcher-generated or participant-generated and can include hand-drawn sketches, maps and conceptual diagrams (BAGNOLI, 2009) through to more sophisticated computer-generated illustrations (CRILLY, BLACKWELL & CLARKSON, 2006; VARGA-ATKINS & O'BRIEN, 2009) or charts (HANSEN, MARX & WEBER, 2004). [5]
The graphic-elicitation method appears to be especially useful when the interview subject matter is not able to be readily explained during the interview (CRILLY et al., 2006), or when the explanation of the subject matter interferes with the flow of the interview, puts the interviewee offside, or takes too long to achieve. The method was used for this study to:
encourage interviewees to direct their focus toward the themes of the interviews and to provoke or extend their thinking about them;
explain contentious aspects of the research topic to participants more effectively than a verbal explanation;
establish a starting point from where the conversation could be developed and expanded. [6]
Section 2 describes the method, why it was chosen and how it was applied. It also discusses why each of the graphic elicitation images were chosen and how they were used for the research. Section 3 presents and discusses the results from using the graphic elicitation technique. Section 4 presents the conclusions drawn from the use of the graphic elicitation method, and suggestions for others who might be considering using the same method. [7]
Eleven key informants were selected for the research interviews using non-random, purposive sampling (GLASER & STRAUSS, 1989 [1967]) by the Loxton to Bookpurnong Local Action Planning Committee. This community-based volunteer organisation was a research partner because it has a mission to lead and encourage community involvement in natural resource management as well as responses to climate change and other projects relevant to the local community. [8]
Unstructured, in-depth and interactive face-to-face interviews with non-directive open-ended questions informed by the research questions were chosen because there was no pre-existing theory or hypotheses that needed testing and because that type of interview gives informants more power over what is discussed and how it is discussed (CORBIN & MORSE, 2003; SAKS & ALLSOP, 2007). The interviews were arranged at the interviewee's location of choice, which in most cases was their home or their workplace. Informed consent was sought and interviews were digitally recorded and transcribed. [9]
To some extent the analysis was concurrent with interviews, because introducing images into the interviews made it a collaborative process with the interviewer and interviewee jointly constructing meanings (JENKINGS, WOODWARD & WINTER, 2008). In addition reflexive journalling was undertaken before, during and after the interviews and the analysis. The developing insights and ideas, thinking and the reflection that were involved in the interviews and the journalling was the start of the interpretive process (BAZELEY, 2007; EZZY, 2002). [10]
Aspects of grounded theory methodology, such as constant comparative analysis, problem emergence, conceptual emergence and memoing, were used for this study (CHARMAZ, 2006). The interview transcripts were open coded to allow substantive concepts to emerge from the data using NVivo qualitative data analysis software. After the coded text was matched to the graphic images memoing was used so that inferences could be made about how the images were understood by the interviewees. The reflexive journal and the memos when combined with insights illustrated by selections from the coded text has contributed to much of the discussion in this article. [11]
Analytic memoing (the theorising write-up of ideas about substantive codes and their theoretically coded relationships) were used to refine and record ideas that developed when interviewee's responses to the mini posters were examined (GLASER, 1998). The memos, which differed to field notes in that they were lengthier, more complex and more analytical thoughts about an event, were an attempt to:
describe and explain the patterns observed in the data,
answer the question of "what is going on here?,"
stimulate new insights into data (CORBIN & STRAUSS, 2008). [12]
For the graphic-elicitation part of the research five images were chosen, modified labelled and printed on A4-sized "mini-posters". The images were selected for how they might help to elicit comments and thoughts in line with the study aims. In addition the images—which were prepared by the researcher—were used to present an incontestable conceptual base to avert interviewees' expected scepticism about the cause and effects of climate change (KUEHNE et al., 2010). The credibility and the authority of the statements about climate change were expected to be built from deferring to other experts. For example a table showing the potential decline in water availability in the future (see Graphic 4) was likely to be more authoritative presented as a graphic image than if delivered to interviewees verbally. [13]
Apart from introducing contentious ideas to interviewees, graphic-elicitation provided a starting point for the interviewee to interact with the topic. This is because the method is effective in encouraging deeper thought from interviewees on issues of interest to the researcher. It works in much the same way as the photo-elicitation method which often uses an image that is understood, at least to some extent, both by the interviewer and interviewee; thereby producing deeper levels of meaning than interviews by themselves (HARPER, 2002). [14]
The first mini-poster (see Graphic 1) displayed the front page of the 13 November "River Murray System—Drought Update" (MURRAY-DARLING BASIN AUTHORITY, 2009a), which was published in the weeks before the interviews were conducted. This document was the twenty-first of a series that started in November 2004 after the serious implications of Australia's Murray-Darling Basin (MDB) drought became increasingly apparent to the management authority and those reliant on the basin's water which included the irrigators of the study area. The "River Murray System—Drought Update" series of publications provided an on-going summary of the changing outlook for the water resources of the MDB. The image used for the first mini-poster was manipulated by taking the most significant message from the text, enlarging it and placing it prominently in a text box in front of the text from where it was abstracted. [15]
The purpose of the first mini-poster was to introduce the statement that the current situation for irrigators was poor. This was done to avoid any bias from the interviewer saying the same thing. The discussion was expected to cover whether interviewees agreed with the highlighted statement that "overall the situation for irrigators ... remains poor", and include discussion about the drought, and the implications of the drought for interviewees.
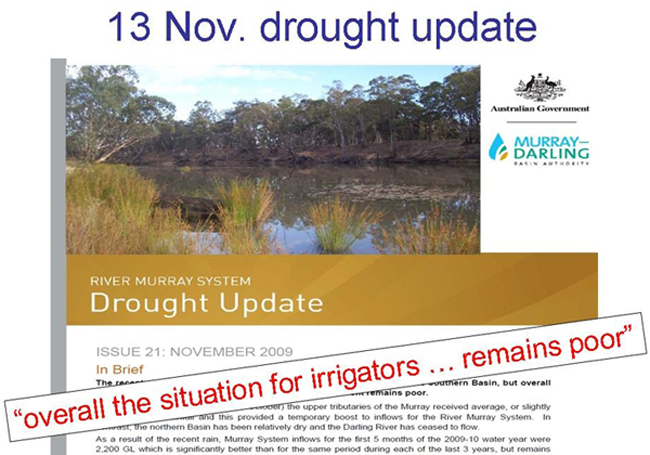
Graphic 1: Drought update [16]
The second mini-poster (see Graphic 2) presented a chart showing that rainfall, for at least the last hundred years, occurred in a drier fifty-year period followed by a wetter fifty-year period; with the implied suggestion that the MDB may be entering another dry period (YOUNG & McCOLL, 2008). A caption was added to explain the intent of the chart, but also to act as a challenging and provocative question for participants to contemplate. The aim of the mini-poster was to encourage participants to consider whether they might be entering a time of changed climate, and to elicit what they thought their future as irrigation farmers might be in the face of potentially lower rainfall.
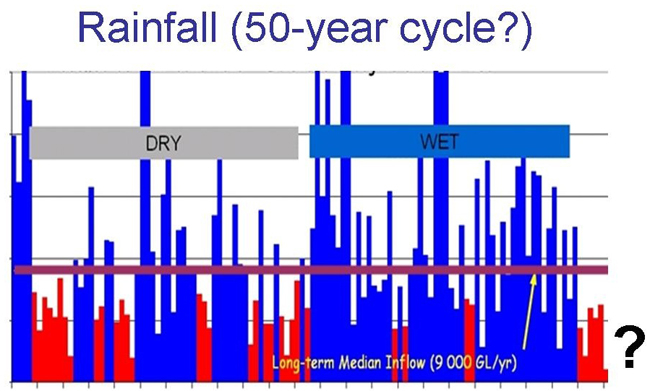
Graphic 2: 50-year wet and dry periods (adapted from YOUNG & McCOLL, 2008, p.12) [17]
The third mini-poster (see Graphic 3) contained a chart displaying the amount of water held in the storages of the MDB, plotted against the irrigation allocations that South Australian MDB reliant irrigators had received since the 2000 irrigation season. The declining amount of water held in storage was caused by drought-induced low inflows, and was the reason for the government reducing water allocations to irrigators from 2005. [18]
This chart was used to initiate discussions with participants on the level of irrigation allocations that they anticipated in the future since the past certainty of 100% of allocations had been replaced with yearly uncertainty in their water allocations. This was expected to lead to discussions around what they thought their businesses prospects would be with lower irrigation allocations.
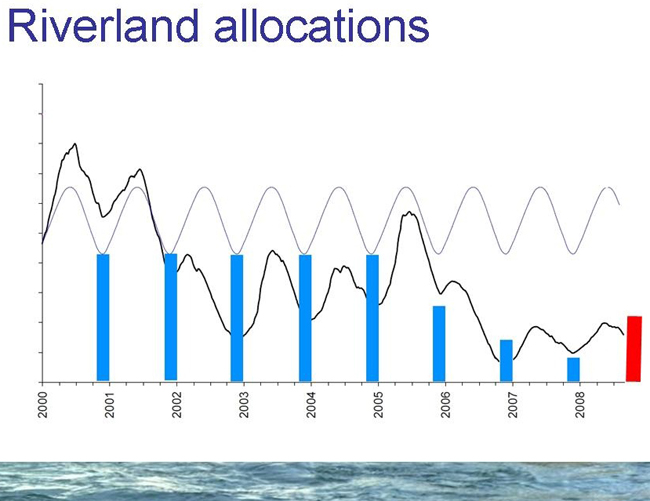
Graphic 3: Water in storage and irrigation allocations (adapted from MURRAY-DARLING BASIN AUTHORITY, 2009b, p.4) [19]
The fourth mini-poster (see Graphic 4) presented a table (CONNOR, KIRBY, SCHWABE, LUKASIEWICZ & KACZAN, 2008) showing the potential irrigation water allocations that South Australian irrigators could expect from the combination of four climate change scenarios and the water availability resulting from four different climate variability (drought) scenarios. The information presented in this mini-poster was chosen because a locally relevant problem fosters more interest, attention and involvement and avoids fuelling misinformation, than if a generic problem is used (DONNELLY et al., 2009; GARDNER, DOWD, MASON & ASHWORTH, 2009). It was used to encourage participants to discuss their perceptions of climate change as a risk, and how that differed from the risk they faced from drought.
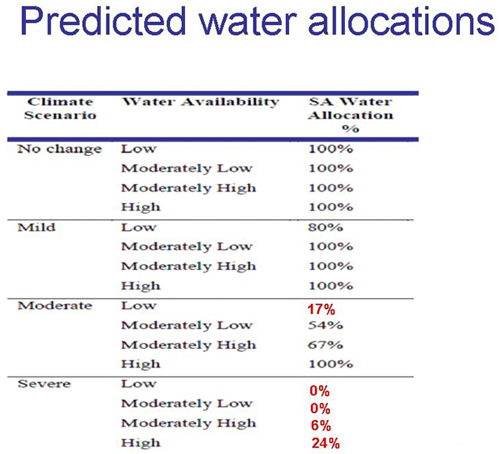
Graphic 4: Water allocations under different drought and climate change scenarios (CONNOR et al., 2008, p.28) [20]
The last mini-poster (see Graphic 5) consisted of two photographs of Lake Albert—the smaller of the two freshwater lakes that the River Murray flows into before entering the sea. One photograph was taken in 2007 before the drought had worsened and the decision to lower the weir pool level had been made. The other was taken in 2009 after the impacts of the drought were felt and the level of the lake had fallen. Allowing the level of the lakes to fall was a government decision to ensure that water remained available for human consumption. [21]
These photographs were included to illustrate the point that the declining amounts of water in the river needed to be shared between competing uses; agriculture, human uses and the environment. They were also used to imply that irrigators' use of water has an environmental effect and to elicit how they felt about those effects, and their role, if any, in causing the problem.
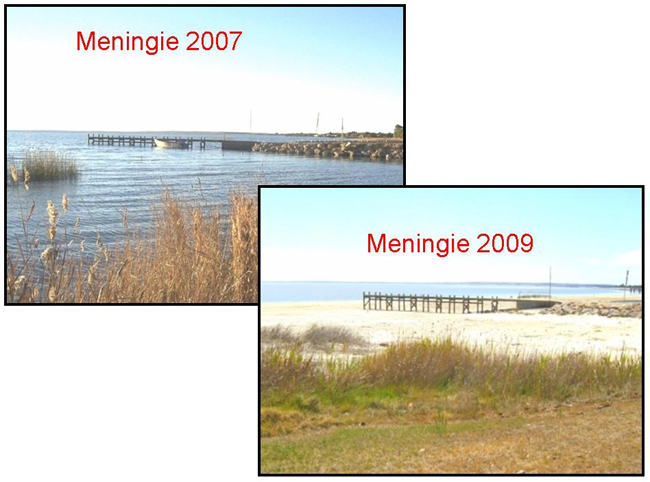
Graphic 5: Before and after photographs of the Meningie jetty, Lake Albert (Photographs by author) [22]
The mini-posters were introduced during the course of the interviews and shown to interviewees in the same sequence. This allowed an inferred argument built on the ideas presented in the mini-posters to emerge. These were that: 1. the situation for irrigators is poor, 2. it could get even worse, 3. the evidence shows that it is getting worse, 4. if it does deteriorate further the effects could be severe, and 5. other users of water including the environment are also being affected. [23]
The average number of words transcribed from each interview was 9,069, with 3,056 or about a third being associated with the graphic-elicitation component of each interview. The primary intention of the study was not to evaluate the use of the graphic-elicitation method, but it was to gather information on farmers' adaptation responses to climate change. However, due to the novelty of the graphic-elicitation method this article examines both the form of the enquiry and the results gained from undertaking the enquiry. This next section discusses the interview results from each mini-poster in turn; as well as presenting illustrative quotes from the interviews. [24]
3.1 First mini-poster: MDBA "Drought Update"
The Murray-Darling Basin Authority (MDBA) was set up by the Australian government to integrate the management of the basin's water resources. The MDBA "River Murray—Drought Updates" publication presented unemotional descriptions of the state of the water resources in the Murray-Darling Basin and authoritative predictions for future water availability for use by irrigators and others. This mini-poster prompted interviewees to state their varying beliefs about their current situation. One participant perceived the photograph through an optimistic lens, "... that looks quite positive to me actually, even though, you know, the water levels could be higher ..."(f1)2). [25]
Other participants appeared to ignore the photograph and responded to the negative sentiment represented by the abstracted text. One suggested that,
"the drought will break. It always has, and it always will. Albeit for not as long as the time before, or whatever, and I do believe there's climate change ... I don't necessarily believe that carbon pollution is the reason for it" (f2). [26]
This comment about carbon pollution arose because farmers prefer to believe that carbon is not contributing to climate change. In addition farmers feel that the expectations on them for reducing carbon pollution are not being equally shared with other members of society (DONNELLY et al., 2009). [27]
Another participant also focused on the highlighted text and provided an optimistic prediction of when the outlook for irrigation water availability would change from being poor (as the mini-poster suggested), by stating, "you know, things can change. I mean that's dated the thirteenth of November, and we were sort of expecting that our water allocation would remain at 48%. It's got to go to 60%" (f3). (This participant's optimistic outlook was endorsed when water allocations rose to 55% in February 2010, two months after the interview). [28]
Responding to the language used in the title—drought update—one interviewee expressed an opinion on whether the low water allocations were caused by government actions or climate variability:
"Well, I'm not sure if the position that we are in is drought or over-allocation ... if you had a look at what was allocated ten years ago it's vastly different to what it is now. That's my thoughts on climate change because I don't believe that's all to do with drought" (f4). [29]
This was an important distinction for irrigators to make because if it is over-allocation it means that the shortage of water might have been avoided by different government decisions, but if it is drought it cannot be avoided and can only be adapted to. One participant who accepted that it was drought suggested that the effects were exacerbated by the actions of upstream irrigators, "... there is a drought, there is no doubt about it ... it's quite possible that the effects of the drought could be alleviated to some degree, had there not been overuse, and over allocation" (f11). [30]
Another participant focused on the meaning of the abstracted text, and explained that he expected the reduced allocations to affect his business choices, when he said, "we look at the drought as an issue with water, and we respond the best we can. Because we've got permanent crops, we recognize that we can't afford to let our trees die" (f9). [31]
The first mini-poster elicited participants' views on drought issues and introduced them to the notion of discussing images during the interviews. This mini-poster was the least contentious and the least challenging of the mini-posters. Participants viewed the mini-poster in different ways, some focused on the image and others focused on the text. Some used the opportunity to present their view of the causes and effects of climate change. Others presented their thoughts on the cause of the low water allocations, how the reductions were exacerbated by actions of other irrigators, and the effects that the low water allocations had on their irrigation businesses. In the same way that this mini-poster was designed to be a starting point from where the interview would introduce further ideas it seemed that participants were also claiming a position in preparation for expanding and developing their own arguments around climate change. Taking this position might have been done for several reasons, it might have made their activities more intelligible, it might have changed their position of power, or it could have been that it allowed them to express their personal identity by referring to their unique point of view (HARRE & LANGENHOVE, 1999). [32]
3.2 Second mini-poster: 50-year wet and dry periods
Conceptualising the MDB rainfall of the last hundred years as wet and dry periods of fifty years each presented the idea that irrigators might need to contemplate a future with less water available for irrigation. [33]
Some viewed the mini-poster with reluctant acceptance of the chart's credibility, but others maintained a questioning attitude that meant that they did not need to contemplate lives other than as farmers: "I always think, 'well what was before that?' But you know it is fairly convincing though, isn't it? Who knows? I don't know. But you couldn't decide to just pack up and leave based on that, I don't think" (f1). This interviewee's response demonstrated that the information presented in the mini-poster had authority and credibility. It is unlikely that the information in the chart could have been explained so well verbally. Another participant accepted the information, but tried to interpret it in a positive way, stating: "well it's interesting isn't it, there sure were a lot of dry periods but there were also wetter periods in that time ..." (f2). [34]
Another more sceptical participant chose to criticise the authority of the chart, stating, "... what annoys me most about it is that the people who are running this are all economists. What do they know about it?" (f3). Another participant raised a similar criticism, saying: "... I think it's mostly guessing ... too often people read whatever they want to read, you know it's like ringing up a psychic on the radio" (f6). [35]
Some participants appeared to miss seeing the entirety of the message presented in the chart and only saw in the chart that which was most conducive to them maximising their self-esteem. This is understandable—especially in a study group under such stress—because people have a fierce desire to feel good rather than bad and therefore take those actions that are needed to allow them to maintain sufficient self-esteem to cope with downturns (BAUMEISTER, 1999; KUNDA & SANTIOSO, 1989). [36]
Interpreting the wet and dry periods of the chart in a way that gave hope for the future, one interviewee observed, "so it has happened before. That's interesting. Who knows? it could be a cycle. It would be nice" (f8). This participant was happy to think that the reduced water availability was part of a cycle that might include a return to more favourable conditions in the future. [37]
Voicing uncertainty one participant said,
"... I really am a bit sceptical about what ... they are saying. ... I am not saying that we human aren't having an effect on the environment ... but I don't think it's the total reason why a lot of things are happening" (f5). [38]
These comments were endorsed by the cautious observations that climate change only has a slight influence on the drought at that time (HUNT & ELLIOTT, 2004). [39]
Accepting the credibility of the chart but questioning its usefulness for predicting climate in the future, one participant suggested: "yes, yes, you can't deny it. What I would like to see is the one hundred years before that, and the thousand years before, we don't know. We don't know, it's a very short timeline" (f11). [40]
Embracing the principal message from the chart and explaining how it would influence his adaptation response, one interviewee explained: "if we're gonna go into a dry fifty-year and warmer climate, then over the next fifty-years my variety choices will be different" (f9). [41]
Participants found the second mini-poster easy to understand and easy to respond to. It provoked discussion with some accepting the credibility and authority of the chart and others questioning it. Others attempted to interpret the messages presented in the chart in such a way that they could maintain their sense of well-being. They selectively took the meanings that they wanted from the mini-poster to support their farm and life goals so that they could retain hope for the future. [42]
3.3 Third mini-poster: Water in storage and irrigation allocations
The chart from the third mini-poster illustrated the relationship between the amount of water held in the storages of the Murray-Darling Basin and the annual water allocation received by those South Australian irrigators reliant on water from the River Murray. [43]
Not all participants readily accepted the credibility of the chart. One stated, "well, that line's looking better but that line doesn't convince me" (f1). Another was encouraged by the fluctuations in water storage levels to discuss the problem of past water mismanagement:
"Well, there's no doubt that the river systems are way, way over allocated because of the complacency from that wet period [pointing at chart], and this wet period [pointing at chart] ... where they were allocating more water than they actually had" (f2). [44]
Discussing the events leading to their current business outlook one participant suggested: "well, you know that my hopes for the future aren't all that great. But, you know, if you look at your line here ... that's when our troubles began" (f3). Another interviewee was not hopeful for improved water availability observing : "I've seen all this many times and once you've got below the threshold ... from this point on ... we are going to constantly forever struggle to recover" (f7). [45]
The difficulty of achieving water reform when the decisions are made by elected representatives was identified by one interviewee, who commented: "politics ... they can only see their term; they can't see the big picture. You can't have a three year outlook on something like this ..." (f6). [46]
Interpreting the chart according to the level of restriction in water allocation that they could expect in the future, one participant stated, "oh, I expect at least for the next couple of years it will be still be a percentage of allocation around probably 50-60%" (f9). [47]
The mini-poster showed the reduced water allocations that participants would have already been acutely aware of. The chart's novel information was the visual presentation of the relationship between the storage levels of water in the Murray-Darling Basin and low irrigation water allocations. The mini-poster encouraged participants to reflect on their current situation and to consider their future prospects. Participants questioned some of the information presented in the mini-poster and commented how in their perception the government had made poor choices with water allocations. [48]
3.4 Fourth mini-poster: Water allocations under differing drought and climate change scenarios
The table used in the fourth mini-poster (see Graphic 4) displayed sixteen water availability scenarios from the combination of four climate change and four climate variability (drought) alternatives. It showed that water availability would decline under eight of the sixteen potential combinations and that five of those combinations would lead to severe reductions in water availability. The implications of the potential reductions were quickly recognised by one interviewee who said:
"Even if it was forty-eight percent allocation you couldn't keep it up. So a lot comes back to the prices we get for what we grow ... you can tolerate a year or two of problems of any kind but if it's ongoing and getting worse it's harder, isn't it?" (f1) [49]
Accusing the Australian Government of setting allocations independent of the information provided in the chart one participant said: "the only comment I can make there is that I believe that the government will play with allocations to achieve stuff politically in the cities" (f2). Another emphasised that the resolve of the Australian Government in pursuing water reform was more important in determining the amount of water that irrigators received than any effects from climate change: "What will determine our water allocations is if the Federal Government can ... stop all this over irrigation ... that's our problem. Not climate change" (f3). [50]
The table provoked a comment on the expected changes to water management practices: "... no matter what happens for me ... we will be buying water every year ... and I don't think we'll ever return to the days where we've just got one hundred per cent" (f6). [51]
Accepting the credibility of the information presented in the table another participant explained how the various scenarios would affect his business and the businesses of others over time:
"... it's the speed of change and if we move from there to there [pointing at table] in three years you're going to have a hell of a lot of casualties. If we move from there to there in three years and from there to there in ten years and there to there in the next ... well then people will cope with it" (f7). [52]
One interviewee was sceptical of the table's best case scenarios and explained how irrigators now expect to start their irrigation season with uncertainty as they only know the final amount of allocation that they will receive towards the end of the year: "... these days they'll always start on the 1st of July low, and it will be just see how the year goes. I don't think they'll be giving us a hundred percent" (f8). The water availability expectations had been lowered for another participant who suggested that "... we'll get less ... that would be more or less the case in the next probably twenty years" (f9). [53]
The mini-poster helped elicit perceptions of the government's role in the setting of water allocations. The chart made the existing and potential changes to water availability more visible to participants. The effect on many of the interviewees was to elicit scepticism of the best case scenarios and uncertainty regarding the worst case scenarios. It avoided some of the problems that can occur with the communication of the effects of climate change when the images that are conveyed are not what farmers experience on their properties. When the predictions of dramatic consequences from climate change do not ring true for them, they do not believe there is a problem to address (VANCLAY, 2004). Interviewees were readily able to understand the information presented in the mini-poster and apply it to their own circumstances. [54]
3.5 Fifth mini-poster: Before and after photographs of Lake Albert
These photographs illustrated the environmental effects of the drought and the over-allocation of irrigation water. The before and after photographs presented the information in a way that could neither be ignored nor argued against—it was clear that the water level in the lake had fallen. What interviewees were able to challenge was the cause of the problem and the best way to respond to it. Commenting on the photograph of the drying lake one interviewee reflected:
"I'm sure that's happened before but not for the extended periods of time. We've got absolutely no future up here unless it looks like that [the pre-drought photograph of Graphic 5] all the time ... But yeah, I don't like the look of that. And I don't think that anyone that looked at that photo would've liked it" (f1). [55]
One participant described how having the environmental problems made so visible3) was necessary for provoking policymakers to take action, suggesting:
"Well it's a terrible thing to see, but at the same time it was inevitable. Because if it kept raining in the catchment they would just allocate more and more water, and more and more would be extracted and this was always going to happen one day" (f2). [56]
The contrasting photographs of the lake did not always lead to the same conclusion. One presented an argument that absolved him from feeling any responsibility: "... I feel sorry for them, but you know, before white man got here the seawater would have come in there regularly" (f3). The flaw in this argument is that before the construction of the barrages which created the fresh water lakes and the locks and weirs that maintain the water level, the river would have been dry or at very low levels during periods of drought, and water would also have been unavailable for irrigators. Others suggested that with increased water scarcity and with increasingly valuable water, the lakes may need to be returned to saltwater: "I don't think we have enough water in Australia to let [such a large amount of water] evaporate. It's a hard call isn't it?" (f4). Regardless of what participants thought had caused the problem the photographs evoked empathy for those affected by the low water levels. One stated: "... oh my God—poor buggers—don't you feel sorry for them ... it didn't take long did it? ... Yeah ... what can I say about it?" (f5) [57]
Reflecting on the history of actions leading to the deteriorating environmental situation one uncertain interviewee stated:
"Yeah environmental disaster isn't it? ... I've often thought we've managed the lakes over a very long time since the twenties where we put the barrages in and we stopped inflows from the sea, the coming and going of the tides through the area ... and we continued to extract water out of the river until we got to this situation. I don't know what's right anymore" (f7). [58]
The last sentence of this quote, "I don't know what's right anymore", shows how complicated the situation had become, with conflicting climate change messages, changing societal expectations overlaid with an unfavourable business environment. [59]
The relationship between the use of water from the river for irrigation and the absence of river water flowing into the lakes was not identified during the interviews. One participant said: "yes, it's terrible down there ... It's quite sad, really. But yeah, if there's no water, there's no water" (f8). [60]
This last mini-poster encouraged interviewees to express their feelings about the environmental effects of low river flows. They suggested that the images of the drying lakes acted as a catalyst that encouraged the wider community to focus on the problems of the Murray-Darling Basin. The mini-poster mostly led to pessimistic comments about the future of the lakes. No one acknowledged that their water use was one part of a relationship that required water to be shared between economic, environmental and social uses. It seemed that most interviewees were motivated by self-interest; acting in a way to ensure the survival of their business. But this belies the full significance of the self-interested approach, which is that the survival of a farmer's business is intimately tied to their sense of self. While self-interest could be seen as a regard for one's own interest at the same time as a disregard for the interests of others it seems that if participants did not exhibit this level of self-interest, their behaviour would be self defeating (BAUMEISTER, 1999). [61]
3.6 How participants viewed the mini-posters
The results from the use of graphic-elicitation showed that participants responded in a range of ways. This may have been because when a person approaches attitudinal survey questions (and probably also when they are asked to comment on visual images) they:
"[f]irst interpret the attitude question, determining what attitude the question is about. They then retrieve relevant beliefs and feelings. Next, they apply these beliefs and feelings in rendering the appropriate judgment. Finally, they use this judgment to select a response" (TOURANGEAU & RASINSKI, 1988, p.299). [62]
Even though they faced most unfavourable business conditions from the prolonged drought and low commodity prices, the interviewees had a powerful desire to feel good, and to believe they were involved in an undertaking that was worthwhile. They were motivated to perceive all of the images in a way so they could think of themselves, the work they did, and their future prospects in a favourable fashion, allowing them to enhance their self-worth and their self-esteem (BALCETIS & DUNNING, 2006). A focus on their desperate financial situation would have worked against this aim. This meant that some of their arguments against climate change may have been mounted to maintain their self-esteem even if their underlying beliefs were different. Not all wished to dispute the information provided in the mini-posters. Two participants (f7 and f9) who were more conciliatory toward the mini-posters' information had already made adaptation responses and appeared to be among the more financially and managerially resilient of participants. [63]
Graphic-elicitation's effectiveness depends on whether the images are readily interpreted in a way that is in concert with the aims of the research. Sometimes the images will not be fully understood or will be understood in a perverse and unintended way because the way that viewers interpret images will be related to their background, experiences and interests, and the events occurring in their life at the time of the interview. [64]
The results of this study show that participants could view the same mini-poster in entirely different ways. Two participants (f1 and f5) perceived the first mini-poster (Graphic 1) through the lens of their previous experience and training. The abstracted text was ignored and instead their focus was on the native vegetation in the photograph, while other participants ignored the photographs and only commented on the text of the mini-poster. Participants were not making a choice between alternative interpretations, but were only seeing the interpretation that they wanted to see—which was the one that was more favourable to them (BALCETIS & DUNNING, 2006). [65]
Viewed in this way the images are providing a stimulus to the interviews, but it can be a different stimulus to that which was intended. The problem is that it interferes with establishing a consensus of understanding and does not help in uncovering the variations between people's understandings on the issue depicted in the graphic because they are considering different issues (CRILLY et al., 2006). [66]
The mini-posters with simple uncomplicated images were the easiest for irrigators to understand and to respond to. For example, Graphic 2 introduced a degree of doubt regarding the future climate that was immediately understood because of the question mark leading into the future. Graphic 5 was easily understood as showing the visible environmental effects of the drought because of the marked differences between the water levels in the two photographs. The study found that some beliefs that farmers hold about climate change are related to how they gain information about it. Because climate change is a complex topic farmers need to rely on experts to help them in developing an understanding of it, but, because farmers prefer to learn by experience this approach leaves them with incomplete knowledge and the potential for greater levels of scepticism. In addition farmers are becoming more empowered and more questioning so that science no longer automatically has credibility and legitimacy but is selectively used by them when it is consistent with their own understanding (VANCLAY, 2004). [67]
Another obstacle that farmers face in developing an understanding of climate change is that they interpret the information so they can retain their self-esteem and maintain hope for the future. By rejecting the idea that climate change is due to human activity they avoid the sense of impotence and futility associated with rapid changes to climate (DONNELLY et al., 2009). [68]
Farmers' approach to information about climate change could be perceived as irrational but from their point of view it may be a necessary belief that allows them to continue as they are, without making unsettling changes, or it may even be because they lack the necessary resources to make the changes. Because climate change threatens their existence and they do not want to stop being farmers or leave their land, enterprise, community or friends (DONNELLY et al., 2009), it appears that most participants selectively interpreted the information presented in the mini-posters to allow them to believe that the effects of climate change would be less damaging than predicted. They retain optimism by suggesting that the problems that they faced were caused by the slow pace of water reform and government mismanagement of water allocations, which are problems that can only be solved by others. [69]
In light of the effects of drought, low commodity prices and the spectre of climate change participants seemed resolved to living with much greater uncertainty than they had in the past; which has challenged their efforts to maintain an optimistic outlook and added to an increasingly pessimistic expectation for the future. [70]
The answer to the research question is not straightforward and is explained by the following discussion of the study results. [71]
This study aimed to better understand the beliefs that farmers held about climate change. The research results show that these beliefs are complicated. Even so, farmers mostly acknowledge that climate change is occurring, at least to some extent, but by maintaining some scepticism about climate change being caused by humans they have a protective device that allows them to preserve some optimism for their future. They feel that they are being blamed for climate change and if they acknowledge that it is due to human activity they also acknowledge their role in it (DONNELLY et al., 2009). [72]
Another aim of the study was to uncover and identify farmers' perceptions of their adaptation choices. Participants' management actions were targeted at their immediate problems; low water allocations and low commodity prices. Some had made management changes that an outsider would view as climate change responses but these were not deliberately made in response to climate change, instead, they were made to solve what they perceived as the more pressing problems of drought and low commodity prices. [73]
The final aim was to establish how participants' past and intended adaptation responses varied according to their beliefs about climate change. It appeared that those who were less restrained in their acceptance of climate change were those who had incorporated thinking about climate change into their decision-making. It seemed as though they were viewing the management decisions that they were making to problems other than climate change through a climate change awareness lens. Because they were prepared to think in this fashion, they were better able to articulate the management actions they had taken in terms of climate change adaptation responses. Their responses to climate change were not made because of a moral imperative or for ideological reasons, but because they expected a payoff in the future. This means that for those seeking to encourage farmers' uptake of climate change adaptation responses, the best approach may be to encourage farmers to gradually incorporate thinking about climate change into management decisions rather than expecting that farmers make stand alone pre-emptive adaptation responses. [74]
Graphic-elicitation has played a useful role in gathering the information needed to satisfy this study's aims and could have been expanded beyond only using five images. Other researchers could also find the use of graphic-elicitation rewarding, and might consider the following questions:
Why would graphic-elicitation be expected to offer any advantage over a standard interview?
What image might best represent the aspect of the research question that cannot be effectively conveyed through interview questioning?
What type of image should be used; drawing, chart, table, photograph or something else?
Is the participant's interpretation of the image likely to lead to multiple meanings or misinterpretation? Will the interviewer need to explain the image?
Is the image likely to be seen as authoritative and credible by the participant, and is this essential?
Is the image contentious to the extent that it could interfere with participants' acceptance of its credibility? [75]
My own study has shown that incorporation of the graphic-elicitation method in personal interviews is a useful method for encouraging deeper and more useful thinking about interview topics and is especially so when used with sceptical, marginalised and disaffected interviewees. The method has a lot to offer when interviewers want to focus the discussions of potentially uncooperative interviewees on topics that are difficult to explain or are contentious. This enhancement to an interview is achieved with little extra cost, but does require careful thought to choose the most useful and relevant images. [76]
This research was made possible by the eleven irrigators who were prepared to be interviewed and the support of the Department of Agriculture, Fisheries and Forestry's FarmReady Industry Grants, CSIRO, S.A. Murray-Darling Basin Natural Resources Management Board and Loxton to Bookpurnong LAP. The article is based on a paper first presented at the 2010 ACSPRI Social Science Methodology Conference.
1) This is in contrast to the 58% of Australian urban dwellers who believe human activity is causing climate change (DONNELLY et al., 2009). <back>
2) The eleven interviewees are referred to by the identifiers (f1) through to (f11). <back>
3) Even though it was difficult for them to look at the environmental problems highlighted by the photographs of the lake. <back>
Bagnoli, Anna (2009). Beyond the standard interview: The use of graphic elicitation and arts-based methods. Qualitative Research, 9(5), 547-570, http://www.sagepub.com/rose/Docs/Bagnoli.pdf [Accessed: June 12, 2013].
Balcetis, Emily & Dunning, David (2006). See what you want to see: Motivational influences on visual perception. Journal of Personality and Social Psychology, 91(4), 612-625, http://www.sozialpsychologie.uni-frankfurt.de/wp-content/uploads/2012/04/Balcetis-Dunning-2006.pdf [Accessed: June 12, 2013].
Baumeister, Roy (1999). The self in social psychology. Philadelphia: Psychology Press.
Bazeley, Patricia (2007). Qualitative data analysis with NVivo (2nd ed.). London: Sage.
Charmaz, Kathy (2006). Constructing grounded theory: A practical guide through qualitative analysis. Thousand Oaks, CA: Sage.
Connor, Jeffery; Kirby, Mac; Schwabe, Kurt; Lukasiewicz, Anna & Kaczan, David (2008). Impacts of reduced water availability on Lower Murray irrigation, Australia. SEED Working Paper Series, 2008-2, CSIRO Sustainable Ecosystems, http://ideas.repec.org/p/cse/wpaper/2008-02.html [Accessed: June 12, 2013].
Corbin, Juliet & Morse, Janet (2003) The unstructured interactive interview: Issues of reciprocity and risks when dealing with sensitive topics. Qualitative Inquiry, 9(3), 335-354, http://members.shaw.ca/dlecky/masters/ed561/narrative/unstructured_interviews_on_sensitive_topics.pdf [Accessed: June 12, 2013].
Corbin, Juliet & Strauss, Anselm (2008). Basics of qualitative research: Techniques and procedures for developing grounded theory. Thousand Oaks, CA: Sage.
Crilly, Nathan; Blackwell, Alan & Clarkson, John (2006). Graphic elicitation: using research diagrams as interview stimuli. Qualitative Research, 6(3). 341-366.
Donnelly, David; Mercer, Rob; Dickson, Jenny & Wu, Eric (2009). Australia's farming future final market research report: understanding behaviours, attitudes and preferences relating to climate change. Australia's farming future market research—final report 2009. Sydney: Instinct and reason: 1-92, http://www.daff.gov.au/__data/assets/pdf_file/0010/1879885/aus-farming-future-mrr.pdf [Accessed: June 12, 2013].
Ezzy, Douglas (2002). Qualitative analysis: Practice and innovation. Crows Nest: Allen and Unwin.
Gardner, John; Dowd, Anne-Maree; Mason, Claire & Ashworth, Peta (2009). A framework for stakeholder engagement on climate adaptation. Climate Adaptation National Research Flagship Working Paper, 3, 1-31, http://www.csiro.au/files/files/pph1.pdf [Accessed: June 12, 2013].
Glaser, Barney (1998) Doing grounded theory—Issues and discussions. Mill Valley, CA: Sociology Press.
Glaser, Barney & Strauss, Anselm (1989 [1967]). The discovery of grounded theory: Strategies for qualitative research. Newbury Park: Sage.
Hansen, James; Marx, Sabine & Weber, Elke (2004). The role of climate perceptions, expectations and forecasts in farmer decision making: the Argentine Pampas and South Florida. IRI Technical Report 04-01, The Earth Institute at Columbia University, http://cred.columbia.edu/cred/files/2012/02/HansenMarxWeber_ClimatePerceptions_2004.pdf [Accessed: June 12, 2013].
Harper, Douglas (2002). Talking about pictures: A case for photo elicitation. Visual Studies, 17(1), 13-26, http://www.nyu.edu/pages/classes/bkg/methods/harper.pdf [Accessed: June 12, 2013].
Harre, Rom & Langenhove, Luk van (1999). Positioning theory: moral contexts of international action. Malden: Wiley-Blackwell.
Hunt, Barrie & Elliott, Tracey (2004). Interaction of climatic variability with climatic change. Atmosphere-Ocean, 42(3), 145-172, http://www.tandfonline.com/doi/pdf/10.3137/ao.420301 [Accessed: June 12, 2013].
Jenkings, K. Neil; Woodward, Rachel & Winter, Trish (2008). The emergent production of analysis in photo: Picture of military identity. Forum Qualitative Sozialforschung / Forum: Qualitative Social Research, 9(3), Art. 30, http://nbn-resolving.de/urn:nbn:de:0114-fqs0803309 [Accessed: June 12, 2013].
Knoblauch, Hubert; Baer, Alejandro; Laurier, Eric; Petschke, Sabine & Schnettler, Bernt (2008). Visual analysis. new developments in the interpretative analysis of video and photography. Forum Qualitative Sozialforschung / Forum: Qualitative Social Research, 9(3), Art. 14, http://nbn-resolving.de/urn:nbn:de:0114-fqs0803148 [Accessed: June 12, 2013].
Kuehne, Geoff (in press). How do farmers' climate change beliefs affect adaptation to climate change? Society and Natural Resources.
Kuehne, Geoff; Bjornlund, Henning & Loch, Adam (2010). Why do farmers make non-profit decisions? Investigating decisions made during drought. RIRDC Publication, 10-075, Australian Government, https://rirdc.infoservices.com.au/items/10-075 [Accessed: June 12, 2013].
Kunda, Ziva & Santioso, Rasyid (1989). Motivated changes in the self-concept. Journal of Experimental Social Psychology, 25(3), 272-285.
Murray-Darling Basin Authority (2009a). River Murray System—Drought Update 21. Canberra: Murray-Darling Basin Authority, http://www.mdba.gov.au/sites/default/files/archived/drought-update-November-2009.pdf [Accessed: June 12, 2013].
Murray-Darling Basin Authority (2009b). River Murray System—Drought Update 19. Canberra: Murray-Darling Basin Authority, http://www.mdba.gov.au/sites/default/files/archived/drought-update-June-2009.pdf [Accessed: June 12, 2013].
Saks, Mike & Allsop, Judith (2007). Researching health: Qualitative, quantitative and mixed methods London: Sage.
Tourangeau, Roger & Rasinski, Kenneth (1988). Cognitive processes underlying context effects in attitude measurement. Psychological Bulletin, 103(3), 299-314, http://business.illinois.edu/shavitt/ba_531/tourangeau.pdf [Accessed: June 12, 2013].
Vanclay, Frank (2004). Social principles for agricultural extension to assist in the promotion of natural resource management. Australian Journal of Experimental Agriculture, 44(3), 213-222, http://www.publish.csiro.au/?act=view_file&file_id=EA02139.pdf [Accessed: June 12, 2013].
Varga-Atkins, Tunde & O'Brien, Mark (2009). From drawings to diagrams: Maintaining researcher control during graphic elicitation in qualitative interviews. International Journal of Research and Method in Education, 32(1), 53-67, http://www.tandfonline.com/doi/pdf/10.1080/17437270902759998 [Accessed: June 12, 2013].
Young, Mike & McColl, Jim (2008). A future-proofed basin: A new water management regime for the Murray-Darling Basin. Report, University of Adelaide, http://www.myoung.net.au/water/droplets/A_future-proofed_Basin.pdf [Accessed: June 12, 2013].
Geoff KUEHNE is a social researcher working on understanding the influences on farmers' decision making other than a simple assumption of profit maximisation. He has conducted research examining farmers' beliefs about climate change and how those beliefs influence their actions. He has worked with irrigators in the cotton, wine, and dairy industries, often during turbulent periods of significant change resulting from collapses in commodity prices, government reforms, or changing societal expectations.
Contact:
Geoff Kuehne
CSIRO-Ecosystem Sciences
PMB2
Glen Osmond
SA 5064
Australia
Tel.: +61 417831591
E-mail: geoffkuehne@gmail.com
URL: http://www.geoffkuehne.com/
Kuehne, Geoff (2013). "I Don't Know What's Right Anymore": Engaging Distressed Interviewees Using Graphic-Elicitation [76
paragraphs]. Forum Qualitative Sozialforschung / Forum: Qualitative Social Research, 14(3), Art. 2,
http://nbn-resolving.de/urn:nbn:de:0114-fqs130321.

Creative Commons Attribution 4.0 International License