Volume 18, No. 3, Art. 14 – September 2017
Anchored Calibration: From Qualitative Data to Fuzzy Sets
Nicolas Legewie
Abstract: Combining qualitative data and qualitative comparative analysis (QCA) holds great analytic potential because it allows for detailed insights into social processes as well as systematic cross-case comparisons. But despite many applications, continuous methodological development, and some critique of measurement practices, a key procedure in using qualitative data for QCA has hardly been discussed: how to translate, or "calibrate," the information in qualitative data into formalized fuzzy sets? This calibration has crucial impact on QCA results. Hence, reliability of calibration is a decisive factor in a study's overall quality and credibility. I develop "anchored calibration" as an approach that addresses important gaps in prior approaches and helps enhancing calibration reliability. Anchored calibration involves three steps: conceptualizing conditions and outcome(s) in a systematic framework, anchoring this framework with empirical data pieces, and using the anchored framework to assign membership scores to cases. I present the tasks necessary to complete these three steps, drawing examples from an in-depth interview study on upward educational mobility.
Key words: qualitative comparative analysis; QCA; qualitative research; calibration; qualitative data; fuzzy set methodology; best practice; multi-method research; anchored calibration
Table of Contents
1. Introduction
2. Fuzzy Sets and Calibration
2.1 On fuzzy sets
2.2 Calibration of fuzzy sets for qualitative data: State of the art and missing pieces
3. Anchored Calibration
3.1 Constructing a calibration framework
3.1.1 Formulating concept trees
3.1.2 Determining relevant variation
3.1.3 Defining characteristics
3.2 Applying the calibration framework to the data
3.2.1 Sorting data pieces
3.2.2 Defining data anchors
3.2.3 Minimizing grey zones
3.3 Assigning membership scores in conditions and outcome(s)
3.3.1 Scoring cases on indicator-level dimensions
3.3.2 Documenting ambiguous scoring decisions
3.3.3 Defining rules of aggregation
4. Conclusion
QCA is well established in comparative politics, business research, economics, and sociology (RIHOUX, ÁLAMOS, BOL, MARX & REZSÖHAZY, 2013). It is particularly useful for studying complex social phenomena, in which different combinations of explanatory factors ("conditions") can lead to a given phenomenon or event ("outcome"). This makes QCA especially attractive for scholars employing qualitative data that provide detailed, context-rich information on processes, mechanism, and the production of meaning (MAHONEY, 2010, p.124; for applications, see HOLLSTEIN & WAGEMANN, 2014; METELIS, 2009; NASSAUER, 2012; SMILDE, 2005; SMITH, 2010 among many others). Combining QCA and qualitative data allows for in-depth yet systematic analyses of social processes. [1]
But scholars cannot simply "plug in" data such as in-depth interviews, field notes, or visual footage. To run its analysis, QCA requires researchers to "calibrate" membership in conditions and outcome(s), i.e., make informed, justifiable choices based on their data and theoretical knowledge regarding the presence or absence of relevant conditions and outcomes in the empirical cases under study. This "calibration" is a crucial process because it impacts strongly QCA results. Therefore, researchers should use systematic steps and rules for assigning membership, and these steps and rules should be transparent to readers (GLAESSER & COOPER, 2014).1) Otherwise, calibration becomes idiosyncratic, arbitrary, and/or arcane. The challenges of assigning membership scores are compounded when using QCA with qualitative data, because of "the ambiguity, subtleness, and context-dependence" of qualitative data (SIVESIND, 1999, p.361). How can researchers accomplish systematic and transparent calibration, but also do justice to the richness of qualitative data? [2]
Despite its crucial importance and the described challenges, there is hardly any methodological discussion on calibration of qualitative data. Many published articles that employ qualitative data in QCA do not document their calibration procedure sufficiently for readers to be able to assess its quality (e.g., AMENTA, CAREN, OLASKY & STOBAUGH, 2009; CROWLEY, 2013; SMILDE, 2005). The only existing publication is BASURTO and SPEER's (2012) guideline to conducting qualitative research with QCA. The authors provide useful insights, but regarding calibration their guideline lacks crucial elements. One missing element is a discussion of conceptualization, which is a key aspect of calibration. Moreover, the authors do not discuss calibration of concepts that capture complex processes or the production of meaning, thereby missing a key potential of qualitative data. [3]
In this article, I develop "anchored calibration" as a new approach to calibration of qualitative data. Anchored calibration offers a more complete approach to calibration of qualitative data because it focuses specifically on conceptualization and the capture of semantic qualitative concepts. The approach consists of three steps: 1. constructing a calibration framework, 2. applying the calibration framework to the data, and 3. assigning fuzzy membership scores in conditions and outcome(s) to the cases. Each step in turn consists of three tasks. Together, these steps and tasks provide a detailed guideline for calibrating fuzzy sets from qualitative data in a systematic and transparent way. They can be incorporated into the iterative process of qualitative research after traditional data coding and analysis and before running QCA. [4]
Throughout the article, I use examples from a qualitative interview study on upward educational mobility (LEGEWIE, 2015, 2016). The goal was to capture the role of personal network factors in students' educational attainment. I coded the data using Atlas.ti and employed QCA to identify combinations of conditions that fostered upward educational mobility. The study provides useful examples because it included concepts revolving around self-perception, narratives, and goal orientations (see below). Such concepts are hard to formalize and thus challenging for calibration. They can hence help illustrate the strengths of anchored calibration in calibrating such concepts systematically and transparently.2) While interviews will be the data material and individuals the unit of analysis, anchored calibration works just as well with other data types (e.g., visual data or field notes) or other units of analysis (e.g., organizations or events). [5]
Before discussing anchored calibration step-by-step, I will briefly introduce the notion of fuzzy sets and reflect on the state of the art in calibrating qualitative data. [6]
QCA3) uses sets to capture outcomes and conditions. Sets distinguish entities such as individuals, organizations, or nation states based on a relevant feature.4) For instance, nation states as a base set might differ in the degree to which their governments are democratic; we can describe nation states according to their membership in the fuzzy set "democratic governments." In the study on upward educational mobility introduced above (LEGEWIE, 2016), one concept of interest was "strong promotive narrative," which describes shared stories that students and members of their personal networks construct through recurrent conversations. These stories include coherent interpretations of the students' lives (the family history, the role in the family and society) and/or living situation. Research suggests such narratives foster upward educational mobility by leading to students internalizing norms of school success and by serving as guidelines to managing social relations (LEGEWIE, 2016; also see LOUIE, 2012; SMITH, 2008 for earlier conceptions of this phenomenon). A set "strong promotive narrative" distinguishes between individuals or families that show a strong narrative from individuals or families who do not, as well as more subtle degrees in between those two poles. [7]
In contrast to most qualitative research, fuzzy sets formalize concepts by representing membership numerically. In contrast to variables common in statistical analyses, sets add qualitative distinctions and context information to the gradual differences of interval scales. Thus, a qualitative concept could describe the construction of meaning entailed in promotive narratives. An interval-scale variable could show how strongly a student adopts this construction, e.g., by aggregating responses on items from a survey battery into a single continuous variable. A fuzzy set could combine both perspectives: it includes qualitative thresholds (e.g., what constitutes a strong and durable promotive narrative) while also capturing gradual differences between cases, e.g., in strength and durability of the narrative. [8]
A set's numerical values reflect type and degree of membership in a concept such as "promotive narrative." Degree of membership in fuzzy sets is broadly defined by three "qualitative anchors": full membership, full non-membership, and a crossover point (RAGIN, 2008, p.33). The first two describe a given phenomenon or event being entirely present or absent, respectively. The latter defines the point of maximum ambiguity between them, when a phenomenon or event is neither present nor absent. Between these qualitative anchors lies a continuum of membership. That is, empirically cases will range between the points of full membership (with a membership score of 1.0) and full non-membership (0.0). A fuzzy set can have any number of membership levels from three to a continuous scale. When using qualitative data, researchers often employ four or six-level sets (e.g., 0.0, 0.25, 0.75, and 1.0 for the four level set). [9]
Calibration refers to the process of assigning membership scores in abstract concepts to cases (e.g., individuals, organizations, events) based on empirical data and theoretical knowledge. This process provides the input for QCA. It is thus crucial in applying the method. [10]
2.2 Calibration of fuzzy sets for qualitative data: State of the art and missing pieces
Transparent documentation of calibration procedures is not yet a common practice in QCA research based on qualitative data. Many published articles that employ qualitative data in QCA do not document their calibration procedure sufficiently for readers to be able to assess its quality (e.g., AMENTA et al., 2009; CROWLEY, 2013; SMILDE, 2005). This does not mean that such papers use flawed calibration procedures; only that the procedures are somewhat lacking in transparency. [11]
One reason for this lack of detailed documentation may be that calibration of qualitative data has hardly been discussed in the methodological literature. The only publication providing insights into calibration from qualitative data5) comes from the fields of sustainability and cooperation studies: BASURTO and SPEER (2012) discuss calibration as part of an approach to mixed methods research design using QCA and qualitative data. Their approach involves six steps: 1. identifying measures for conditions and the outcome; 2. developing qualitative anchors and an interview guideline; 3. coding the interviews; 4. summarizing the interview data; 5. determining the precision of fuzzy sets and defining their scores; and 6. assigning fuzzy scores. [12]
BASURTO and SPEER give a number of helpful guidelines for calibration. Regarding the definition of fuzzy sets, the authors suggest to 1. choose the degree of precision of the fuzzy sets according to the level of detail of the data; 2. define fuzzy set values by drawing on theoretical concepts and in-depth interview knowledge and adapting it to the sociocultural context of the study; 3. define membership values by constructing imaginary ideal cases in the context of the universe of one's cases; and 4. aggregating measures in accordance with the theoretical concept and the particular research question. Concerning assignment of fuzzy membership values, the authors suggest 1. matching the information distilled on each case from the data with the defined fuzzy-set values; and 2. revising and adjusting the assigned fuzzy membership values by going through each measure across all cases and revising data analysis and fuzzy set definition if necessary (pp.165-168). [13]
With these guidelines, BASURTO and SPEER make important contributions to linking QCA and qualitative research. But their approach does not focus on calibration specifically, since the authors' main focus is to provide a guideline for conducting qualitative research with QCA. As a consequence, two vital issues of calibration remain underdeveloped. First, the authors spend relatively little time discussing how to conceptualize abstract notions as conditions and outcomes (p.165). However, conceptualization is a crucial part of calibration, especially with qualitative data. Conceptualizations need to bridge the gap between abstract notions and qualitative data, and construct conditions and outcome(s) in a fuzzy set format. These challenges call for a detailed discussion of conceptualization as part of producing calibration frameworks. [14]
Second, the calibration techniques that BASURTO and SPEER discuss do not tackle a typical challenge entailed in many uses of qualitative data for QCA. The authors focus on concepts for which information from qualitative data can be directly transformed into numeric values; e.g., the proportion of relevant groups that participated in a governance process (pp.165ff.; for a similar approach, see ONWUEGBUZIE & TEDDLIE, 2003). Such concepts are numeric in nature, which makes calibration relatively straightforward even when using qualitative sources; textual data provide information on events (participation or information flow in BASURTO and SPEER's example), and the proportion or frequency of such events distinguishes the different fuzzy membership scores. Hence, calibration much resembles that of interval-scale variables as described by RAGIN (2008) and others. [15]
But such straightforward calibration is impossible in many qualitative studies. Many concepts are semantic rather than numeric in nature, especially if they capture processes or the production of meaning (CAMPBELL, QUINCY, OSSERMAN & PEDERSEN, 2013, p.297). Using BASURTO and SPEER's example of governance processes, beyond the proportion of participating organizations researchers might be interested in how participation happened and what it meant to the people involved. When calibrating concepts that capture aspects, one cannot rely on an implicit interval scale for calibration. Instead, calibration requires rules that specify what range of statements or (inter)actions describe certain ways a process can unfold and should thus be subsumed under a given fuzzy membership score. For instance, was an organization merely attending meetings, or did its representatives have a real say in the outcome of the process? One cannot immediately transform qualitative information on such issues into numeric values. A more broadly applicable approach to calibration therefore needs to provide techniques for calibrating even semantic information in a systematic and transparent way. [16]
Anchored calibration offers a systematic and transparent approach to calibration of qualitative data. It focuses specifically on conceptualization and the capture of semantic qualitative concepts. The approach includes three steps: 1. constructing a calibration framework, 2. applying the calibration framework to the data, and 3. assigning membership scores in conditions and outcome(s). Each step entails three tasks that will be discussed in detail in the following sections. [17]
The approach should be understood as part of the iterative process characteristic of qualitative research. Getting calibration right may involve revisiting the different steps several times and going back to other phases of the qualitative research process. [18]
3.1 Constructing a calibration framework
Calibration requires clear concepts for conditions and the outcome, which allow translating information into membership scores in fuzzy sets. To serve this function, conceptualizations need to "connect an idea with something observable" (BECKER, 1986, p.261). They need to do so in a way that will later facilitate assignment of fuzzy membership scores. In this section, I describe three steps to construct a calibration framework: formulating concept trees, determining relevant variation, and defining characteristics. [19]
3.1.1 Formulating concept trees
Formulating a concept tree means to reflect on what specific elements conditions and outcome(s) consist of. The idea of multi-level concepts provides a useful template for this task (GOERTZ, 2006; GOERTZ & MAHONEY, 2005; for earlier work on this issue see SARTORI, 1970, 1984). It suggests breaking abstract notions down into more palpable secondary-level dimensions, and further into one or more indicator-level dimensions (GOERTZ, 2006, pp.240f.; also see BASURTO & SPEER, 2012, p.160; COPPEDGE, 1999; SAYLOR, 2013).6) [20]
Just like conditions and outcome(s) that will be used as QCA input, each secondary-level and indicator-level dimension can be conceived as a fuzzy set with two extreme poles, a crossover point, and a continuum in between. Concept structures thus take the form of hierarchical trees of fuzzy sets, in which lower-level fuzzy sets are dimensions of higher-level sets. Figure 1 illustrates this idea of concept trees, using the condition "promotive narratives" as an example. It should be noted that concepts do not necessarily need three levels with several dimensions each. Some concepts can be captured with a much simpler concept structure. Researchers should always aim for as little detail as possible, but as much detail as necessary to fully capture the concept at hand. The resulting conceptualization should be transparent, coherent, and adequately capture the complexity of social life or theoretical thought. [21]
In my conceptualization, the condition set "strong promotive narrative" encompasses two secondary-level dimensions: (1) a student's construction of education as a path to success and (2) a student's construction of a life project of mobility.
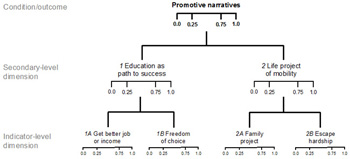
Figure 1: Exemplary concept tree (promotive narratives). Please click here for an enlarged version of Figure 1. [22]
Two indicator-level dimensions make up the first dimension: (1A) the notion of education as a means to achieve a better life (as opposed to alternatives such as careers in sports, music, self-employment, or crime), and (1B) the notion of education as a means to achieve freedom of choice in career paths. They constitute two alternative ways in which education is constructed as a path to success. The second dimension also has two indicator-level dimensions: (2A) construction of social mobility as a family project, and (2B) construction of a student's life as an endeavor in escaping socio-economic hardships by any means. They constitute two alternative ways in which upward social mobility is constructed as a central life goal. [23]
The concept trees for each condition and the outcome provide the basis for anchored calibration by breaking down abstract notions into indicator-level dimensions. As the following sections will show, much of anchored calibration deals with how to assign membership scores in indicator-level dimensions to cases. The last task will then define rules to aggregate systematically and transparently membership scores on the indicator level up the concept trees to membership scores of conditions and outcomes (see Section 3.3.3). [24]
3.1.2 Determining relevant variation
The second task in constructing a calibration framework turns to indicator-level dimensions and seeks to determine each dimension's relevant variation. This task is important because the theoretically possible variation of a phenomenon does not necessarily coincide with the variation relevant for a specific study (GLAESSER & COOPER, 2014; GOERTZ & MAHONEY, 2012, pp.144-148; GOERTZ, HAK & DUL, 2013; RAGIN, 2008, p.33). GLAESSER and COOPER (2014) show that decisions on relevant variation affect QCA results. The authors also demonstrate how calibrating for certain variation may help shedding additional light on the interplay of relevant factors in a data set. [25]
In the study on upward educational mobility, defining the outcome set of "upwardly mobile person" entailed deciding which levels of educational degrees matter conceptually for full membership and full non-membership. For instance, among respondents whose parents did not earn a high school diploma, it makes no conceptual difference whether a person earns a Master's degree or a doctorate; both constitute clear upward educational mobility compared to the parents level of education. So there might be areas of variation on a conceptual continuum, especially around the extreme poles, where variation does not matter conceptually for what needs to be captured. In outlining fuzzy sets, the researcher should focus on the variation that she or he deems relevant for the research question (GOERTZ & MAHONEY, 2012, pp.144-148). Figure 2 illustrates this point.
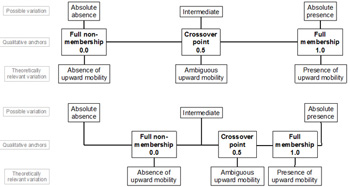
Figure 2: Relevant variation and fuzzy sets. Please click here for an enlarged version of Figure 2. [26]
Using the example of "person with stark upward mobility," the point of full non-membership might reflect the absolute absence, the crossover point might reflect an intermediate level, and the point of full membership the highest level of upward mobility (upper part of Figure 2); e.g., school dropout, finishing high school, and getting a doctoral degree, respectively. Here, the fuzzy set would capture the entire possible variation of upward mobility. In a different scenario, the researcher might set the bar lower for full membership (e.g., getting any university degree), but set the bar higher for the crossover point and full non-membership (e.g., a high school equivalent degree and a middle school degree as the respective threshold degrees). Here, even a level of upward mobility above intermediate mobility might fall below the crossover point for the fuzzy set condition of "upward mobile person" (see lower part of Figure 2). [27]
What variation is relevant in a given research context is a theoretical question. Formulating answers for these questions will later allow more precise sorting of data pieces into membership scores and, hence, more precise calibration. [28]
3.1.3 Defining characteristics
The third task is to provide detail to the indicator-level dimensions. Each fuzzy membership score of a given indicator-level set covers a range of states on the dimension's conceptual continuum. Just as calibrating interval-scale variables for QCA requires defining what range of values on a variable translates into what fuzzy set membership score, calibrating qualitative data requires defining what range of statements, observations, or other types of qualitative data pieces translates into what membership score. [29]
To define a membership score's range, a researcher should formulate "core" as well as "border" characteristics. Core characteristics reflect a membership score in its arche-typical form. Border characteristics refer to a state the score still includes just before the state would be captured by the adjacent score. [30]
In formulating core and border characteristics of an indicator-level dimension, researchers should reflect on what aspect drives the distinction between fuzzy membership scores. Helpful sources could be theoretical knowledge, scales from relevant survey items, as well as empirical findings from other studies. [31]
For instance, what would be a statement7) closest to full non-membership (score 0.0) of the indicator-level dimension set "family project," but still clearly pertaining to the "more out than in"-score (0.25)? Table 1 illustrates the idea of core and border characteristics of fuzzy membership scores, using the indicator-level dimension "family project" of promotive narratives as an example (as shown in Figure 1 in the previous section).
|
Membership score |
Characteristic |
|
|
Full membership (1.0) |
Core |
My parents struggled all the time, and all of it was for my sake. Only because of my parents' hard work I can achieve my goals. |
|
|
Border ↓ |
My parents struggled so much, and most of it was for my sake. Mostly because of my parents' hard work I can achieve my goals. |
|
More in that out (0.75) |
Border ↑ |
My parents struggled a lot, and much of it they did for me. My parents' hard work played an important part in me being able to achieve my goals. |
|
|
Core |
My parents often struggled, and it was for my sake, too. My parents' hard work played a part in me being able to achieve my goals. |
|
|
Border ↓ |
My parents struggled quite a bit, and some of it was for my sake. My parents' hard work contributed something to me being able to achieve my goals. |
|
|
Border ↑ |
My parents sometimes struggled, and maybe it was a little bit for my sake, too. My parents' hard work did help a little bit in me being able to achieve my goals, but not all that much. |
|
More out than in (0.25) |
Core |
My parents hardly struggled. My parents' hard work did not really play a role in me being able to achieve my goals. |
|
|
Border ↓ |
My parents struggled almost never. My parents' hard work had very little to do with me being able to achieve my goals. |
|
Full non-membership (0.0) |
Border ↑ |
I cannot recall my parents struggling. My parents' hard work had almost nothing to do with me being able to achieve my goals. |
|
|
Core |
My parents did not struggle. My parents' hard work had nothing to do with me being able to achieve my goals. |
Table 1: Core and border characteristics for indicator-level dimension "family project" [32]
For the family project dimension, the crucial aspect is whether the respondent connects her or his own ability to thrive in school with the parents' story. For instance, regarding full membership, the core characteristic would be "My parents struggled all the time, and all of it was for my sake" or "Only because of my parents I can achieve my goals" (see Table 1). The characteristics of the further membership scores are variations on this theme. They describe the range of statements that indicate full non-membership and the gradual differences "more out than in" and "more in than out." [33]
With core and border characteristics as reference points, membership scores are clearly distinguishable from each other. A fully specified calibration framework defines the core and borders of each membership score for all indicator-level dimensions of each condition and outcome a study uses. [34]
3.2 Applying the calibration framework to the data
So far, applying anchored calibration has produced concept trees for conditions and outcome(s), as well as conceptual continua and characteristics for all indicator-level dimensions' fuzzy membership scores. The resulting framework provides a detailed set of references points for preparing qualitative data for scoring conditions and outcomes. Part of this second step is to anchor the calibration framework in the data by matching characteristics with data pieces embodying that characteristic. [35]
Applying the calibration framework to the data includes three tasks: sorting data pieces, defining data anchors, and minimizing "grey zones." [36]
The first task in applying the calibration framework to the data is to work through each indicator-level dimension and sort relevant data pieces into membership scores.8) This process successively improves the constructed calibration framework as a tool for sorting data pieces (and scoring cases later on); with each sorted data piece, an indicator-level dimension gains a further reference point that increases the precision of subsequent sorting decisions. [37]
While sorting will be clear for many data pieces, there may be some ambiguous instances. The ability to reveal and document such ambiguities is a strength of anchored calibration. Some data pieces may contain information that points to different membership scores of the same indicator-level dimension. For instance, a respondent may describe how he or she used to not care much about the parents' sacrifices and hardly linked those sacrifices to her or his own story, but also mention that this changed, say, during late adolescence. Such data pieces should be sorted in both membership scores they point to (e.g., 0.25 and 1.0 in this example). For a discussion of how to address such ambiguities when scoring cases, see Section 3.3.1. [38]
Other data pieces may not be clearly sortable because they fall between two membership scores. These areas between two membership scores can be called "grey zones of measurement" (GOERTZ, 2006, p.29). When sorting data pieces, it makes sense to allow such grey zones between all membership scores. Grey zones can later be minimized, which will result in some of their data pieces to move to one of the adjacent scores (see Section 3.2.3). [39]
It makes sense to use coding functions of QDA software (e.g., Atlas.ti, MaxQDA, or NVivo) to sort data pieces, if such software is available.9) The required codes can be subsumed under a "Calibration" family and should include the different membership scores (e.g., "0.0," "0.25," "0.75," and "1.0"), as well as codes for "core," "upper" and "lower border," and "grey zone." Using the search query tools provided by QDA software allows pairing these codes with a given indicator-level dimension code to quickly retrieve data pieces. For instance, using the codes "0.75" and "family project" gives an output of all data pieces that fall into the 0.75 membership score of "family project." Adding "upper border" narrows the output down to data pieces falling into the upper border of that fuzzy membership level. Specifying a search using "family project," "0.75," "1.0," and "grey zone" yields all data pieces falling into the grey zone between the 0.75 and 1.0 membership scores. [40]
As BASURTO and SPEER point out (2012, pp.165-168), it makes sense to double-check sorting decisions at the end of this task. Once all data pieces have been sorted, reference points abound and decisions made at the beginning of the process may have to be revised. [41]
The second task in applying a calibration framework to the data is to define "data anchors" (MAYRING, 2014, p.95); concrete data pieces that are the best examples from the data of a given core or border characteristic. Data anchors illustrate what range of a membership score was actually observed in the data on a given indicator-level dimension. Thus, data anchors are examples of sorting in practice and increase the transparency of calibration. [42]
To illustrate this point, recall the indicator-level dimension "family project" (section 3.1.3). As table 2 shows, the core characteristic for the 0.25 membership score was "My parents hardly struggled" and "My parents' hard work did not really play a role in me being able to achieve my goals." Using this core characteristic as well as the adjacent border characteristics as yardsticks, compare the two statements from Hannah and Emina.
|
Mem. score |
Characteristic |
Data anchor |
|
|
More in that out (0.75) |
Core |
My parents often struggled, and it was for my sake, too. My parents' hard work played a part in me being able to achieve my goals. |
|
|
|
Border ↓ |
My parents struggled quite a bit, and some of it was for my sake. My parents' hard work contributed something to me being able to achieve my goals. |
I feel like a have to take care of my parents, like they took care of me. [...] I would like them to see me getting a full-time job. After all this time I worked for this getting an education. And they saw me doing it, and they helped me financially (Natasha, 29). |
|
Grey zone |
|
My parents struggled, and may have been for my sake. My parents' hard work may have contributed something to me being able to achieve my goals. |
So I thought: Wow, my father's life was actually really rough. And you could notice always notice it, that pride, in his sons, but also in himself, to be able to offer all that. [...] I don't know whether that was an important drive for me, though. Probably not, I think (Jakob, 30). |
|
|
Border ↑ |
My parents sometimes struggled, and maybe it was a little bit for my sake, too. My parents' hard work may have helped a little bit in me being able to achieve my goals, but not a lot. |
My parents wanted a better life for me than they had have. But that was not really clear to me at the time. When I graduated I was surprised how proud they were. That I did it might have had to do with how much they wanted it. I may have felt that without knowing, but I'm not sure (Hannah, 29). |
|
More out than in (0.25) |
Core |
My parents hardly struggled. My parents' hard work did not really play a role in me being able to achieve my goals. |
"My sisters and I, who achieved something, we were doing that on our own. Although I was always impressed with how my mother handled coming to this country with us as kids, I didn't think I owed her or my parents. And I still don't (Emina, 34). |
Table 2: Data anchors [43]
Emina's statement closely resembles the core characteristic; she states that she attributed her achievements to her own efforts. Although she does mention some hardships her mother faced and says she "was always impressed with how my mother handled coming to this country," she did not feel indebted to her parents. In contrast, Hannah acknowledges how her parents' hardships led them to have goals for their daughter and invest in her attaining these goals. She does not rule out the possibility that this engagement gave her a push in her educational efforts, though she states clearly that she was not aware of any expectations or support while in school. Hannah's statement is still clearly a 0.25 membership score because she states that she did not construct her parents' life as a sacrifice for her. But in comparison with the core characteristic or Emina's statement, Hannah's statement also clearly indicates more overlap with statements pertaining to the border characteristic to 0.75. Hannah believes it possible that her parents' efforts had some subconscious influence on her educational decisions, whereas Emina clearly states that she achieved something "on [her] own." [44]
Matching as many characteristics with data anchors as possible grounds the calibration framework in the data. It thus provides readers with a clear notion of the range that each fuzzy membership score occupies on an indicator-level's concept continuum in terms of actual data pieces. Defining data anchors also clearly delimits the grey zones between membership scores. [45]
In doing so, anchored calibration reveals and documents ambiguities, which fosters transparency of calibration. To this end, it makes sense to create a table for each indicator-level dimension showing the membership scores, core and border characteristics, and data anchors (as shown in Table 2). Such tables can be provided to the reader as an online appendix. [46]
Detected ambiguities can be addressed in two ways. First, tables of characteristics and data anchors enable researchers to check whether minimizing grey zones could clear up some ambiguities. This technique will be discussed in the following section. Second, remaining ambiguities can be handled while scoring cases, as I will discuss in Section 3.3.1. [47]
Minimizing grey zones means to revise defined characteristics in an effort to reduce the amount of ambiguous data pieces. This will improve the calibration framework; the fewer ambiguous data pieces, the less researchers have to rely on tacit, nontransparent interpretation when assigning fuzzy membership scores to cases. There are different techniques for minimizing grey zones. [48]
First, it is useful to compare the data anchors close to a membership score's border with adjacent grey zone data pieces. Possibly, an aspect that makes a data piece land in the grey zone could be incorporated into the conceptualization in a theoretically meaningful way. For instance, it could make theoretical sense to include Jakob's statement in table 2 in the 0.25 membership score, since he doubts that his father's life story played a role in his school engagement and educational choices. Conceptually, this would mean re-defining the indicator-level set as "unquestioned construction of family project," so that doubt on the respondents' part indicates a membership score below the crossover point. [49]
Second, if many data pieces fall in a grey zone and share specific characteristics, the researcher could add a membership score to the fuzzy set. Thus, the grey zone data pieces between the 0.75 and 1.0 scores could become data pieces of a new 0.85 score. Since fuzzy sets do not need to be symmetrical in their number of membership scores, this technique can be applied exactly where appropriate without the need to add a further membership score at the opposite end of the continuum (0.15 in this example). Again, all such revisions should only be considered if they are theoretically meaningful for the research project at hand. [50]
3.3 Assigning membership scores in conditions and outcome(s)
The first two steps in anchored calibration constructed a calibration framework, anchored this framework in the data by defining data anchors, and sorted data pieces into membership scores for each indicator-level dimension. These steps provide the means necessary for systematic and transparent assignment of membership scores in conditions and outcome(s). That is, for this last step, researchers score cases on indicator-level dimensions, document ambiguous scoring decisions, and define rules for aggregating from individual-level dimensions to conditions and outcome(s). [51]
3.3.1 Scoring cases on indicator-level dimensions
The first task in assigning membership scores in conditions and outcome(s) is scoring cases on indicator-level dimensions. Based on where a case's relevant data pieces fall on the continuum of an indicator-level dimension, the researcher assigns a membership score. These scores will then be aggregated into membership scores for conditions and outcomes (see Section 3.3.3). [52]
Scoring cases is often clear-cut, especially if cases fall on the extreme ends of a concept continuum (full membership or full non-membership, see GOERTZ & MAHONEY, 2012, pp.132f.). If a case is fully in or fully out of a given indicator-level set, often all its data pieces fall into the same fuzzy membership score. That case, of course, will receive the corresponding score on that indicator-level dimension. For instance, for the indicator-level dimension "family project" of the condition "strong promotive narratives" (see above), Michael, a 32-year-old employee of a moving company, showed no indication of membership at all. All statements relevant to the issue were along the following lines:
Int: Did your parents ever, regarding the things you just said about the university-entry degree being important in order to study, about that being important to get a good job. Did they say something about that, connect that to their own lives, to their lives' story? Or did they just say: ‘That's how it is, and that's why it's important'?
Michael: Well, like I said. I was told that I had to go to university-track secondary school in order to get a decent job. In order to earn a lot of money. Try make something of myself, like a physician or an attorney or something. [53]
Michael states that education was constructed as a path to success in his family, but there is no family project (or other life project) mentioned. Even though the researcher specifically asked about connections made to the parents' life, the respondent never even alludes to any kind of story connected to the educational goals. Hence, the data piece points to a membership score ≥ 0.75 for Michael in the indicator-level set "education as a path to success," but to a score of 0.0 in the set "family project." Since all of Michael's statements fell into this 0.0 membership score for "family project," accordingly, I assigned a 0.0 score for Michael's membership in this indicator-level dimension. Even if one or two data pieces had fallen into the adjacent grey zone, this would not have changed the overall picture enough to warrant a different score than full non-membership. [54]
However, not all scoring decisions are as clear-cut. As in any type of data there might be inconsistencies and ambiguities.10) A case's data pieces might be scattered over the entire continuum of an indicator-level dimension, or a single data piece might contradict convincingly the bulk of other data pieces. Such ambiguities may arise because an interviewee gave contradictory statements in the course of an interview or different data sources provide contradicting information on a given case. [55]
To ensure transparent and consistent calibration, it is vital not to deal with such ambiguities on a case-to-case basis, but to tackle them systematically and transparently (VERKUILEN, 2005, p.464). This can mean to revise the calibration framework. If ambiguities amass in connection to a specific indicator-level dimension, this may point to flawed conceptualization. In such situations, the researcher should revisit and revise prior tasks. [56]
Dealing with ambiguity systematically and transparently can also mean to formulate clear rules that serve as tiebreakers across all comparable instances of ambiguities in a data set. Among the many possible approaches, I will focus on two options that help address common situations of ambiguous scoring. [57]
First, a major source of ambiguity can be variation over time or social context in a given indicator-level dimension. If an indicator-level dimension covers a larger time period or various social contexts, data pieces for indicator-level dimensions may well show diverging evidence. In order to assign membership scores, information needs to be conflated into a single condition or split into two or more conditions that cover different time periods (RAGIN & STRAND, 2008). [58]
For instance, in the study on upward educational mobility, an important question was how to deal with cases that showed a strong family project in some years, but a weaker family project in others. One solution is to assign scores for smaller time periods across cases and define rules for how to later combine them into one score. These rules should be set up for each indicator-level dimension separately, based on theoretical considerations. [59]
Researchers can use their case analyses, theoretical knowledge or external empirical findings to assess how a condition may impact the outcome. In some instances, the condition exerts its influence constantly over time, meaning that it has to be present over long periods in a life course to have an impact. Here, it may make sense to score a case as full membership only if the indicator-level dimension is present over all or most of the educational career. The formal equivalent of these rules are the mathematical minimum and an m-of-n rule, respectively.11) One example would be a constant construction of a family project. [60]
In other cases, the influence might be rather concentrated in time, meaning that what matters is whether the condition is present at all over a respondent's life course. In such cases, it may make sense to use the mathematical maximum of the time periods' scores, or a low-threshold m-of-n rule. One example would be a teacher protecting a student from getting expelled from a good school, thereby enabling that student to continue her/his path to upward mobility. Here, a researcher may assign full membership in "support from teachers" to the case because of this one-time crucial help the student received. [61]
Second, if ambiguities arise from directly contradicting information, it may be possible to weigh data pieces according to specified rules. For instance, say a study uses participant observation as well as retrospective interviews and the different data types provide contradicting information on a given indicator-level dimension. If the indicator-level dimension deals with concrete behavior, it may make sense to give precedence to data from participant observation over interview data, since retrospective interview data are more likely to be tainted by memory bias (BERNARD, KILLWORTH, KRONENFELD & SAILER, 1984). If a study uses interview data exclusively and an interview shows contradicting data pieces from different parts of the conversation, it may make sense to weigh data pieces that show dense descriptions of concrete situations or experiences over data pieces comprised of general statements (WEISS, 1994, pp.149f.). As an example for the latter, some respondents in my study stated to have received "no support in school," but later described concrete situations that clearly comprise receiving support. In such cases, the general statement seems less reliable than descriptions of concrete situations. Thus, the latter should be given precedence when scoring such cases. [62]
3.3.2 Documenting ambiguous scoring decisions
For a transparent calibration procedure it is crucial to document ambiguous scoring decisions. A table can collect all instances of ambiguous information. It should include affected cases and indicator-level dimensions, sources of ambiguity (contradicting information, missing data, or exclusively grey zone data pieces), and how ambiguity was resolved. If general rules were defined and applied, they should be explained and the instances in which they were applied should be noted. [63]
Despite all efforts, some instances of ambiguous information will likely remain. If no generalizable rule can be formulated, the researcher needs to make a case-by-case decision. This does not mean necessarily that the score is unreliable, though general rules are always preferable if such solutions are available. Whenever case-by-case scoring decisions were made, these decisions should be justified. By creating such a table for ambiguous scoring decisions, the researcher provides readers with an accessible overview of how many ambiguous decisions existed and how they were addressed. This practice contributes to the transparency of scoring. [64]
When conducting QCA, it is recommended to run the analysis with both possible options of ambiguous decisions decided through case-by-case reasoning. This allows checking whether the decision impacted the results. [65]
3.3.3 Defining rules of aggregation
Through the prior two tasks, cases were assigned membership scores on all indicator-level dimensions. The last task is to aggregate these scores up each conceptual tree to arrive at membership scores for the conditions and outcome(s). To do so, researchers need to spell out the relations between the dimensions in each concept tree. There are various possible connections between dimensions: essential, family resemblance, and substitutable. Essential and family resemblance connections can be operationalized by logical AND and m of n, respectively. Substitutable connections can be operationalized using logical OR, addition, or arithmetic average (see GOERTZ, 2006; GOERTZ & MAHONEY, 2005 for a detailed description). [66]
The promotive narrative example helps illustrate connections between dimensions in a concept tree. The secondary-level dimensions "education as a path to success" and "family project of mobility" comprise the essence of the concept and are thus indispensable components. With one of the two dimensions absent, one would not be looking at a "promotive narrative." This indispensable nature, in set-theoretic terms, is expressed as a logical AND connection. A case's membership in the abstract fuzzy set is only as high as the weakest membership score among the secondary-level dimensions. [67]
In contrast, the dimensions at the indicator level each are alternative shapes the higher-level dimension can take, i.e., they are substitutable. For instance, the construction of education as a path to success can take the form of achieving a better life or gaining freedom of choice; both variants establish education as a path to success. Because they are full alternatives, but also do not add to each other, logical OR makes most sense for operationalizing the connector. That means, a case's membership in the secondary-level dimensions is as high as that case's highest membership score among the respective indicator-level dimensions. [68]
One way to decide on connections between dimensions is conceptual reflection: what insights do theoretical knowledge, empirical findings from other studies, and methodological studies provide? Another technique is to play through different aggregation rules using hypothetical cases: what if the indicator dimensions had all low, but above full non-membership scores? What if there were one very high or very low score? Comparing the score the concept would receive in each case under the different aggregation rules with what seem adequate scores based on the researcher's knowledge of the subject can help assessing what the correct connection is. Ideally, a researcher arrives at the same conclusion using both lines of reasoning. [69]
Figure 3 combines AND and OR connections and uses scores of a fictive case "Martha" for the indicator-level dimensions. In this example, all indicator-level dimensions are connected with their respective secondary-level dimensions via logical OR, which means that a secondary-level set's membership score will equal the maximum score among indicator-level dimensions. For instance, in the left indicator pair, although one membership is 0.0 and the other is 0.75, the membership score of the secondary-level dimension is 0.75. The secondary-level dimensions in this example are connected via logical AND. Therefore, the score of the condition set for "promotive narrative" is equal to the minimum score among the secondary-level dimensions: 0.25.
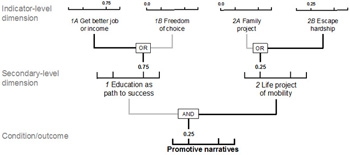
Figure 3: Concept structure with membership scores. Please click here for an enlarged version of Figure 3. [70]
Figure 3 illustrates how spelling out relations in a concept tree allows deriving a case's membership score for conditions and outcome(s) from the scores of indicator-level dimensions. The computing can be done by hand, but using software (e.g., SPSS, Stata, R, or Excel, among many others) promises fewer errors and more time-efficient scoring, especially given possible revisions to the calibration framework that might require re-scoring of cases. Designing fuzzy sets in this fashion facilitates retracing and evaluating scoring decisions when using qualitative data. It therefore is an important part of calibration and adds to scientific credibility. [71]
How a researcher calibrates fuzzy sets is decisive for QCA results. Therefore, the quality and credibility of QCA results hinges on a systematic and transparent calibration procedure that produces reliable scoring results (GLAESSER & COOPER, 2014; RAGIN, 2008, p.104; SCHNEIDER & WAGEMANN, 2012, p.32). Systematic and transparent calibration of qualitative data has not been a focus in the methodological literature, and procedures are seldom documented in detail in empirical studies. In the current article, I introduced anchored calibration, an approach to systematic and transparent calibration of fuzzy sets from qualitative data. Thereby a crucial gap in the methodological literature on QCA has been addressed. [72]
Anchored calibration can be incorporated into the iterative process of qualitative research as an addition, after traditional data coding and before running QCA. The approach includes three steps: 1. constructing a calibration framework, 2. applying the calibration framework to the data, and 3. assigning membership scores in conditions and outcome(s). In the article, I discussed in detail each step and the tasks required to tackle them, and provided illustrations for how to apply the suggested techniques drawing on an in-depth interview study on upward educational mobility. [73]
Anchored calibration offers a more complete approach to calibration of qualitative data because it focuses specifically on conceptualization and the capture of semantic qualitative concepts. The calibration frameworks produced by applying anchored calibration are firmly grounded in the data and facilitate systematic and transparent calibration. From abstract notions down to indicator-level dimensions, and back up to aggregating membership scores into fuzzy set conditions, anchored calibration calls for consistent and transparent rules. [74]
Importantly, anchored calibration provides the means to present one's calibration procedure to readers and reviewers. As good practice, authors should provide 1. concept trees, including rules of aggregation, 2. tables showing each indicator-level dimensions' membership scores, characteristics, and data anchors, as well as (3) a list of ambiguous coding decisions and tiebreaker rules. This material can be published as an online appendix or offered to interested readers upon request. [75]
As another important advantage, anchored calibration can be combined with tests of inter-coder reliability (e.g., CAMPBELL et al., 2013). The focus on systematic and transparent rules throughout the approach provides a sound basis for such tests. Researchers can test inter-coder reliability of sorting data pieces and/or inter-coder reliability of scoring decisions for indicator-level dimensions. [76]
Anchored calibration helps calibrating fuzzy sets from qualitative data in a systematic and transparent way. It can thereby contribute to linking QCA and qualitative research and helps addressing an important gap in the methodological literature on QCA. [77]
I would like to thank Charles RAGIN, Gary GOERTZ, Anette FASANG, and Anne NASSAUER for their invaluable comments and feedback on earlier versions of this article. Further, I would like to thank two anonymous reviewers for their thoughtful comments, which helped to greatly improve the paper. I developed the first ideas for this article while working for a research project by Robert SMITH at City University of New York that was funded by Grant 1 2010-2012, National Science Foundation, Sociology Program.
1) For general discussions on such issues of reliability, see KING, KEOHANE and VERBA (1994, p.25) or LeCOMPTE and GOETZ (2007, p.7) among many others. <back>
2) The study also serves as an example of anchored calibration in practice. It can be provided to interested readers on request. <back>
3) Comprehensive introductions to QCA and qualitative data analysis fill entire handbooks and thus go beyond the scope of this article. For introductions to QCA, see LEGEWIE (2013); RAGIN (2008), RIHOUX and RAGIN (2009), SCHNEIDER and WAGEMANN (2012). See BAUMGARTNER (2009) and BAUMGARTNER and EPPLE (2013) for an alternative approach to set-theoretic analysis. For approaches to qualitative data analysis, see GLASER and STRAUSS (1967), HARDING, FOX and MEHTA (2002), MAHONEY (2000), or MAYRING (2014) among many others. For an approach to qualitative data analysis specifically attuned to QCA, see BASURTO and SPEER (2012). <back>
4) Sets can be either "crisp" or "fuzzy." Crisp sets are dichotomous, i.e., membership scores are either "0" or "1," whereas in fuzzy sets membership scores can take any value between the two, including "0" or "1." In this article, I will focus on the fuzzy set variant, since calibration is more challenging and the principles translate directly to crisp set calibration. <back>
5) In contrast, calibration procedures for interval-scale data have been discussed quite frequently (GOERTZ & MAHONEY, 2012, pp.150ff.; RAGIN, 2008, pp.85-105; also see SKAANING, 2011; SMITHSON, 2005; VERKUILEN, 2005). <back>
6) This notion of multi-level concepts is in line with techniques of concept development through qualitative data coding as suggested by many approaches to qualitative data analysis (e.g., GLASER & STRAUSS, 1967; MAYRING, 2014; STRAUSS & CORBIN, 1998). Thus, the suggested concept trees can be a direct product of coding qualitative data prior to engaging in the calibration process. <back>
7) Qualitative data may contain information on a given indicator-level dimension in many shapes, especially if researchers use different types of qualitative data for triangulation. If a researcher uses several data types, formulating "characteristics" can serve to spell out the different ways in which an indicator-level dimension may appear in the data. The best way to formulate characteristics varies with the kind of data: for in-depth interview data, it makes most sense to formulate characteristics as verbal statements; for observational data (e.g., field notes) or visual footage, formulating characteristics as (inter)actions or setting descriptions can be more adequate. <back>
8) This step requires having identified data pieces relevant for a given indicator-level dimension, i.e., selecting data pieces with common characteristics and collect them under the same category or code (SIVESIND, 1999, p.363). This coding of data usually happens before constructing a calibration framework for scoring cases. Qualitative methods offer various techniques for this data coding (e.g., GLASER & STRAUSS, 1967; HARDING et al., 2002; MAHONEY, 2000; MAYRING, 2014; see BASURTO & SPEER, 2012 for an approach specifically attuned to QCA). <back>
9) See BAZELEY and JACKSON (2013), FRIESE (2014), and KUCKARTZ (2009) for coding manuals in NVivo, Atlas.ti, MaxQDA, respectively. <back>
10) This issue arises even in statistical approaches, namely when editing survey data (SANA & WEINREB, 2008). <back>
11) M-of-n rules define a threshold for time periods with a high score necessary for the case to receive a high score on the indicator-level dimension. For a more detailed explanation of these and other rules, see GOERTZ and MAHONEY (2005). <back>
Amenta, Edwin; Caren, Neal; Olasky, Sheera Joy & Stobaugh, James E. (2009). All the movements fit to print: Who, what, when, where, and why SMO families appeared in the New York Times in the twentieth century. American Sociological Review, 74(4), 636-656.
Basurto, Xavier & Speer, Johanna (2012). Structuring the calibration of qualitative data as sets for qualitative comparative analysis (QCA). Field Methods, 24(2), 155-174.
Baumgartner, Michael (2009). Inferring causal complexity. Sociological Methods & Research, 38(1), 71-101.
Baumgartner, Michael & Epple, Ruedi (2013). A coincidence analysis of a causal chain: The Swiss minaret vote. Sociological Methods & Research, 43(2), 280-312.
Bazeley, Patricia & Jackson, Kristi (Eds.) (2013). Qualitative data analysis with NVivo (2nd ed.). Los Angeles, CA: Sage.
Becker, Howard S. (1986). Doing things together: Selected papers. Evanston, IL: Northwestern University Press.
Bernard, H. Russell; Killworth, Peter; Kronenfeld, David & Sailer, Lee (1984). The problem of informant accuracy: The validity of retrospective data. Annual Review of Anthropology, 13(1), 495-517.
Campbell, John L.; Quincy, Charles; Osserman, Jordan & Pedersen, Ove K. (2013). Coding in-depth semistructured interviews: Problems of unitization and intercoder reliability and agreement. Sociological Methods & Research, 42(3), 294-320.
Coppedge, Michael (1999). Thickening thin concepts and theories: Combining large N and small in comparative politics. Comparative Politics, 31(4), 465-476.
Crowley, Martha (2013). Gender, the labor process and dignity at work. Social Forces, 91(4), 1209-1238.
Friese, Susanne (2014). Qualitative data analysis with ATLAS.ti (2nd ed.). Los Angeles, CA: Sage.
Glaesser, Judith & Cooper, Barry (2014). Exploring the consequences of a recalibration of causal conditions when assessing sufficiency with fuzzy set QCA. International Journal of Social Research Methodology, 17(4), 387-401.
Glaser, Barney & Strauss, Anselm L. (1967). The discovery of grounded theory: Strategies for qualitative research. New York: Aldine de Gruyter.
Goertz, Gary (2006). Social science concepts: A user's guide. Princeton, NJ: Princeton University Press.
Goertz, Gary & Mahoney, James (2005). Two-level theories and fuzzy-set analysis. Sociological Methods & Research, 33(4), 497-538.
Goertz, Gary & Mahoney, James (2012). A tale of two cultures. Qualitative and quantitative research in the social sciences. Princeton, NJ: Princeton University Press.
Goertz, Gary; Hak, Tony & Dul, Jan (2013). Ceilings and floors: Where are there no observations?. Sociological Methods & Research, 42(1), 3-40.
Harding, David J.; Fox, Cybelle & Mehta, Jal D. (2002). Studying rare events through qualitative case studies: Lessons from a study of rampage school shootings. Sociological Methods & Research, 31(2), 174-217.
Hollstein, Betina & Wagemann, Claudius (2014). Fuzzy set analysis of network data as mixed method. Personal networks and the transition from school to work. In Silvia Dominguez & Betina Hollstein (Eds.), Mixed-methods social network research (pp.237-268). New York: Cambridge University Press.
King, Gary; Keohane, Robert O. & Verba, Sidney (1994). Designing social inquiry: Scientific inference in qualitative research. Princeton, NJ: Princeton University Press.
Kuckartz, Udo (2009). Einführung in die computergestützte Analyse qualitativer Daten (3rd ed.). Wiesbaden: VS Verlag für Sozialwissenschaften.
LeCompte, Margaret D. & Goetz, Judith P. (2007). Problems of reliability and validity in ethnographic research. In Alan Bryman (Ed.), Qualitative research 2. Quality issues in qualitative research (Sage benchmarks in social research methods) (pp.3-39). Thousand Oaks, CA: Sage.
Legewie, Nicolas (2013). An introduction to applied data analysis with qualitative comparative analysis (QCA). Forum Qualitative Sozialforschung / Forum: Qualitative Social Research, 14(3), Art. 15, http://dx.doi.org/10.17169/fqs-14.3.1961 [Accessed: September 18, 2017].
Legewie, Nicolas (2015). Puncturing inequalities. A configurational analysis of educational upward mobility. Doctoral dissertation, Humboldt-Universität zu Berlin, Germany.
Legewie, Nicolas (2016). Culture, narratives and upward educational mobility. In Christiane Timmermann, Noel Clycq, Marie McAndrew, Alhassane Balde, Luc Breakmans & Sara Mels (Eds.), Youth in education. The necessity of valuing ethnocultural diversity (pp.111-135). London: Routledge.
Louie, Vivian S. (2012). Keeping the immigrant bargain: The costs and rewards of success in America. New York: Russell Sage Foundation.
Mahoney, James (2000). Strategies of causal inference in small-N analysis. Sociological Methods & Research, 28(4), 387-424.
Mahoney, James (2010). After KKV: The new methodology of qualitative research. World Politics, 62(1), 120-147.
Mayring, Philipp (2014). Qualitative content analysis: Theoretical foundation, basic procedures and software solution, http://nbn-resolving.de/urn:nbn:de:0168-ssoar-395173 [Accessed: September 29, 2016].
Metelis, Claire M. (2009). The consequences of rivalry: Explaining insurgent violence using fuzzy sets. Political Research Quarterly, 62, 673-684.
Nassauer, Anne (2012). Violence in demonstrations: A comparatve analysis of situational interaction dynamics at social movement protests. Doctoral dissertation, Humboldt Universität zu Berlin, Germany.
Onwuegbuzie, Anthony J. & Teddlie. Charles B. (2003). A framework for analyzing data in mixed methods research. In Abbas M. Tashakkori & Charles B. Teddlie (Eds.), Sage handbook of mixed methods in social & behavioral research (pp.351-383). Thousand Oaks, CA: Sage.
Ragin, Charles C. (2008). Redesigning social inquiry: Fuzzy sets and beyond. Chicago, IL: University of Chicago Press.
Ragin, Charles C. & Strand, Sarah I. (2008). Using qualitative comparative analysis to study causal order. Comment on Caren and Panofsky (2005). Sociological Methods & Research, 36(4), 431-441.
Rihoux, Benoît & Ragin, Charles C. (Eds.) (2009). Configurational comparative methods: Qualitative comparative analysis (QCA) and related techniques. Thousand Oaks, CA: Sage.
Rihoux, Benoît; Álamos, Priscilla; Bol, Damien; Marx, Axel & Rezsöhazy, Ilona (2013). From niche to mainstream method? A comprehensive mapping of QCA applications in journal articles from 1984 to 2011. Political Research Quarterly, 66(1), 175-184.
Sana, Mariano & Weinreb, Alexander A. (2008). Insiders, outsiders, and the editing of inconsistent survey data. Sociological Methods & Research, 36(4), 515-541.
Sartori, Giovanni (1970). Concept misformation in comparative politics. American Political Science Review, 64(4), 1033-1053.
Sartori, Giovanni (1984). Guidelines for concept analysis. In Giovanni Sartori (Ed.), Social science concepts: A systematic analysis (pp.15-85). Beverly Hills, CA: Sage.
Saylor, Ryan (2013). Concepts, measures, and measuring well: An alternative outlook. Sociological Methods & Research, 42(3), 354-391.
Schneider, Carsten Q. & Wagemann, Claudius (2012). Set-theoretic methods for the social sciences: A guide to qualitative comparative analysis. Cambridge: Cambridge University Press.
Sivesind, Karl Henrik (1999). Structured, qualitative comparison. Quality and Quantity, 33(4), 361-380.
Skaaning, Svend-Erik (2011). Assessing the robustness of crisp-set and fuzzy-set QCA results. Sociological Methods & Research, 40(2), 391-408.
Smilde, David (2005). A qualitative comparative analysis of conversion to Venezuelan evangelicalism: How networks matter. American Journal of Sociology, 111(3), 757-796.
Smith, Robert C. (2008). Horatio Alger lives in Brooklyn: Extrafamily support, intrafamily dynamics, and socially neutral operating identities in exceptional mobility among children of Mexican immigrants. The ANNALS of the American Academy of Political and Social Science, 620(1), 270-290.
Smith, Robert C. (2010). Strengthening qualitative research: Assimilation and the transition to early adulthood for Mexican Americans. Grant 1 2010-2012, National Science Foundation, Sociology Program, USA.
Smithson, Michael (2005). Fuzzy set inclusion: Linking fuzzy set methods with mainstream techniques. Sociological Methods & Research, 33(4), 431-461.
Strauss, Anselm L. & Corbin, Juliet M. (1998). Basics of qualitative research: Grounded theory procedures and techniques (2nd ed.). Thousand Oaks, CA: Sage.
Verkuilen, Jay (2005). Assigning membership in a fuzzy set analysis. Sociological Methods & Research, 33(4), 462-496.
Weiss, Robert S. (1994). Learning from strangers: The art and method of qualitative interview studies. New York: The Free Press.
Nicolas LEGEWIE is a research associate at the German Institute for Economic Research (DIW Berlin). His research interests include social inequality and mobility, education, migration, and labor market. His methodological interests include qualitative comparative analysis (QCA), visual data analysis (VDA), and qualitative research methodology. He is currently co-leading the research project "Mentoring of Refugees" (MORE), which examines the impact of a mentoring program on the integration of refugees in Germany through a randomized control trial. The study collects and analyzes survey and qualitative interview data.
Contact:
Nicolas Legewie
German Institute for Economic Research (DIW Berlin)
Socio-economic Panel
Mohrenstr. 58
10117 Berlin, Germany
E-Mail: nlegewie@diw.de
Legewie, Nicolas (2017). Anchored Calibration: From Qualitative Data to Fuzzy Sets [77 paragraphs]. Forum Qualitative Sozialforschung / Forum: Qualitative Social Research, 18(3), Art. 14, http://dx.doi.org/10.17169/fqs-18.3.2790.

Creative Commons Attribution 4.0 International License