Volume 21, No. 2, Art. 12 – May 2020
Contextualized Repertoire Maps: Exploring the Role of Social Media in News-Related Media Repertoires
Lisa Merten
Abstract: In this article, I introduce contextualized repertoire maps as a qualitative approach to the study of news-related media use. With their origins in the sociological analysis of personal networks, egocentric network maps are adapted here to visualize patterns of media use and then contextualized with qualitative interviews and data collected during participant observation. This integrative approach is illustrated by a study of the routines and practices of news consumption within and around social media platforms. I demonstrate how the mapping exercise can complement other qualitative methods to explore the structure, meaning and processes of cross-media user practices and discuss the scope and limits for visualizing and analyzing the interrelatedness between social media platforms and traditional mass media.
Key words: qualitative network research; social network analysis; network maps; repertoire maps; intermediaries; media repertoire; social media; cross-media news use
Table of Contents
1. Introduction
2. Repertoire Mapping as a Research Strategy
3. Repertoire Mapping as a Research Practice
3.1 Sample
3.2 Procedure
3.3 Analysis
4. Scope and Challenges of the Repertoire Mapping Approach
4.1 Interview process
4.1.1 Structuring complex patterns
4.1.2 Stimulus for conversation and reflection
4.1.3 Ease of use
4.2 Data analysis
4.2.1 Openness and flexibility to account for convergence
4.2.2 Compatibility with dimensions of qualitative structural analysis
4.2.3 Visualizing the interrelatedness between "old" and "new" media
5. Outlook
Over the past few years, the ways in which people keep up with what is going on in the world, their country, or their community have been rapidly transforming. Due to convenient and accessible platform-specific features such as "share" and "like" buttons, social media services such as Facebook and Twitter have become integral components in the processes of online news distribution and consumption (KÜMPEL, KARNOWSKI & KEYLING, 2015). According to the Reuters Institute Digital News Survey, more than half of all online users across the 36 countries surveyed (54%) said that they use social media as a source of news each week and more than one in ten (14%) said that social media was their main news source (NEWMAN, FLETCHER, KALOGEROPOULOS, LEVY & NIELSEN, 2017). The potential consequences of such changes in news use have been widely discussed beyond the limits of academia in connection to political events such as the outcome of the US presidential election or the United Kingdom's referendum on EU membership in 2016. [1]
Political and communication scientists suggest that the use of social networking sites can expose some segments of the population to news that might not have gotten it otherwise (MITCHELL, KILEY, GOTTFREID & GUSKIN, 2013; NEWMAN, FLETCHER, LEVY & NIELSEN, 2016) rendering them "accidentally informed" and potentially increasing their awareness of current affairs as a result (TEWKSBURY, WEAVER & MADDEX, 2001). Incidental exposure to political content on Facebook can increase both political participation (VALERIANI & VACCARI, 2015) and political literacy (BODE, 2016). However, it has been discussed that certain information may be absent in peoples' online news diets as a consequence of the socio-technical filtering on social media platforms, adverse effects of algorithmic personalization, for example, that may lead to so-called "filter bubbles" (PARISER, 2011, p.9) or "echo chambers" (SUNSTEIN, 2017, p.IX). While a lack of empirical evidence has meant that the idea of filter bubbles has been met with widespread skepticism (HAIM, GRAEFE & BROSIUS, 2018; ZUIDERVEEN BORGESIUS et al., 2016), there still exists a lively debate on the need for regulation and the possibilities for intervention (ANANNY & CRAWFORD, 2017; BODO et al., 2017). [2]
To understand more about the relevance of social media and their societal implications it is important that we study how users encounter and make sense of news on social media platforms. Social media feeds contain a variety of sources that may be of interest to news-seeking users that includes not just user-generated content such as individual posts or blogs, but content that originates from more traditional mass media organizations, mainstream newspapers or broadcasters actively seeking to facilitate the wider dissemination of their content (JU, JEONG, & CHYI, 2013; KRAMP & LOOSEN, 2018). Due to this "interrelatedness" (HASEBRINK & HEPP, 2017, p.364) between social media and older and more established forms of news production and consumption, research on this phenomenon has come to be understood as cross-media research (BJUR et al., 2014). When discussing potentially negative effects on information diversity such as echo chambers measuring exposure to conflicting ideas on a single platform or medium does not account for the ways in which individuals collect information across the entire media environment (DUBOIS & BLANK, 2018; MÖLLER, VAN DER VELDE, MERTEN & PUSCHMANN, 2019). A comprehensive approach to understand such phenomena has to focus on not only how online news consumption expectations and routines are shaped around social media platforms but also how social media platforms shape their expectations of and routines around other sources of news for users:
"A genuine audience perspective on the contemporary media culture must adopt a cross-media lens, because people in everyday life, as individuals and groups, form their identities and found their practices through being the inevitable sense-making hubs of the spokes of the mediatized culture. Audiences are inherently cross-media" (SCHRØDER, 2011, p.6). [3]
For that reason, I want to introduce in this article a research design that focuses on social media as a distinct media choice that is part of a cross-media repertoire and will assess their popularity and their various functionalities within the context of an individual's wider media repertoire—a concept developed by HASEBRINK and POPP (2006) as an analytical tool that considers the entirety of media that an individual uses or comes into contact with. A repertoire-oriented approach to media use stresses the need to consider the whole variety of media regularly assembled by an individual. Applying this concept not only helps in avoiding misinterpretations that can occur as a consequence of approaching specific media choices, it also helps us when contemplating the interrelations between and the specific functions of each component for an individual user. This approach reflects the basic claim that a user's media repertoire is not just the mere sum of its parts, i.e., the variety of media he or she uses, but a meaningfully structured composition of media (HASEBRINK & HEPP, 2017). [4]
This repertoire approach was applied in a study design that set out to gain a better understanding of the role social media play as part of the wider selection of news media that an individual uses regularly. The qualitative study was commissioned by the association of the 14 German Media Authorities and conducted between March 2016 and February 2017 by a research team at the Leibniz-Institute for Media Research (Hans-Bredow-Institut). To reflect the repertoire approach and the contemporary digital public sphere we focused not only on the relations between social media platforms such as Facebook or Twitter and traditional offline and online news media but also included other intermediaries such as search engines (e.g., Google), multimedia platforms (e.g., YouTube, Instagram) and instant-messaging services (e.g., WhatsApp, Facebook messenger) into our research questions. Specifically, our research team wanted to find out 1. How relevant are social media services and other online intermediaries for different user groups' news-related information gathering? 2. How are these intermediaries and their content incorporated into specific news-related practices and networks? Based on six group discussions and 18 interviews with German participants varying in age and political engagement, we reconstructed individual information repertoires with a particular focus on online intermediaries and key episodes in which these services were used for gathering information on current news events. [5]
To reconstruct the complex patterns of day to day media use and the specific role of social media services we included a mapping exercise that we coined repertoire mapping into the research design. With this article, I am aiming to introduce this qualitative method of visualizing subjective news repertoires. Inspired by similarly structured work on qualitative mapping techniques by HEPP, ROITSCH and BERG (2016) and HERZ, PETERS and TRUSCHKAT (2015), I am not presenting a "self-contained procedure" (§5) but, rather, summing up experiences from its implementation in the research project mentioned above. I begin by explaining the methodological background of network analysis from which this repertoire mapping approach stems (Section 2) and will then outline the process of repertoire mapping and discuss the potential advantages and the challenges it presents in more detail (Section 3). In so doing, several practical issues will be addressed. Finally, the potential of repertoire mapping for general research on media practices will be summarized (Section 4). The particular study focus on the practices of news use around social media is referred to throughout the article. [6]
2. Repertoire Mapping as a Research Strategy
For our research design the relational approach to social network analysis was modified to accommodate the concept of media repertoires. A key technique in modern sociology, social network analysis has a rich tradition in the field of quantitative research since the 1930s and is applied, in its purest form, to collect predominately-structural data on the relationships and links between actors (BUTTS, 2008; HOLLSTEIN, 2006; LÖBLICH & PFAFF-RÜDIGER, 2011). [7]
The application of network analysis methodologies among communication scientists has helped to overcome what SCHENK has called "a psychological bias in communication research" (2010, p.773), a tendency to focus on single media effects on individuals and disregard the social system in which individuals act. Core research in the field has focused on interpersonal communication in the context of mass media, applied prominently in work that focuses on the characteristic of opinion leadership and the hypothesis of a two-step-flow which argues that "ideas often flow from radio and print to the opinion leaders and from them to the less active sections of the population" (KATZ & LAZARSFELD, 1955, p.32). Social network analysis has also been applied in the field of diffusion of innovation that demonstrated how mass media can introduce new means of media use, consumption and technologies; however, it also identifies how adoption is mainly influenced by personal contacts and social networks (COLEMAN, KATZ & MENZEL, 1957, 1966; ROGERS, 2003). Scholars have also studied the interactions between various nodes related to media production and content such as the members of online newsgroups (CHOI & DANOWSKI, 2002), soap characters (FINE, 1981), interrelations between television channels (YUAN & KSIAZEK, 2011) or journalistic activities in online newsrooms (QUANDT, 2005). [8]
In contrast to the quantitative tradition, the use of qualitative network analysis has only gained more traction in the last 20 years (STRAUSS, 2013). In the context of communication studies, the method has been applied to study the professional networks related to the German youth protection system (LÖBLICH & PFAFF-RÜDIGER, 2011) or adolescents' social networks on social media (AUTENRIETH, 2014) with an emphasis on the potential of visualization. These visualizations have varied over the years (see FREEMAN, 2000 for an overview), introduced by MORENO (1978 [1934]), who coined the term sociogram to describe them. Sociograms have been further developed into ego-centered network maps (BOTT, 1957; KAHN & ANTONUCCI, 1980; WELLMAN & BERKOWITZ, 1988), a visualizing technique that is often used in contemporary qualitative network analysis. With this approach, described in regard to its origins by JONES (2018) and in more detail by HOLLSTEIN and PFEFFER (2010), interviewees are asked to place the initials of people they feel emotionally attached to on a diagram with three or four concentric circles surrounding the so-called ego at the center which represents the interviewee. Participants are asked to place the names of people they are closest to in the innermost circle and those they know but are less close to in the outer one. The resulting map gives the researcher a sense of the size of the participant's network and patterns within its distribution based on levels of subjective importance. This approach provides a fine level of semi-standardization: One the one hand, the structure of the circles and the placement of the ego in the middle affords a degree of intra/interpersonal comparison as opposed to completely free network maps where the participants visualize their network without any structural bearings. One the other hand, the stimulus of importance itself is not defined by the interviewer (as in a standardized model where each circle would be defined as first circle very important, second circle fairly important and so on) and instead aims to identify a system of relevance from the interviewee's perspective. [9]
More recently, researchers have widened the definition of networks to encompass the cultural contexts of social networks which has helped to further vitalize qualitative network analysis (HEPP, 2010). The concept of sociomaterial network maps has been coined for these network analysis approaches that include non-human subjects such as animals, objects, locations or media. These kinds of maps are valuable not only in depicting the relation between various actors, but also for exploring "the medial or communicative mediation of network relations" that might occur through a variety of different media, for example, social media platforms (HEPP et al., 2016, p.90). HEPP, BERG and ROITSCH (2014) and HEPP, BOZDAG and SUNA (2012) have carried out work on these mediated networks with reference to migrant identities and community-building using unstructured network maps. KESSELRING (2006) included geographic locations into his network design to map networks of mobility pioneers such as freelance journalists while HASEBRINK and DOMEYER (2012) visually reconstructed the media repertoires of young German adults as a working example of the empirical application of the repertoire concept. [10]
With the repertoire mapping approach described in this article I am aiming to map the relations between the ego and its information sources (nodes) which include non-human sources such as different media services. The "relations" (edges) between these nodes can only be tracked if an interviewee (ego) defines these news sources in relation to one another, for example, in their descriptions of consuming newspaper articles (Node 1) via Facebook (Node 2). [11]
Researchers have argued that network maps that mainly consist of interviewee information on bimodal relations between the ego and the surrounding nodes should not be defined as a network analysis. BARNES, who originally coined the term "networks," initially proposed to call these single relation networks "first order stars" (1969, p.59). Nevertheless, the term network analysis is often used in the context of ego-centered networks if the interviewee is the sole source of information (HOLLSTEIN, 2006). I am referring to the research design described in this article as repertoire maps to take this naming debate into account and reflect the modified system of non-human nodes and the missing relations between them while focusing on bimodal relations. The naming indicates a difference between "traditional" quantitative and qualitative network analysis, and I aim to reflect the inclusive, cross-media approach of our study design. [12]
As is common in the application of qualitative network analysis, we contextualized the repertoire maps with an accompanying interview to allow for an interpretation of the structures visualized by the participants. This methodological addition helps us to avoid what EMIRBAYER and GOODWIN, in their critique of traditional network analysis, refer to as a "structural determinism" (1994, p.1425). EMIRBAYER and GOODWIN (1994) and DIAZ-BONE (2006), in his seminal review of qualitative network analysis, question the assumption that social behavior is mainly based on social relations and encourage researchers to incorporate actor agency and cultural and historical context into their research. Carrying out qualitative interviews alongside the mapping process enables researchers to gain insights into the participant's interpretation of the relational structures produced and their beliefs, values and normative commitments (EMIRBAYER & GOODWIN, 1994). [13]
When incorporating actors other than social contacts in a network or repertoire map it is important to note that not only do the relations and characteristics of human actors afford certain social behaviors and communicative practices, media sources do as well. The affordance concept, originating from ecological psychology (GIBSON, 1966), has been adapted in communication studies to analyze how material artifacts such as media technologies enable or restrain user activities. Each news source that was incorporated in the repertoire maps has specific affordances that allow for certain types of communicative practices and social interactions that contribute to the structure of the repertoire maps. For example, social media platforms may afford the opportunity to click, like or share news items to various types of users, including end-users, journalists and advertisers (BUCHER & HELMOND, 2018) while the same practices would differ when consuming a linear news broadcast on television. Media-specific affordances were therefore discussed in the interviews and reflected upon in the analysis of the maps. [14]
3. Repertoire Mapping as a Research Practice
In our research project on online intermediaries and news consumption the repertoire maps were part of a larger research design that also involved initial group discussions focusing on the role social media and other intermediaries play in information practices in a variety of social contexts. The participants of six real groups from a major German city varied along the characteristics of age, gender and political/civic engagement ranging from an environmental youth group for teenagers to a circle of friends well into their sixties. Guided by the repertoire-oriented approach, our research team set out to discuss with the groups all types of media that were relevant to their information gathering and opinion-making processes while also paying attention to information intermediaries such as social media (e.g., Facebook, Twitter, LinkedIn). Three participants from each group discussion who had basic knowledge of social media and contrasting practices of (non-)use were chosen for the qualitative interviews and were asked to map their repertoires (n=18). Consequently, the mapping process could be tested across a quota sample along demographic variations of age, gender and level of political engagement (BATTAGLIA, 2011). This variation allowed us to compare how participants across the demographic spectrum assemble social media as a source within their information repertoire as levels of social media usage have been linked to age, gender and political engagement (see, for example, HÖLIG & HASEBRINK, 2017). In this article, I use three of the eighteen maps and interviews to demonstrate the methodology. [15]
Each participant's personal network of information sources was visualized across three concrete steps in a similar way to the ego-centered network maps (WOLF, 2010):
the stimulus of "name generation" to collate the variety of news sources,
the positioning of the sources from the ego-perspective and
the characterization and contextualization of the named sources including the descriptions of the bimodal relations between the ego and the sources and the interconnections between the sources. [16]
Each interview lasted approximately 90 to 120 minutes and was documented by means of audio recording and photographs of the repertoire maps. Based on the individual repertoire map, the importance of each social media service in terms of news exposure and consumption as well as the participants' attachment to the platform were discussed in an accompanying interview. [17]
1. Source generation: Initially, participants were given a set of cards and asked to write down each of the main elements of their information repertoire.
"I would like you to write down all the sources that you use to get information on events and issues beyond your friends and family such as global news events like terrorist attacks or local issues like the referendum in your city on its candidacy as a host city for the Olympic Games." [18]
The interviewees were instructed to not only name but also to comment on their choices. The interviewers prompted the participants to think about their everyday lives and asked them to voice their thoughts during the process. They were completely free to choose how many cards they used and what kinds of information source (e.g., mass media, app, friends, smartphone, specific television formats) they referred to. With this openly formulated questioning we were able to glean data on all the sources that were of subjective relevance to the interviewee. Figure 1 displays the set of sources generated by Lucas,1) a 23-year old office management trainee. He named interpersonal communication with friends and family either face-to face or via WhatsApp as principal sources of information, followed by a number of television-related sources ranging from a more general television card to specific television formats and a news channel. Lucas also generated cards for two social media platforms, Facebook and YouTube.

Figure 1: Source generation task: Set of sources used by Lucas, age 23 [19]
2. Placement: During the second phase, we asked participants to place the cards within a set of concentric circles printed on a large board according to the importance of each component in their information repertoire, placing the most important sources closer to the ego. The researcher ensured that participants were aware that this task was not at all about how frequently they used a particular medium. Lucas placed the card representing his friends and family in the center of the map since he gets the most relevant information about current events from face-to-face conversations with them or via WhatsApp (Figure 2). The four television-related cards form a cluster further away from the center and Facebook and YouTube, are placed together at the edge of the map as less important.

Figure 2: Placement task: Sources placed according to their importance by Lucas. Please click here for an enlarged version of Figure 2. [20]
3. Labeling task: During this phase, we as researchers aimed to gain an understanding of frequency of use. We asked participants to place circular labels of three different sizes (most used, less used, least used) on the cards and to elaborate on the quantifiable meaning of the labels (e.g., most used = daily) so that the frequency of use for each medium was visualized. With additional labels we focused on the interrelatedness between the documented information sources and discussed the different means through which participants approached their sources of news consumption (e.g., devices, filtered by friends, intentionality etc.). We asked the participants to mark those sources they used intentionally for information on current events with a square label and those sources where "they just stumbled upon news by chance" (incidental exposure) with a triangular label. Here the use of social media as a tool to aggregate other sources was of particular interest. Figure 3 displays Lucas' completed and translated repertoire map, including the source generation, placement and marking tasks. On his map, a certain overlap of importance and frequency is visible: sources that are of high relevance are also marked with the largest labels as the most used information sources.
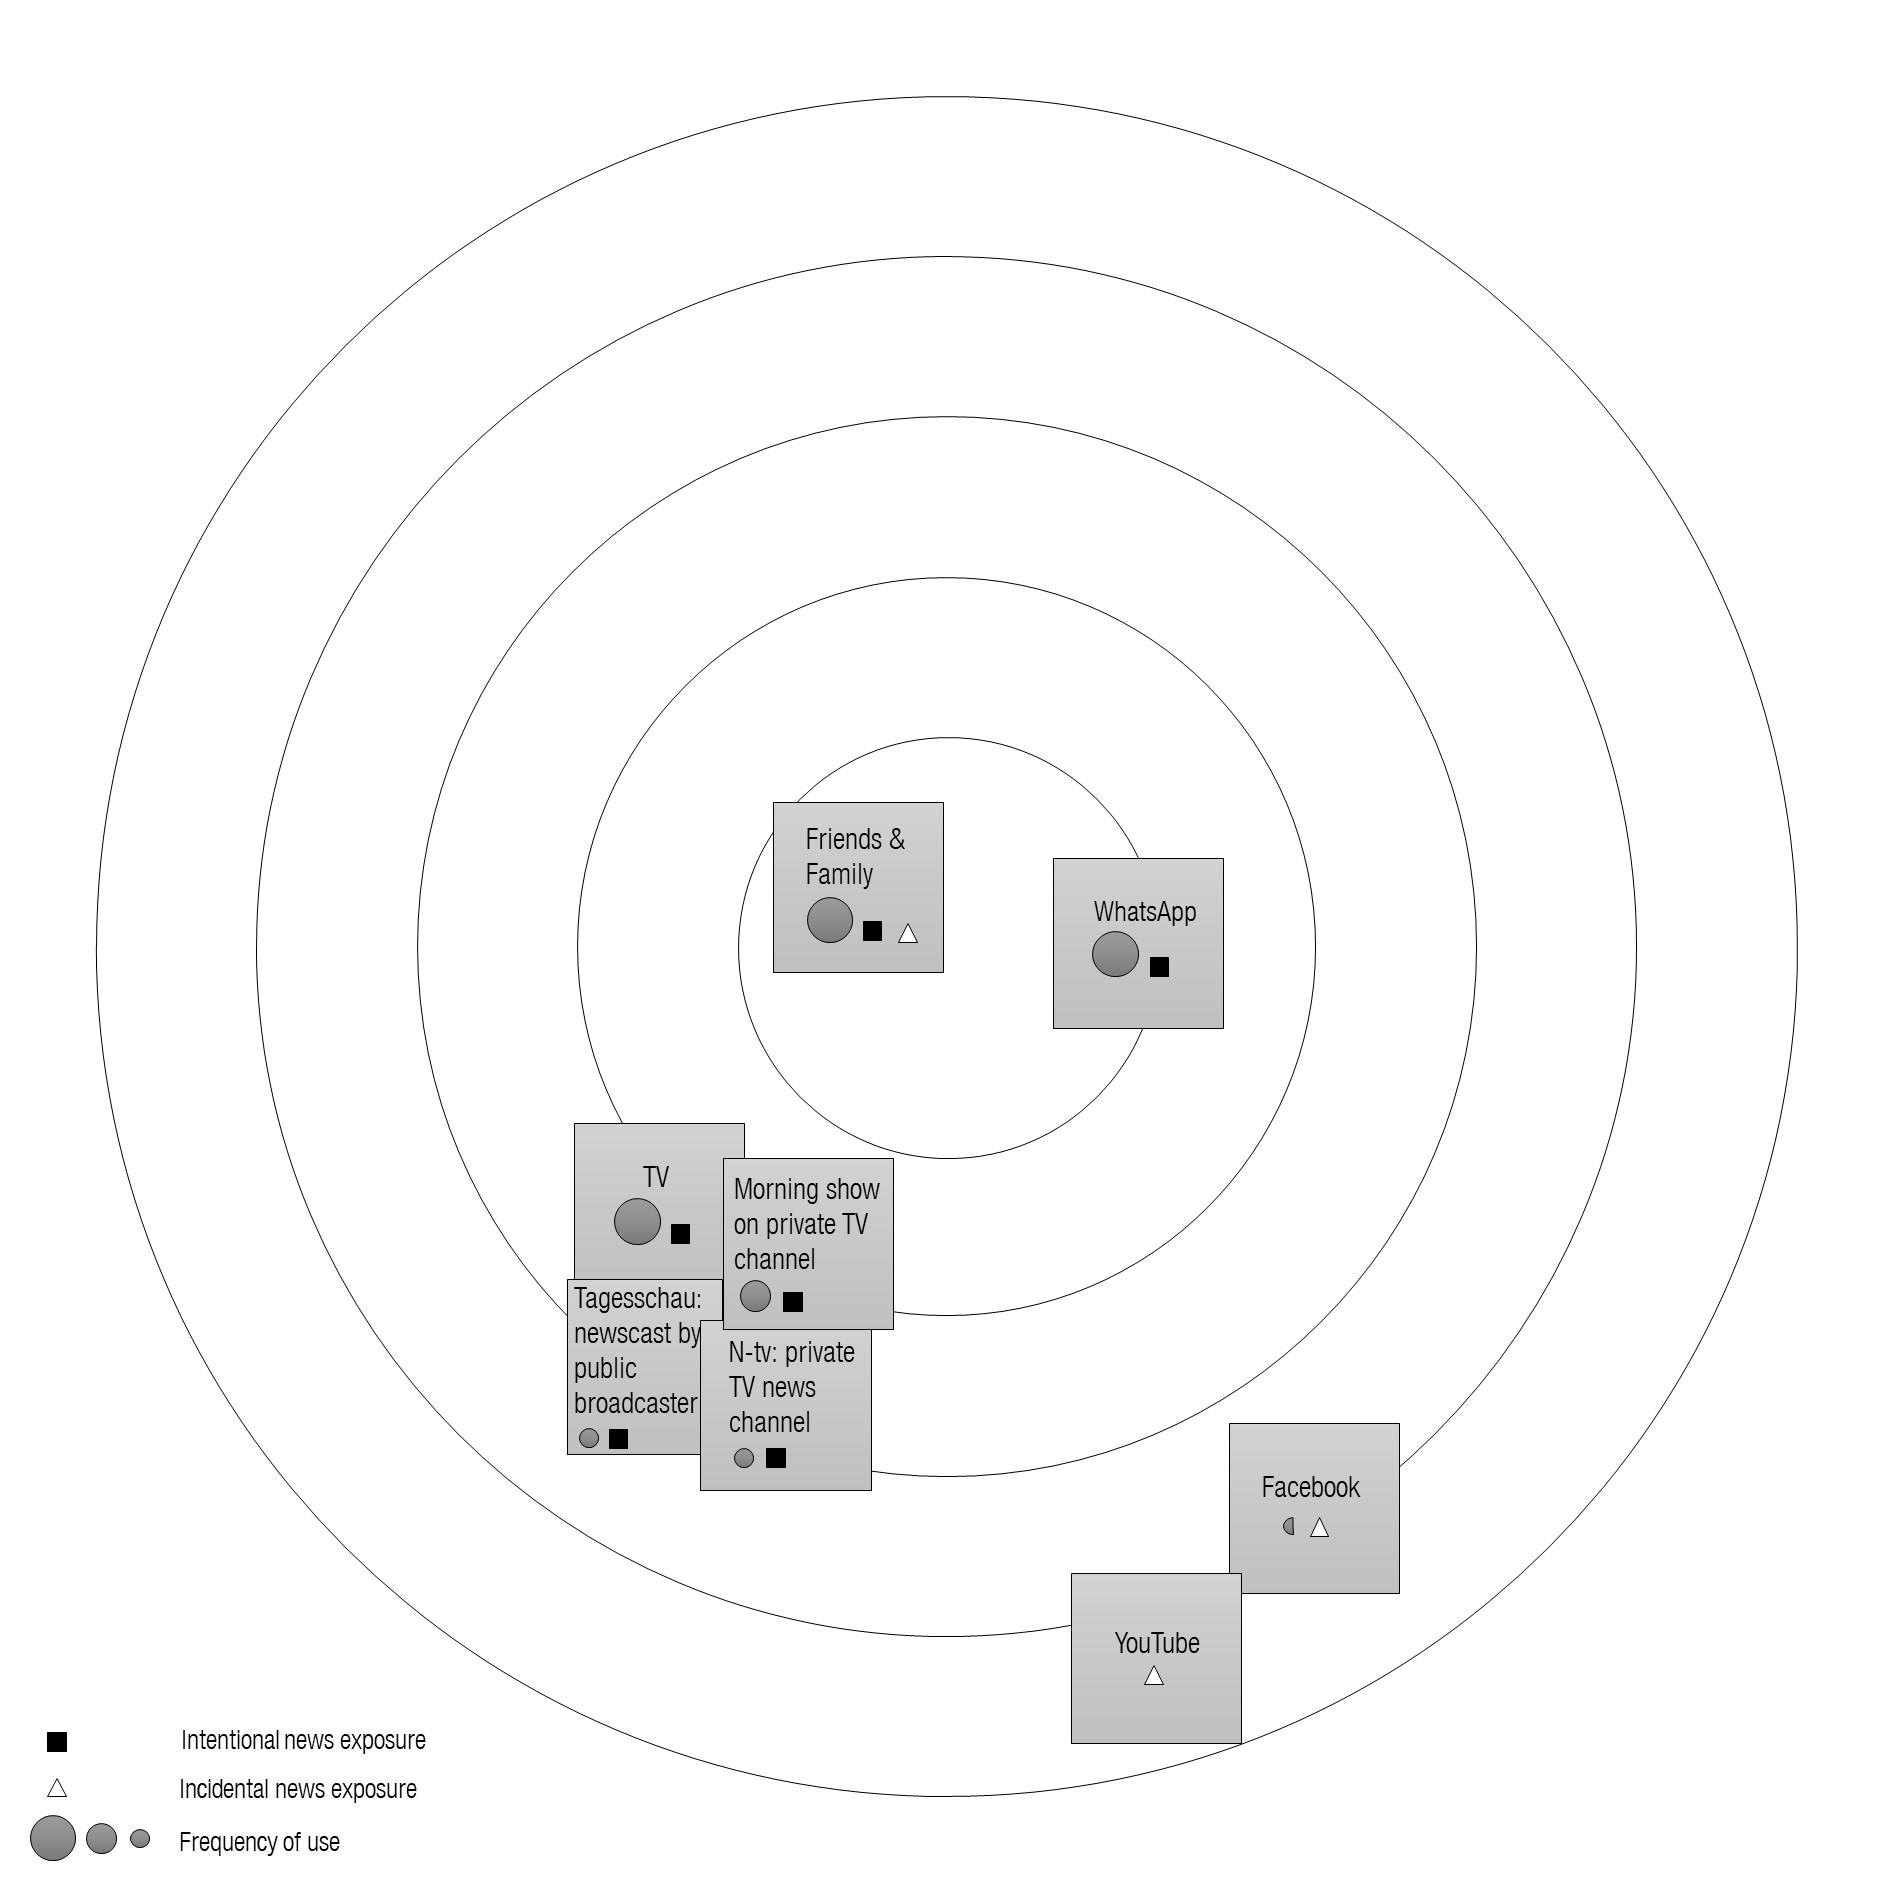
Figure 3: Labeling task: Labels are placed onto the cards according to the frequency of use and ways of exposure. Please click here for an enlarged version of Figure 3. [21]
During each interview, the information presented in the repertoire maps and through the participants' commentary was used as the starting point for further explorations of their use through participant observation and thinking-aloud techniques, similar to the approaches employed by SCHAAP (2001) and (MATHIEU & PAVLÍČKOVÁ, 2017). We asked participants to demonstrate how they used a particular medium, Facebook for example, and the processes they went through when using the medium, for example, checking their Facebook newsfeed, while taking into account their personalized repertoire map and what they discussed during the interview. Screenshots of their media activities were recorded. Once the interview was complete, interviewees were asked to review the repertoire map in its entirety and were given the opportunity to amend it if they saw fit. [22]
By reconstructing and visualizing the media repertoire of each individual using the repertoire cards, we were able to gather information on how relevant social media are as part of their media repertoire and how they are incorporated into their news consumption practices. The maps were digitized and formed the basis for individual case studies in combination with the interview transcripts, structured and coded with MAXQDA software. For the purpose of the analysis and publishing, the repertoire maps were further condensed by visualizing the frequency of use, the sources' circle size and the intentionality of usage through the use of diagrammatic arrows instead of the labels (arrow aiming from the ego to source = intentional news exposure, arrow aiming from source to ego = incidental exposure). For the illustration in this article the names of the sources were replaced by media logos or symbols (see Figure 4 for the condensed version of Lucas repertoire map). From these condensed maps, we could gather structure-focused, actor-focused and tie-focused description of the individual repertoires in the analysis that will be discussed more extensively in Sections 4.1 and 4.5. [23]
We applied a further thematic coding approach as demonstrated in HEPP et al. (2016) across the data material (interview transcripts, repertoire maps, screenshots) in line with our research question on the relevance and incorporation of social media in practices of news use. During the coding process, news related information practices with and through media were conceived as a multi-step-process divided among six different categories (HASEBRINK, SCHULZ, HELD, SPRENGER & RZADKOWSKI, 2009): Information gathering and the acquisition of knowledge; perceiving the public agenda; perceiving frames; perceiving the climate of opinion in relevant groups; forming attitudes and opinions; forming intentions and acting upon them. In terms of relevance, content was coded along various categories such as frequency and rhythm of use, typical occasions of use, attachment to the platform, perceived contribution to information and opinion formation, significance/contribution in comparison to other sources, and specific occasion of news consumption involving the platform. Since the relevance of intermediaries in information repertoires differs greatly between the various intermediaries, in relation to individual preferences and platform-specific affordances, practices were also coded along platform categories (e.g., via Twitter, Facebook, Instagram, Google Search). The coding procedure was left open to new categories that were inductively derived based on the empirical data. [24]
Based on the analysis of the maps and the codings each interview team (lead interviewer and assistant) wrote a portrait of each group and individual that summarized the main aspects of the interview and map following a fixed structure. In a final step the whole research team (three researchers and two student assistants) gathered for a two-day workshop to jointly answer the research questions based on all available material (portraits, maps, codings, and transcripts). The results of the research project are more thoroughly described in SCHMIDT, MERTEN, HASEBRINK, PETRICH & ROLFS (2017) and SCHMIDT, MERTEN, HASEBRINK, PETRICH & ROLFS (2019).
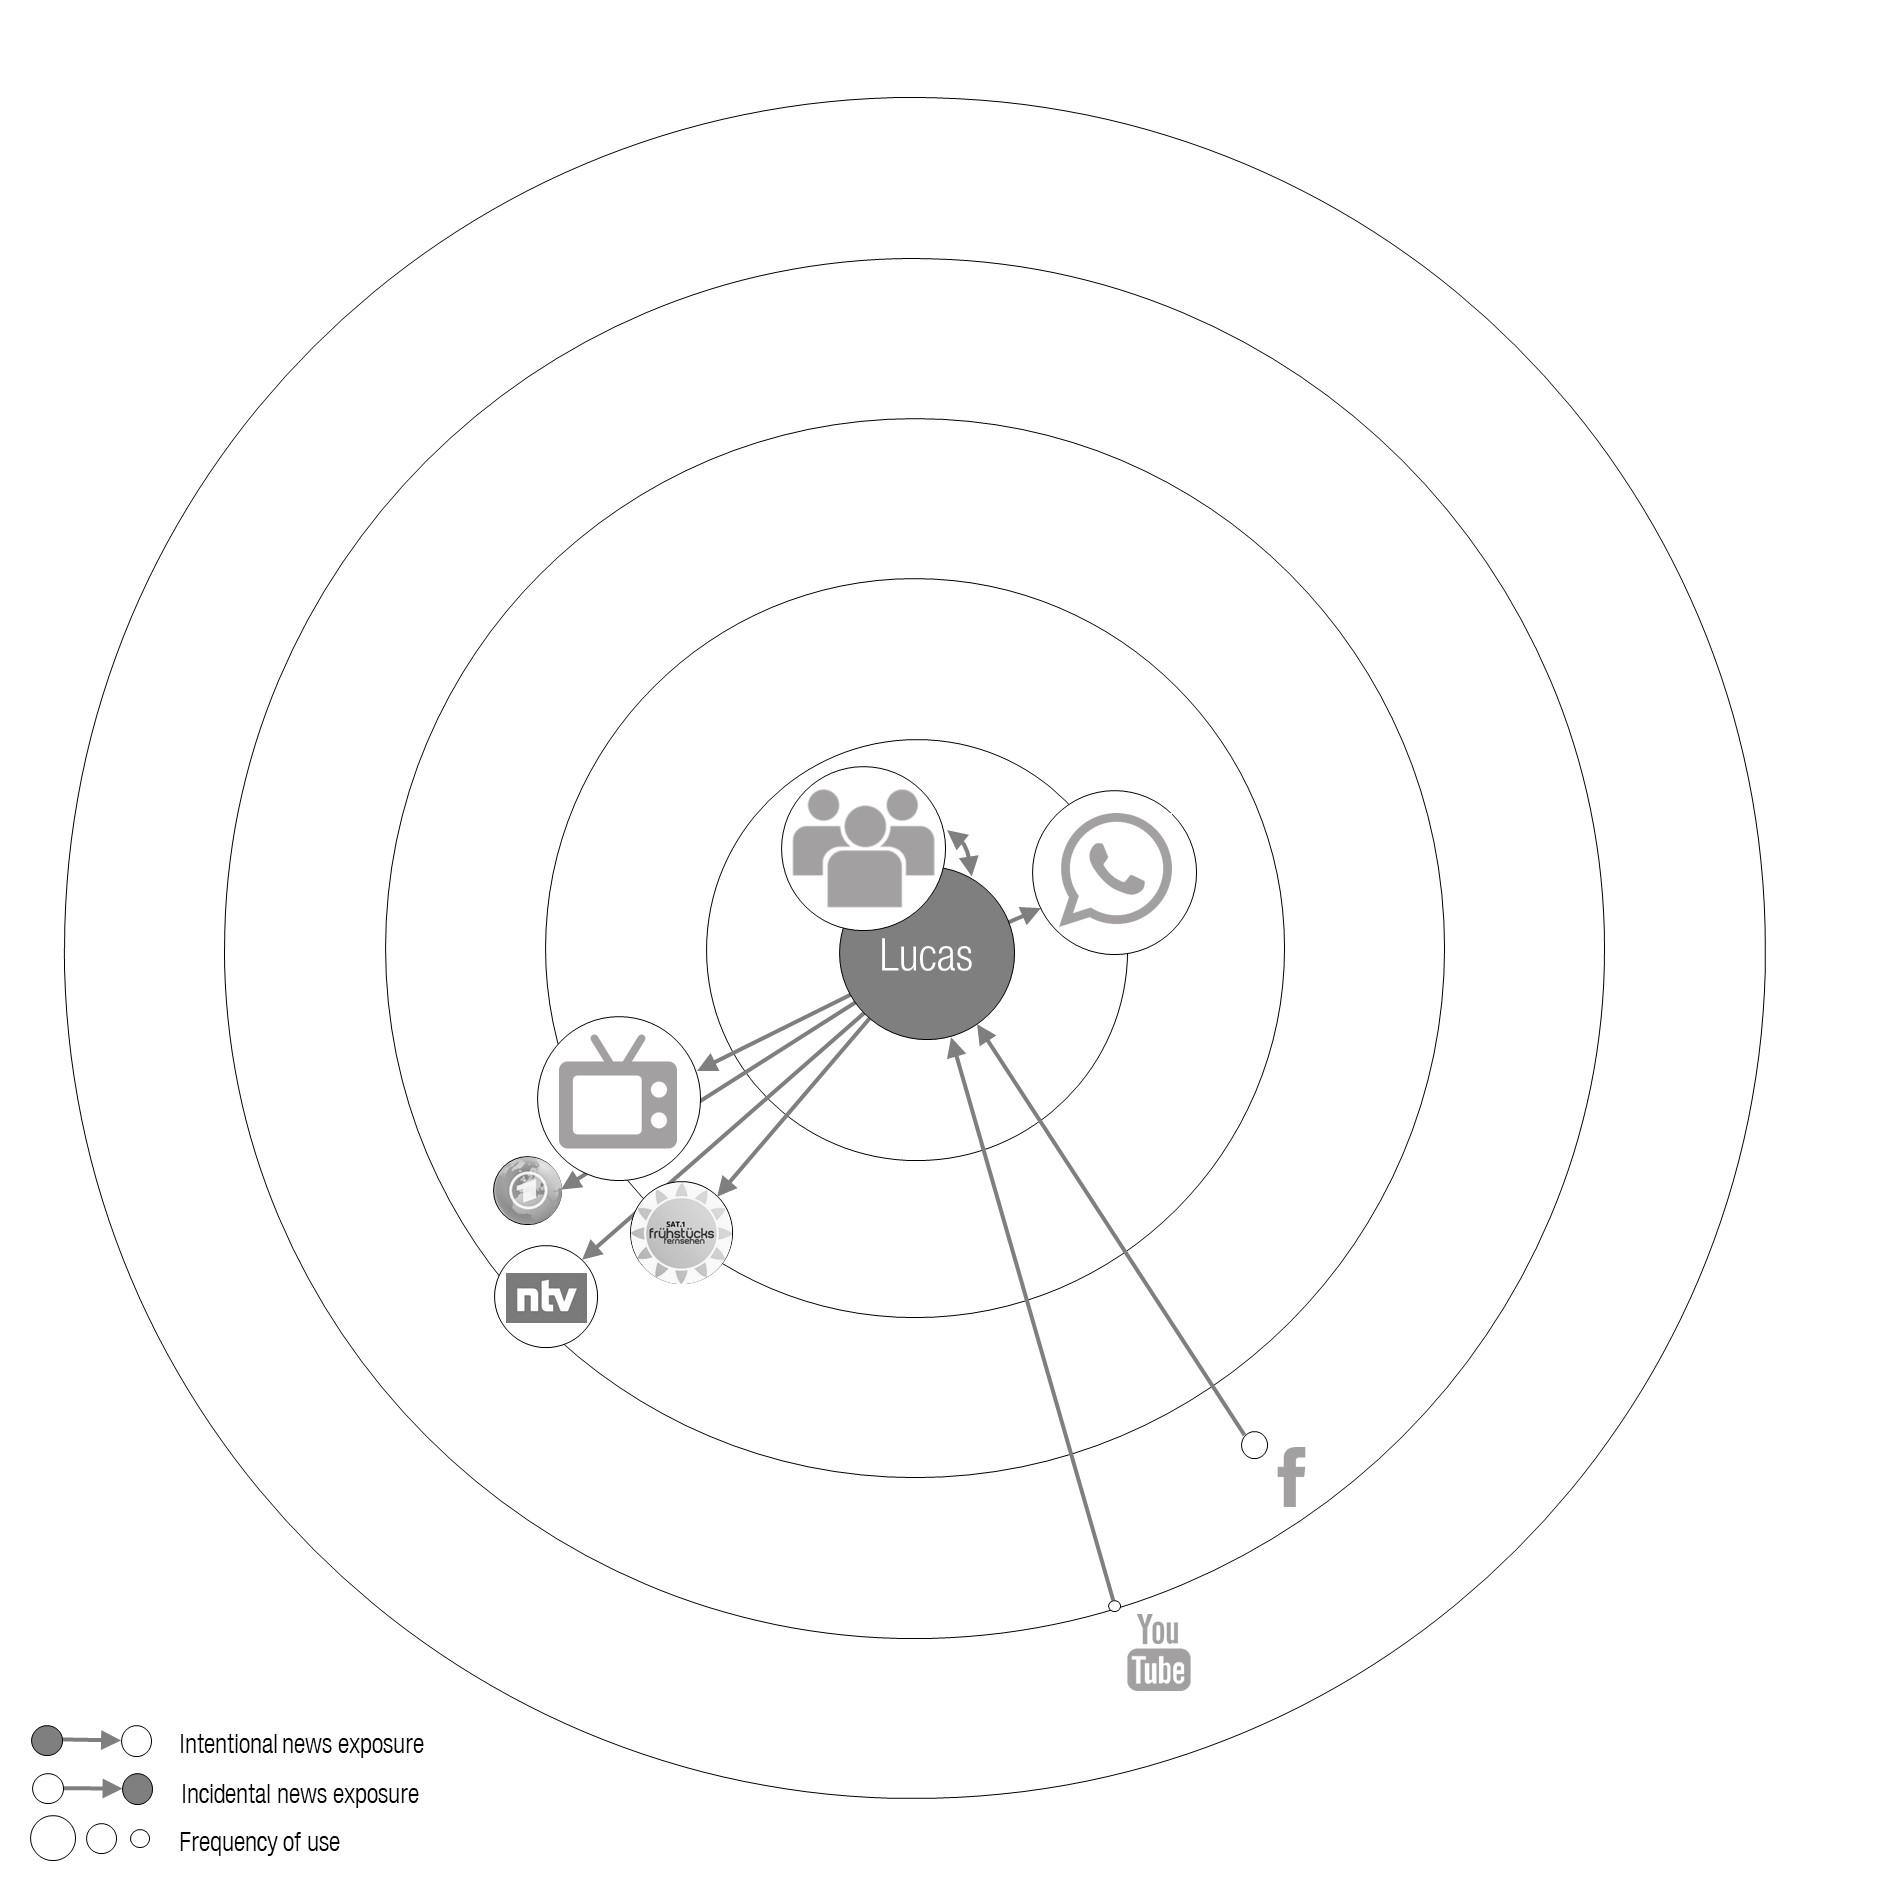
Figure 4: Condensed repertoire map of Lucas (age 23). See notes in Appendix 1 for the names of each source. Please click here for an enlarged version of Figure 4. [25]
4. Scope and Challenges of the Repertoire Mapping Approach
The maps add several additional benefits to the research design relating not only to the actual interview process (Sections 4.1-4.3) but also to the analytical dimension of the media repertoires (Sections 4.4-4.6) that I discuss in relation to data gathered on three participants of similar age, Lucas (23), Stephanie (22) and David (27) (Figures 4, 5, 6). Their maps demonstrate noticeable differences in the composition of the information repertoires and the extent to which social media played a role. In the discussion on the participants' maps and their social media practices I will focus on Facebook as it was the social media service that was 1. used by all three participants described here, 2. the most widely used social media service in our study in the context of news consumption, and 3. the most common social media platform for German internet users in general in 2017 (HÖLIG & HASEBRINK, 2017). Facebook is also prototypical in following a cross-media logic. In recent years the platform has shifted from being a user-based network (e.g., holiday pictures, status updates) to being a "meta-medium that relies on a controlled, networked flow of content" also produced by e.g., journalists or political actors (MATHIEU & PAVLÍČKOVÁ, 2017, p.427). [26]
4.1.1 Structuring complex patterns
One main advantage of using repertoire maps to assemble visualizations is the structuring properties that they afford the interviewee, the interviewer and the researchers analyzing the data. The interviewee has the challenging task of giving an exhaustive answer to the seemingly simple question ("What sources do you use to get information on events and issues beyond your friends and family?"). A comprehensive answer must take into account all the relevant media, people, and intermediaries, and even include nuances in personal significance. The repertoire map offers an opportunity for the interviewee to systematically and exhaustively describe the repertoire. The presence of a clear visual representation of the subjective repertoire during the interview provides cognitive relief or support that permits a simplification of the normally complex patterns of media use (HASEBRINK & DOMEYER, 2012). As far as qualitative network maps are concerned, it has been found that the process of mapping aids in the interviewer's recognition and comprehension of the nodes described as well as offering a narrative structure, therefore, being useful not only during the interview itself but in its subsequent interpretation (BERNARDI, KEIM & VON DER LIPPE 2006; STRAUS 2002). In our project the maps instantly provided a concise overview and allowed researchers to quickly grasp the differences and similarities in a media repertoire. In a way, information from the maps was validated with the participant observation and the qualitative interview and vice versa. [27]
The use of the board with its concentric circles provided a useful and unrestricted framework upon which participants could focus on describing their media repertoires without too much deviation and it helped to plainly express the idea of media repertoires, individual patterns of use and the relevance of social media. [28]
Lucas is a twenty-three-year-old office management trainee who visualized his subjective repertoire with eight cards, that have already been depicted and discussed in the description of the research procedure (see Section 3). Stephanie, a twenty-two-year-old management assistant, mapped a repertoire of fifteen cards very much shaped by social media applications: She uses Instagram, Snapchat, Facebook, WhatsApp, and YouTube several times a day (larger symbol size) and regards them as her most important sources (symbols close to the center). In contrast to Lucas, Stephanie marked these online intermediaries as sources of incidental (arrow from source to ego) but also intentional news exposure (arrow from ego to source). She deliberately visits YouTube to follow a news YouTuber and opens Facebook to learn from a friend who is a journalist about demonstrations of the extreme right. Traditional journalistic media, such as (online) newspapers or broadcasting were placed as considerably smaller circles (less frequent use) on the outer edges of her repertoire (least important). Stephanie feels that the established mainstream media fails to report the news objectively and prefers to rely on (personal) contacts via social media, yet she gets some information about local (news) events from a radio station.

Figure 5: Repertoire map of Stephanie (age 22). The names of each source and explanatory classification (if necessary) are
listed in Appendix 2. Please click here for an enlarged version of Figure 5.[29]
David, a twenty-seven-year-old student is, in stark contrast to the other two participants, an avid user of traditional journalistic media. On his repertoire map, one can see almost thirty different information sources, many of them related to traditional mass media. Among the sources he mapped as his most highly valued information sources were daily and weekly newspapers, the online edition of a weekly newspaper, and the video-on-demand platforms provided by public broadcasters.
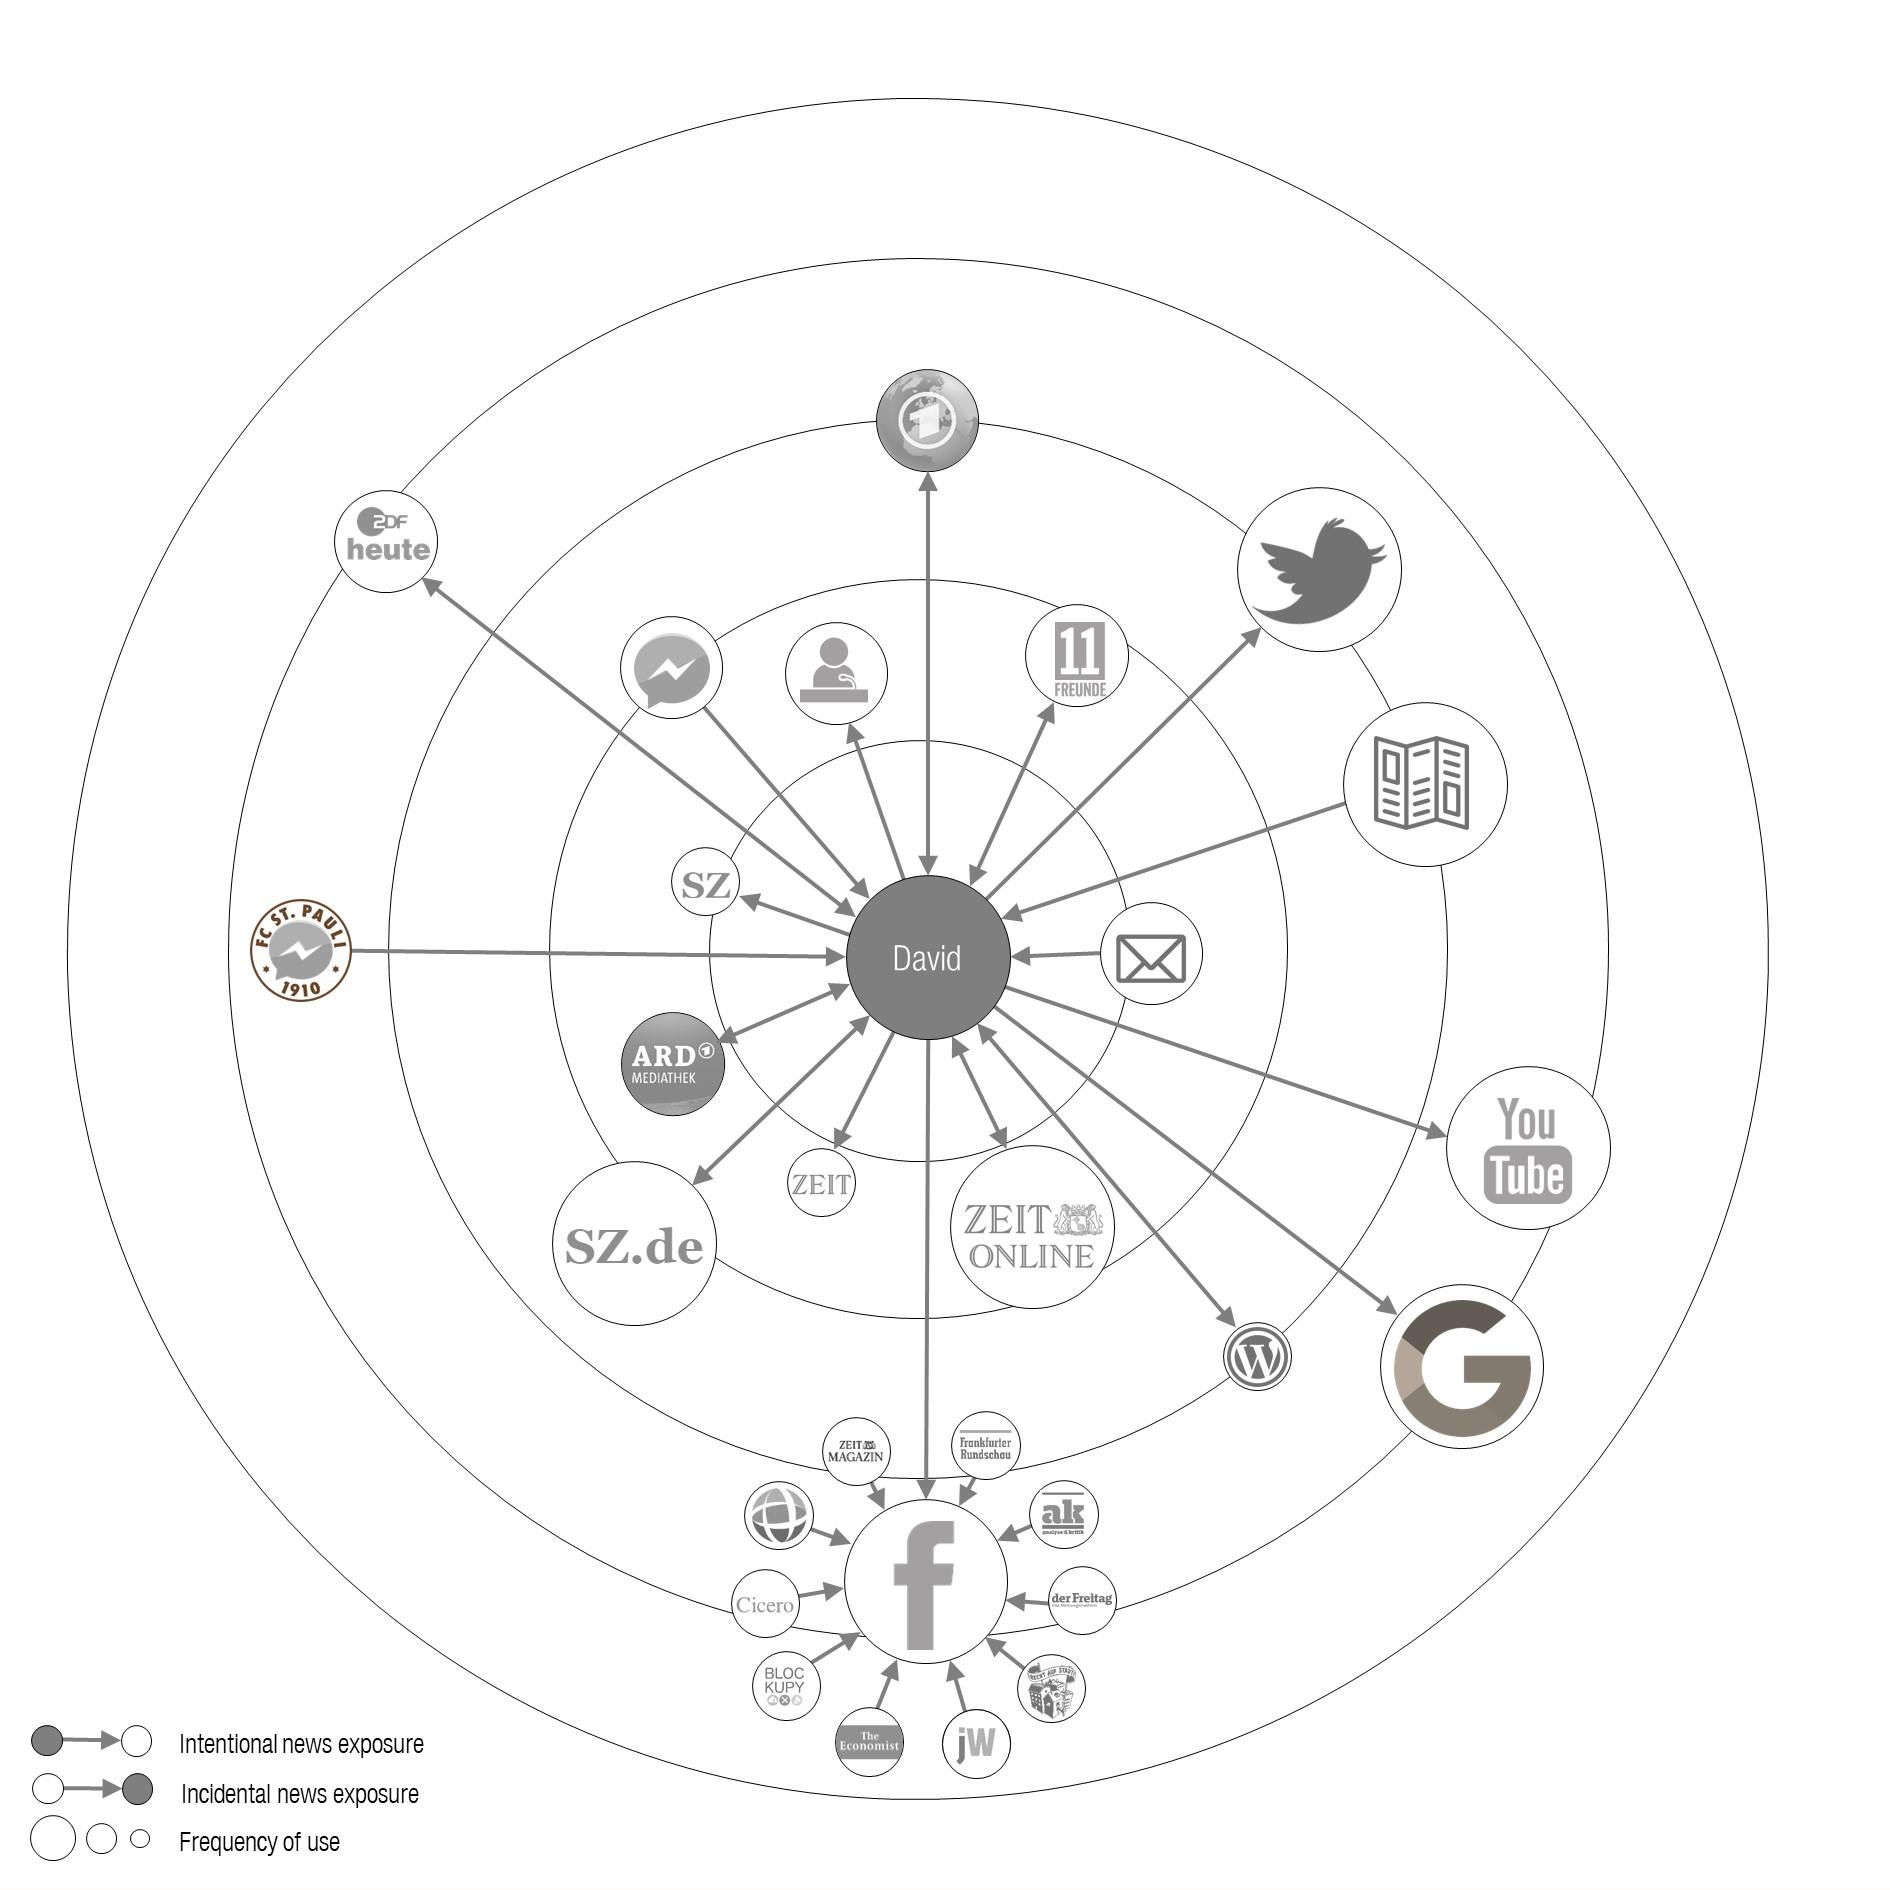
Figure 6: Repertoire map of David (age 27), names and explanatory classifications of the sources are listed in Appendix 3. Please click here for an enlarged version of Figure 6. [30]
The character of the source generation task and the sorting task compels the interviewee to 1. categorize certain media as news sources, and 2. position, and thereby rank them based on a dimension of importance. The definition of a news-source and news-worthiness long held by communication researchers and journalists is challenged by the audience's perception due to the loss of the journalistic monopoly of information selection and interpretation and the ever-changing pathways to news via mobile devices and information intermediaries (EDGERLY, 2017; WALL, 2018). Unstandardized qualitative methods are able to address current volatile categorization agreements between researchers and participants in regard to the concept of news (VRAGA, BODE, SMITHSON & TROLLER-RENFREE, 2016). Consequently, exactly what to define as a news source is similarly blurred. The debate as to whether to categorize information intermediaries as news sources, as media companies or as neutral distributors concerns actors beyond communication research in relation to, for example, the possible need for legal regulation. [31]
Through the mapping task, we elicited if and how these challenges in intermediary categorization were perceived among the respondents. When David was asked to demonstrate with the cards the news sources that make up his news repertoire, he reflected on the difficulty he faced when reducing his Facebook-related news use into the dimensions provided by the repertoire maps.
"Should I write down all sites I have subscribed to or those that come to my mind spontaneously or should I just write down Facebook or what? The content is not really from Facebook itself. If I write Facebook now, then it is not exclusive content, but Facebook is just the platform. I cannot really systematize that, because when I see that the Gängeviertel [community project] has its own page here and Hamburg Mittendrin [local news website] or Publikative.org [platform documenting right-wing extremism] or something. I seldom visit the pages in a targeted manner, but they always come up in my feed either with their own content or with content that they recommend. [...] That is why I am having a bit of a hard time right now. Do I now take the original source or the source that shared the content with me? [...] I don't get along so well with so much freedom. [...] It is important to me that I know and can name the actual source that holds the intellectual property. Well, I would never quote Facebook as a source. I think it is always only the mediation or filter platform. [32]
This quote gives insight into the way David perceived this categorization challenge, how he struggled with our request that he state a source, how he reflected on his own behavior and developed an argument for his decision to not categorize Facebook as an actual news source. [33]
4.1.2 Stimulus for conversation and reflection
As shown in the previous paragraph prompting our participants to categorize certain media as a news source and to then sort sources along dimensions of relevance, frequency of use and intentionality allows them to reflect on their own media actions. One the one hand the sorting and labeling tasks has the potential to raise respondents' awareness of the complexities of media convergence and their personal media use. On the other hand, through these prompts, characteristics and categories for systematizing these complexities were being developed and spoken about during the interviews. Difficulties in the naming and sorting process were inherent to our study design and are actually desired in terms of the goal of capturing the subjective media logics and theories related to the functioning of information intermediaries (see also Section 4.2.3). [34]
The next quote illustrates how David, compelled to reduce his news repertoire to these dimensions, elaborated on his beliefs about trust in media brands, journalists and social media users and his preference for editorial news selection over an algorithmically determined news feed.
"I would actually position flyers a bit further out, because I always see a kind of agenda behind them and that is not completely objective reporting for me. In the case of Süddeutsche [quality newspaper], for example, I would place more trust in the offline version than the online version, because there's some kind of algorithm behind it that shifts articles up or down, and especially since these online platforms or online media are also dependent on clicks, and that's something I have to be careful about. Yes, these St.Pauli-Facebook-Groups [professional soccer team], because they are public, everyone can post there and even anonymously. That is why I would rather put them on the fringe of the circles and consider them as a loose inspiration. I would classify ZDF Heute and Tagesschau [two television news shows] more or less the same, but not in the first ring, also a bit in the second or third ring. Exactly, and as far as the TV on demand platforms are concerned, this is of course the most detailed or meticulous examination of a topic. Or comparatively speaking, a long article from ZEIT [quality newspaper] can of course be correspondingly extensive. Yes, it is hard to say how I classify that now. So already in this area. All right, we have to consider that the frequency does not play a role yet. It is about reliability and importance." [35]
For most participants the distinction between the importance of the cards (according to their proximity to the center of the map) and the frequency of use visualizations (marked by labels in the original and circle size in the condensed version) provided references for reflection on congruence or dissonance and created space for the revalidation of previously made statements. For Lucas and Stephanie, the importance of a source and frequency of use were mostly consistent with each other, which they also noticed during the labeling task.
"So in the middle is what I really use every day and that is also what is most important to me. And down here, what is on the outside with the newspapers and stuff, I never really use. Daily newspapers online from time to time and Google and Pinterest when I have time or when I'm really interested in something. [...] All the stuff that is in the middle, I think I could never do without it" (Stephanie). [36]
On David's map, a difference in frequency of use and subjective importance can be detected. For example, David mapped the print issues of quality newspapers such as SZ (Süddeutsche Zeitung, left of center on first ring) and Zeit (below center on first ring) as some of his most important sources. Nevertheless, their symbols are of smaller size since he only buys and reads the print issues from time to time. A number of information intermediaries such as Google, YouTube, Twitter and Facebook were marked with the largest circular labels and are now visualized with large symbols to indicate daily use but were placed furthest from the ego. [37]
Facebook is an important part of his repertoire since he has intentionally "liked" several news accounts. He values content originating from these sources and reads them almost every time they appear in his newsfeed. However, at the same time, the preselection applied through algorithmic filtering made him unwilling to move the platform closer to the center of his map: "Filtering implemented by people that I know or at least some journalistic mechanism that I know is reliable. And I don't know how these mechanisms operate on Facebook and Twitter." [38]
Overall, the sorting tasks served as a starting point not only for follow-up dialogues and a deeper level of discourse during the interview but also for the demonstration of user practices afterwards. Additionally the maps also served as important stimuli for a productive interview experience. Asking the participants to work with material at the beginning of the interview facilitated a relaxed atmosphere that helped them to disregard the artificial setting and overcome any insecurities they may have had. This is an observation that has been made during ego-centered mapping as well, for example, by BERNARDI et al. (2006) or HINTERMAIR (2009) who describe how the relatively seamless interaction between interviewer and interviewee made it easier for both sides to overcome uncertainties and encouraged new narrative impulses. Through the presence of the different cards on the map, the conversation could easily be (re)directed toward certain sources. In general, the creation of network maps has a very low refusal rate, especially when standardized (HEPP, 2015; STRAUS, 2002) and the repertoire maps were broadly accepted by participants. [39]
The materials required for the mapping process were both affordable and portable. By virtue of its simplicity, it can be used regardless of a participant's language skills or socioeconomic status. Participants had no trouble placing the labels and adapting them to describe their individual repertoires and circumstances. Lucas, for example, placed just half of the smallest label onto the space allocated on his map for Facebook (right below center on the map) because, as he said, "I don't use it daily, sometimes I don't use it at all for a week." Others placed several labels onto the cards to depict their behavior appropriately (see, for example, the labels/arrows marking intentional and incidental news exposure for WhatsApp on Lucas' map) or did not place any labels at all to express a very low frequency of use (e.g., legacy newspapers and television broadcasters below center on the outer ring on Stephanie's map). The cards were interchangeable, and as participants added them, they were able to reflect on their information repertoires and the ways they consumed news. Participants used this flexibility to add, remove or rearrange cards during the interview and had firm control throughout their maps' design process. There were no standards or presets for the designation of the concentric circles; their relevance was determined by the interviewee. Only after prompting the interviewee to place the cards in order of importance, the interviewers inquired further into the meaning of "importance" for each interviewee. [40]
4.2.1 Openness and flexibility to account for convergence
For this research project we aimed to provide a relatively unbiased respondent-generated account of the most significant information sources in individuals' everyday lives without any presumptions of any particular medium or media. Each participant was given the space to describe whatever he or she thought was a good source of information with no restrictions placed on media form, device or genre. This open, qualitative design was intended to ensure that users' subjective perceptions and their lifeworlds were captured adequately and rendered precisely and to gather as much information as possible. Lucas for example, named more general forms of mass media (television) on his map alongside face-to-face communication with friends and family and specific broadcasters (n-tv, a privately-owned news station) in contrast to specific television formats (Tagesschau, Germany's most popular newscast, produced by a public broadcaster). The open nature of the repertoire maps allowed us to observe the contribution of emergent media forms and to capture all information sources independently of either past or (possible) future forms of news consumption. Furthermore, the attributes of the labeling tasks are interchangeable; for example, a distinction between rather active (sharing, commenting, wiring news) and rather receptive (reading) could be illustrated or news sources that the participants pay for could be marked. [41]
4.2.2 Compatibility with dimensions of qualitative structural analysis
HERZ et al. (2015) argue that researchers analyzing qualitative network maps "face the central challenge of finding how they can do justice, or continue to do justice, to the structural approach of network research, but at the same time involve the (meaning-laden) constitution of social structures in their analysis" (§4) and, therefore, introduce a method for qualitative structural analysis. Our approach allows researchers to follow their three-part proposal of structure-focused, actor-focused and tie-focused dimensions of map analysis that has been adapted from formal socio-centric quantitative network analysis (HERZ et al., 2015). [42]
In relation to the structural dimension of analysis, the maps allow for the exploration of cohesion and equivalence in the news repertoire. When comparing the density of the repertoire maps differences between Lucas' and David's maps it becomes apparent that their differences in diversity and quantity of news sources are mirrored by their depiction of their daily news use. Furthermore, one can identify certain subcomponents or clusters such as television-related news sources in the lower left area of Lucas' map that he deems a reliable and relevant section of his daily repertoire. [43]
For the positional analysis the given structure of the concentric circles makes it possible to examine if two sources have equivalent positions in an individual's map. One can see on Lucas' map that friends and family and WhatsApp as news sources have an equal symbol size and distance from the ego. He regards both highly connected because "I have contact with friends and acquaintances in WhatsApp, so that somehow belongs together." The positional analysis of the maps also allows for interpersonal comparisons across all the three repertoires. In Lucas' and Stephanie's maps WhatsApp is similarly positioned as close to the ego as possible whereas WhatsApp was not placed by David at all. [44]
Table 1 shows comparisons of source placement for YouTube, Facebook, Google and a popular television news format (Tagesschau) across all 18 participants (including the three cases previously discussed in italics). For example, one can gather from the table that Facebook is placed less often onto the repertoire maps than the other sources. It was only placed by the young adults in the sample and often sorted more peripherally than other sources. Google was positioned within the repertoire by 11 of the 18 participants varying in age and is sorted across the spectrum from very central to rather peripheral. This interpersonal comparison of distances to the ego allowed us, combined with the interviews, to assess the importance of social media and other information intermediaries such as search engines or YouTube as a source of news.
|
Position of the news source |
Center |
Annulus 1 |
Annulus 2 |
Annulus 3 |
Annulus 4 |
|
|
- |
Stephanie (22) |
|
Jasmin (22) Lucas (23) Fabian (25) David (27) Lenia (30) |
- |
|
|
Alexander (15) Constanze (18) Thomas (49) Barbara (66) |
Franz (15) Lothar (66)
|
Stephanie (22) Dieter (54)
|
Sabine (66) David (27) |
Jasmin (22) |
|
YouTube |
Luisa (17) Stephanie (22)
|
Franz (15) |
Fabian (25) |
Alexander (15) Lucas (23) David (27) Thomas (49) |
Lenia (30) Lothar (66) |
|
Tagesschau/ tageschau.de (popular news show on television) |
Franz (15) Thomas (49) Sabine (66) |
Alexander (15) Lucas (23) Fabian (25) David (27) Lenia (30) |
- |
- |
Stephanie (22) Jasmin (22) |
Table 1: Source positions comparatively across all participants (age)2) [45]
In terms of the actor-focused dimension of analysis (or in our case news-source focused), a description of the centrality of individual media sources can, to some extent, be interpreted from a repertoire map. One can see, for example, how in David's map Facebook is a central hub that connects him to a variety of news sources, literally embodying its characteristics as an intermediary. Through the circular labels, the participants assigned certain properties to the nodes on the maps in terms of frequency of use and these also can be interpreted and compared. For example, Facebook was marked by the smallest (Lucas), a medium (Stephanie) or the largest label (David) on the maps. [46]
Data from the tie-focused dimension of analysis can be gathered from the triangular and square labels that were, in the analysis stage, transformed into arrows to indicate the intentionality of news exposure. The directions of the arrows and therefore the dominance of intentional or incidental news exposure can be compared across individual maps or across news sources. While Lucas gets most of his news intentionally (arrow: ego to source) online intermediaries such as Facebook and YouTube are sources of incidental news exposure (arrow: source to ego). Lucas described in his interview how he visits these platforms searching for entertainment or social relations but nevertheless comes into contact with news e.g., via YouTubers that give their political opinions or Facebook activating its In-Safety-Feature during certain catastrophic events so friends and family can mark themselves as safe on the platform, thereby informing users about such an event in the first place. By contrast, Stephanie marked these online intermediaries as sources of incidental and intentional news exposure. While she also "stumbles upon news" (KIM, CHEN & GIL DE ZUÑIGA, 2013, p.2607) she also deliberately visits YouTube to follow a news YouTuber and opens Facebook to learn from a friend who is a journalist about extreme-right demonstrations. David described Twitter and Facebook as his "newspaper stand" and sees these platforms as sources of intentional news exposure which can only be gathered from the direction of the arrows from the center to the ego. He even maintains two different Facebook profiles to tailor the platform to his needs:
"I now have one Facebook profile for communication only, for private communication in messages and so on. And one profile for information retrieval. This gives me a bit of hope that I a) can spread my usage patterns and make them anonymous and b) can trust the newsfeed a little bit more." [47]
However, not all potential ties between ego and news sources mentioned in the interviews are visualized on the map, an aspect that I elaborate on in the following section. [48]
4.2.3 Visualizing the interrelatedness between "old" and "new" media
During the mapping exercise the conceptual notion of media convergence became clear in a number of ways. At times, it proved challenging for participants that had a high level of media reflection to write and place cards due to the lack of classification the map itself provided. David had trouble systemizing his repertoire, experiencing confusion toward the different levels and ranges of possible sources for news consumption. He was unsure whether to place Facebook as an information intermediary and filtering platform on the map or all of the individual accounts that he gets his information from on Facebook. At first, he decided to place a card representing Facebook in his repertoire map even though he attributed all news content received to the different news organizations he is following, describing himself as very sensitive towards the origin of everything in his Facebook newsfeed. At the end of the interview, and after completing and discussing the maps and the thinking aloud exercise, David felt that the sources he frequents via Facebook were underrepresented on the map. He chose to add ten Facebook accounts from news organizations that he has "liked" to receive their content in his newsfeed. The kind of reflections and renegotiation that followed these kinds of situations gave us as researchers insight into the participants understanding of news sources and the functionalities and complementarities within an individual's overall information repertoire. [49]
Lucas, on the other hand, does not value Facebook as a source of meaningful news at all, which is consistent with the physical position of the platform on his map. When demonstrating his use during the interview he stressed his dissatisfaction with the content of his newsfeed and the amount of uncivil discussions and hate speech around political and news issues. His comments on these uses coincided with the labeling of the Facebook card not only with half of the smallest circular label for minimal use but also with the assignment of the triangle label for incidental news exposure. [50]
The interrelation of Stephanie's Facebook use and other media was more difficult to deduce from her map. After further inquiry, she explained that she accesses traditional mass media sources such as the Tagesschau newscast or the online editions of newspapers mainly via Facebook when following posts shared by her Facebook friends. This connection is not particularly clear from her repertoire map. She described in the interview that she received a lot of information on current events from a friend working as a journalist via his Facebook page, which cannot in any way be deduced from the map but seems to be one of her most important sources of news exposure. [51]
Here Stephanie's naming of her source was already informative for the researchers and held meaning in regard to underlying repertoire logics. While David chose to map all the sources he accesses via Facebook separately, the news content in Stephanie's newsfeed is not visible in her map. For her the online intermediary with various de- and re-bundled news content is much more salient than the specific journalistic organizations that produce the content. [52]
An aim of our mapping approach was not only to address positional questions of importance and relevance of the sources but to also explore more relational aspects: How are the news sources linked to each other? In developing this mapping technique, the research team discussed alternative ways of visualizing these kinds of connections. We considered using arrows to connect different sources or mark access paths to the different media on the card (e.g., via Facebook, own homepage, sent by a friend). Originally the participants in the pre-test stage were asked to add their access paths to the different sources around the cards. However, the pretesting demonstrated that these variations were too complicated and inflexible due to the two functionalities the social media platforms and other intermediaries represent to participants. On the one hand, a Facebook card was placed as a source of information itself on the map, while one the other, it was a gateway that lead to other news sources. Adding a social media service to the map twice or more as an information source led to confusion during pretesting. We decided to prioritize a simple design and an open structure since a denser, complex design containing extra material would have meant that making changes during the mapping exercise would have been overly challenging for the participants. Nevertheless, we would have preferred to more prominently visualize the interrelation between different sources on the maps. [53]
Overall, the combination of mapping, interviews and observation provided in-depth insights into the position of digital social media and other intermediaries such as search engines, multimedia platforms and instant-messaging services within media repertoires and everyday informational practices (SCHMIDT et al., 2017, 2019). The general use of intermediaries among our respondents was widespread. The participants addressed different informational needs with their intermediary use, partly through directed searches for specific information (especially via search engines, and in some cases on YouTube), partly through unplanned encounters with information and opinions (e.g., in a Facebook newsfeed) or encounters with information and opinions initiated by others from their extended network (e.g., via WhatsApp messages). Facebook was the dominant social network site. Almost all respondents were at least familiar with the platform, either through previous use or through observations of family members, friends, or colleagues. However, regular Facebook users were found only among the two groups of young adults (twenty to thirty years). While they all reported to have at least some exposure to news outlets on the site, only two information-savvy respondents mentioned without being prompted their strategies of active curation and customization of information repertoires on Facebook, including traditional journalistic sources as well as niche interests or counter-publics. By contrast, the other young adults do not consider Facebook to be a central element of their news-related repertoires and practices, stressing its predominant purpose as a tool or space for the maintenance of social contacts. [54]
In our study the Facebook users (as well as the nonusers) had a basic knowledge of its general functionalities, even though detailed knowledge such as on options to change personalization settings, was unevenly distributed. The interviewees also demonstrated a general understanding of business models and advertising and active social media users were aware of their intermediaries' corporate connections (Facebook owns WhatsApp and Instagram, Alphabet owns Google and YouTube). Most users were, to a certain extent, aware of the existence and the (approximate) mechanisms of algorithmic personalization. Not all of them connected prioritization and personalization directly with their own user behavior, though. Sabine (66), for example, confessed that it took her "a while to realize that there was a mechanism behind it. I've always wondered, how do they know I'm interested? But then I was a bit naïve." [55]
Across all participants social media sites and other intermediaries were usually not the central information hub for news and other information on socially relevant events and topics, mainly because our interviewees considered offline mass media, other online journalistic sources, and personal contacts to be more valuable. [56]
In this article, I have introduced repertoire maps and illustrated the value that these maps can bring to a qualitative research design. The main function of this method for our research project was to gain insights into and facilitate a conversation about the participant's media repertoire. While writing the cards, placing them on the board, and attributing functions, the participants were able to consistently reflect on their decisions and provide elaborate insights into their news consumption practices. The repertoire maps were a shared and objectified foundation for communication and provided the basis for the reconstruction of the respective news media repertoires considered during analysis. [57]
In the variability of formats, channels, devices, and platforms documented on the maps, the completed maps depict a changing media environment and the users' attempts to grasp this transformation. The difficulties some participants faced when placing and categorizing contemporary news media such as social media platforms are in a way symptomatic of their diverse characteristics and the phenomenon of convergence. For some participants such as David it was a challenge to place these new "actors" alongside traditional journalistic sources, while for others such as Lucas or Stephanie it came naturally. In this way, the combination of interview, mapping and demonstrations of social media use provided insight into the changing practices of news consumption and how these platforms are conceptualized as a news source itself or rather as a medium to reach (other) journalistic outlets. [58]
The combination of interviews, mapping, and observation of the participant's media use can help us understand the effects of cross-media practices and reveal the specific structures and processes of news use across a variety of sources. As mentioned above, a major factor here is undoubtedly the fact that the repertoire map is a tool that easily lends itself to a variety of uses and allows for numerous modifications that allows it to be adapted to a particular thematic interest and the individual circumstances of those interviewed.
User practices: The very process of mapping, observing and interviewing allows researchers to reconstruct the media practices, interactions, and activities of the subject in context. It could support the analysis of news use with a focus on specific sources such as news aggregators or search engines. Another focus could be news repertoires related to special interests or to certain topics, such as asking people to map the repertoire they would use to make up their mind about a voting decision or a public health crisis.
Changes in media use: The procedure can be adapted to very different issues and phenomena and is especially suited to experiences arising from changing media and communication practices; it not only reveals the presence of new sources of information but also relates them to traditional news sources making it possible to identify processes of transformation. As far as media transformation is concerned, observing the dynamics of a repertoire could be interesting and could be tracked via repertoire maps to illustrate hybridization and which sources become relevant over time.
Specific users: One outcome of the design's ease of use is the possibility of changing the degree of requirement and complexity in almost any way. Network maps have been shown to be applicable to a huge variety of participants (HOLLSTEIN & STRAUS, 2006) and the repertoire maps should work for other audiences such as children, older adults, and across cultural contexts as well. They offer the potential to explore which news sources are relevant to users in diverse life situations (children, old age) or differentiated by other sociodemographic factors or according to media interest or orientation. A promising avenue could be to employ the mapping task with a focus on users that produce news content, mapping, for example, journalistic sources or sources of audience feedback. [59]
For qualitative network mapping several digital applications have been developed over the years such as Vennmaker or EasyNWK. Currently a digital mapping tool that focuses on the incorporation of media actors is being developed at the University of Bremen.3) New digital software applications might allow for an analysis of the temporal order of the card positioning and prevent bias in the placement due to space restrictions and also be able to fruitfully incorporate digital traces. [60]
Overall, qualitative network maps such as repertoire maps can provide useful clues for the analysis of media repertoires. Their strength lies in the explorative nature of repertoires and the interpretative possibilities they offer (in terms of orientation and evaluation) as well as their potential to describe media practices and the understanding of repertoire effects and dynamics. It can be easily applied to other phenomena or issues related to media and communications research and is especially suited to explorative analysis that analyzes emerging issues or those that remain to be addressed by the social sciences. Compared to the qualitative interview on its own, the map added the structural qualities afforded by visualization resulting in a certain level of reflection and abstraction of participants' repertoires. By balancing the openness of the research design with the maps, we are able to locate a degree of comparison and standardization within them. On the other hand, we gathered more contextualized data and provided a greater degree of openness than we could have gathered via a simple questionnaire or formal quantitative social network analysis. Compared to most metrics gathered by digital traces we were able to gather information across all platforms and devices, depict and analyze the direction of travel between them, and contextualize them alongside the interpretations offered by the interviewee. [61]
The research design was developed as part of the research project "Relevanz einzelner Medienangebote und digitaler Dienste für die Meinungsbildung" together with Jan-Hinrik SCHMIDT and Uwe HASEBRINK, Leibniz Institute for Media Research. I want to thank the participants for their valuable insights, time, and willingness to map and Marc KUSHIN for language editing. The research was partly financed by Association of German State Media Authorities in 2016 with 33.752,00 Euro. I declare that there is no conflict of interest.
Appendix 1: Sources Lucas4)
WhatsApp: Picture by Freepik, https://www.flaticon.com/free-icon/whatsapp_1384023 [CC BY 3.0]
Facebook: Picture by Pixel perfect, https://www.flaticon.com/free-icon/facebook_2111392 [CC BY 3.0]
YouTube: Picture by Freepik, https://www.flaticon.com/free-icon/youtube-logotype_49084 [CC BY 3.0]
Frühstücksfernsehen, morning show on a private television channel: Picture by Sat.1, https://de.wikipedia.org/wiki/Datei:Neues_Logo_vom_Sat.1-Fr%C3%BChst%C3%BCcksfernsehen_2011.jpg
NTV: Picture by Mediengruppe RTL Deutschland, https://commons.wikimedia.org/wiki/File:N-tv_logo-september2017.svg
Tagesschau, most popular German newscast by public broadcaster: Picture by Tagesschau ARD, http://www.tagesschau.de/
Television: Picture by Freepik, https://www.flaticon.com/free-icon/television_167119 [CC BY 3.0]
Friends and family: Picture by T. WEBER via The Noun Project, https://commons.wikimedia.org/wiki/File%3ACommunity_Noun_project_2280.svg [CC BY 3.0]
Appendix 2: Sources Stephanie5)
Heute in Hamburg, blog on local events: Picture by Haspa Next GmbH, https://aino.hamburg/so-gehts-weiter-mit-heute-in-hamburg-und-der-haspa-next/
WhatsApp: Picture by Freepik, https://www.flaticon.com/free-icon/whatsapp_1384023 [CC BY 3.0]
Friends and family: Picture by T. WEBER via The Noun Project, https://commons.wikimedia.org/wiki/File%3ACommunity_Noun_project_2280.svg [CC BY 3.0]
Instagram: Picture by Freepik, https://www.flaticon.com/free-icon/instagram_174855 [CC BY 3.0]
Google: Picture by Freepik, https://www.flaticon.com/free-icon/search_281764 [CC BY 3.0]
Tagesschau, most popular German newscast by public broadcaster: Picture by Tagesschau ARD, http://www.tagesschau.de/
Radio Hamburg, local radio station: Picture by C. BIER via Wikimedia Commons, https://upload.wikimedia.org/wikipedia/commons/b/b7/Radio_Hamburg.svg [Public domain]
Magazines: Picture by Freepik, https://www.flaticon.com/free-icon/magazine_1885 [CC BY 3.0]
Websites of different newspapers: Picture by A. HERNANDEZ, https://www.flaticon.com/free-icon/newspaper_579941 [CC BY 3.0]
Newspaper: Picture by Freepik, https://www.flaticon.com/free-icon/newspaper_115785 [CC BY 3.0]
LeFloid News, YouTube show of a popular YouTuber Le Floid: Picture by Le Floid/Florian MUNDT, https://www.youtube.com/channel/UCLm6s42r_wCbBX0QqXNCTwg
YouTube: Picture by Freepik, https://www.flaticon.com/free-icon/youtube-logotype_49084 [CC BY 3.0]
Facebook: Picture by Pixel perfect, https://www.flaticon.com/free-icon/facebook_2111392 [CC BY 3.0]
Snapchat: Picture by Freepik, https://www.flaticon.com/free-icon/snapchat_174870 [CC BY 3.0]
Pinterest: Picture by Freepik, https://www.flaticon.com/free-icon/pinterest_145808 [CC BY 3.0]
Appendix 3: Sources David6)
Tagesschau, most popular German newscast by public broadcaster: Picture by Tagesschau ARD, http://www.tagesschau.de/
11 Freunde, soccer magazine: Picture by 11 Freunde Gruner & Jahr, https://commons.wikimedia.org/wiki/File:11_Freunde.svg
Twitter: Picture by Pixel perfect, https://www.flaticon.com/free-icon/twitter_733635 [CC BY 3.0]
Brochures/Leaflets: Picture by Freepik, https://www.flaticon.com/free-icon/brochure-folded_81905 [CC BY 3.0]
E-mail conversations with friends: Picture by S. GABRIEL via Wikimedia Commons, https://commons.wikimedia.org/wiki/File:New-email-envelope-back-symbol-in-circular-outlined-button.svg [CC BY 3.0]
YouTube: Picture by Freepik, https://www.flaticon.com/free-icon/youtube-logotype_49084 [CC BY 3.0]
Google: Picture by Freepik, https://www.flaticon.com/free-icon/search_281764 [CC BY 3.0]
Different Blogs about soccer teams and politics: Picture by Roundicons Premium, https://www.flaticon.com/premium-icon/wordpress_536493 [CC BY 3.0]
Zeit Online, website of a quality newspaper: Zeit Online GmbH via Wikimedia Commons, https://upload.wikimedia.org/wikipedia/commons/9/98/Logo_Zeit_Online_2017.svg [Public domain]
Facebook: Picture by Pixel perfect, https://www.flaticon.com/free-icon/facebook_2111392 [CC BY 3.0]
Frankfurter Rundschau, quality newspaper: Picture by Frankfurter Rundschau GmbH via Wikimedia Commons, https://upload.wikimedia.org/wikipedia/commons/4/4e/Frankfurter_Rundschau_logo.svg [Public domain]
Analyse & Kritik, political magazine: Picture by analyse & kritik via Wikimedia Commons, https://commons.wikimedia.org/wiki/File:Ak_Logo_RGB.jpg [CC BY-SA 3.0]
Der Freitag, quality newspaper: Picture by Der Freitag via Wikimedia Commons, https://upload.wikimedia.org/wikipedia/commons/4/49/LogoFreitag.svg [Public domain]
Recht auf Stadt, initiative against gentrification: Picture by Radio Dreyeckland, https://rdl.de/beitrag/recht-auf-stadt-bewegung-zwischen-basisorganisation-und-parteipolitik [CC BY 2.0]
Junge Welt, political newspaper: Picture by Junge Welt via Wikimedia Commons, https://commons.wikimedia.org/wiki/File:Jw_logo-3c-einzeln.jpg [CC BY-SA 4.0]
The Economist, news magazine: Picture by The Economist via Wikimedia Commons, https://upload.wikimedia.org/wikipedia/commons/b/ba/TheEconomistLogo.svg [Public domain]
Blockupy, website of a political movement: Picture by Blockupy, https://twitter.com/blockupy
Cicero, political magazine: Picture by Cicero via Wikimedia Commons, https://commons.wikimedia.org/wiki/File:Cicero-Logo.svg [Public domain]
Netzpolitik.org, blog on digital rights and culture: Picture by netzpolitik.org via Wikimedia Commons, https://commons.wikimedia.org/wiki/File:Netzpolitik.org_Logo.svg [CC BY-NC-SA 4.0.]
Zeit magazine, weekly magazine of "Die Zeit": Picture by ZEIT GmbH, http://www.zeit.de/zeit-magazin/index
Die Zeit, weekly quality newspaper: Zeit Online GmbH via Wikimedia Commons, https://upload.wikimedia.org/wikipedia/commons/9/98/Logo_Zeit_Online_2017.svg [Public domain]
SZ.de, website of the quality newspaper Süddeutsche Zeitung: Picture by Süddeutsche Zeitung GmbH, screenshot made by Ibea via Wikimedia Commons, https://commons.wikimedia.org/wiki/File:Screenshot-sz-header-2015-12-29.PNG [Public Domain]
Video on demand platforms of public broadcasters e.g., ARD Mediathek: Picture by ARD Digital, https://www.testberichte.de/p/ard-digital-tests/mediathek-testbericht.html
FC St. Pauli, soccer fan club group in Facebook messenger: Picture by St. Pauli, https://en.wikipedia.org/wiki/File:FC_St._Pauli_logo.svg
Süddeutsche Zeitung, quality newspaper: Picture by Süddeutsche Zeitung GmbH, screenshot made by Ibea via Wikimedia Commons, https://commons.wikimedia.org/wiki/File:Screenshot-sz-header-2015-12-29.PNG [Public Domain]
ZDF heute, newscast by public broadcaster: Picture by Zweites Deutsches Fernsehen, https://commons.wikimedia.org/wiki/File:Zdfheute-grey.svg [Public Domain]
Facebook Messenger: Picture by Pixel perfect, https://www.flaticon.com/free-icon/messenger_2111399 [CC BY 3.0]
Public lectures and other information events: Picture by Freepik, https://www.flaticon.com/free-icon/speaker-giving-a-lecture-on-a-stand_33708 [CC BY 3.0]
1) All names of interviewees in this article are pseudonyms. <back>
2) The term annulus describes the region between two concentric circles. In this exemplary analysis sources placed directly onto the circles are grouped by the more central annulus, n=18. <back>
3) Research project, financed by the German Research Foundation at University of Bremen 2018-2021: "The Sustainable Provision of Software for Cross-Media Practices and Digital Traces Research. A 'Co-Creation Approach' for Developing an Infrastructure Model for the Digital Diary and Sorting Apps MeTag and MeSort" byAndreas HEPP, Florian HOHMANN, Alessandro BELLI, see https://www.kommunikative-figurationen.de/en/projects/research-software/ [Accessed: February 14, 2020]. <back>
4) Sources listed by source symbols in Figure 4 (in a clockwise direction starting from upper middle). All URLs had been rechecked on March 12, 2020. <back>
5) Sources listed by source symbols in Figure 5 (in a clockwise direction starting from upper middle). All URLs had been rechecked on March 12, 2020. <back>
6) Sources listed by source symbols in Figure 6 (in a clockwise direction starting from upper middle). All URLs had been rechecked on March. 12, 2020. <back>
Ananny, Mike & Crawford, Kate (2017). Seeing without knowing: Limitations of the transparency ideal and its application to algorithmic accountability. New Media & Society, 20(3), 973-989.
Autenrieth, Ulla (2014). Die Bilderwelten der Social Network Sites. Bild-zentrierte Darstellungsstrategien, Freundschafts-kommunikation und Handlungsorientierungen von Jugendlichen auf Facebook und Co. Baden-Baden: Nomos.
Barnes, John Arundel (1969). Networks and political process. In James Clyde Mitchel (Ed.), Social networks in urban situations. Analyses of personal relationships in central African towns (pp.51-76). Manchester: Manchester University Press.
Battaglia, Michael (2011). Nonprobability Sampling. In Paul J. Lavrakas (Ed.), Encyclopedia of Survey Research Methods (pp. 523-526). New York, NY: Sage.
Bernardi, Laura; Keim, Sylvia & von der Lippe, Holger (2006). Freunde, Familie und das eigene Leben. Zum Einfluss sozialer Netzwerke auf die Lebens- und Familienplanung junger Erwachsener in Lübeck und Rostock. In Betina Hollstein & Florian Straus (Eds.), Qualitative Netzwerkanalyse (pp.359-390). Wiesbaden: VS Verlag für Sozialwissenschaften.
Bjur, Jakob; Schrøder, Kim; Hasebrink, Uwe; Courtois, Cédric; Adoni, Hanna & Nossek, Hillel (2014). Cross-media use: Unfolding complexities in contemporary audiencehood. In Nico Carpentier, Kim Schrøder & Lawrie Hallett (Eds.), Routledge studies in European communication: Vol. 1; Audience transformations: Shifting audience positions in late modernity (pp.15-29). New York, NY: Routledge.
Bode, Leticia (2016). Political news in the news feed: Learning politics from social media. Mass Communication and Society, 19(1), 24-48.
Bodo, Balazs; Helberger, Natali; Irion, Kristina; Zuiderveen Borgesius, Frederik; Möller, Judith; van de Velde, Bob; Bol, Nadine; van Es, Bram & de Vreese, Claes (2017). Tackling the algorithmic control crisis: The technical, legal, and ethical challenges of research into algorithmic agents. Yale Journal of Law and Technology, 19, 133,180, https://digitalcommons.law.yale.edu/cgi/viewcontent.cgi?&article=1127&context=yjolt [Accessed: February 26, 2020].
Bott, Elisabeth (1957). Family and social network. London: Tavistock.
Bucher, Tania & Helmond, Anne (2018). The affordances of social media platforms. In Jean Burgess, Alice Marwick & Thomas Poell (Eds.), The Sage handbook of social media (pp.233-253). Thousand Oaks, CA: Sage.
Butts, Carter (2008). Social network analysis: A methodological introduction. Asian Journal of Social Psychology, 11(1), 13-41.
Choi, Junho & Danowski, James (2002). Making a global community on the net—global village or global metropolis? A network analysis of usenet newsgroups. Journal of Computer-Mediated Communication, 7(3), https://doi.org/10.1111/j.1083-6101.2002.tb00153.x [Accessed: February 26, 2020].
Coleman, James; Katz, Elihu & Menzel, Herbert (1957). The diffusion of an innovation among physicians. Sociometry, 20(4), 253-270.
Coleman, James; Katz, Elihu & Menzel, Herbert (1966). Medical innovation: A diffusion study. Indianapolis, IN: Bobbs-Merrill.
Diaz-Bone, Rainer (2006). Review Essay: Gibt es eine qualitative Netzwerkanalyse?. Forum Qualitative Sozialforschung / Forum: Qualitative Social Research, 8(1), Art. 28, http://dx.doi.org/10.17169/fqs-8.1.224 [Accessed: February 26, 2020].
Dubois, Elizabeth & Blank, Grant (2018). The echo chamber is overstated: The moderating effect of political interest and diverse media. Information, Communication & Society, 21(5), 729-745, https://doi.org/10.1080/1369118X.2018.1428656 [Accessed: February 26, 2020].
Edgerly, Stephanie. (2017). Making sense and drawing lines. Journalism Studies, 18(8), 1052-1069.
Emirbayer, Mustafa & Goodwin, Jeff (1994). Network analysis, culture, and the problem of agency. American Journal of Sociology, 99(6), 1411-1451.
Fine, Marlene (1981). Soap opera conversations: The talk that binds. Journal of Communication, 31(3), 97-107.
Freeman, Linton (2000). Visualizing social networks. Journal of Social Structure, 1(1). Online only.
Gibson, James J. (1966). The senses considered as perceptual systems. London: Allen and Unwin.
Haim, Mario; Graefe, Andreas & Brosius, Hans-Bernd (2018). Burst of the filter bubble?. Digital Journalism, 6(3), 330-343.
Hasebrink, Uwe & Domeyer, Hanna (2012). Media repertoires as patterns of behaviour and as meaningful practices: A multimethod approach to media use in converging media environments. Journal of Audience and Reception Studies, 9(2), 757-779.
Hasebrink, Uwe & Hepp, Andreas (2017). How to research cross-media practices? Investigating media repertoires and media ensembles. Convergence: The International Journal of Research into New Media Technologies, 23(4), 362-377.
Hasebrink, Uwe & Popp, Jutta (2006). Media repertoires as a result of selective media use. A contextual approach to the analysis of patterns of exposure. Communications, 31(3), 369-387.
Hasebrink, Uwe; Schulz, Wolfgang; Held, Thorsten; Sprenger, Regine & Rzadkowski, Nora (2009). Macht als Wirkungspotenzial. Zur Bedeutung der Medienwirkungsforschung für die Bestimmung vorherrschender Meinungsmacht. Berlin: Friedrich-Ebert-Stiftung.
Hepp, Andreas (2010). Netzwerk und Kultur. In Christian Stegbauer & Roger Häußling (Eds.), Handbuch Netzwerkforschung (pp.227-236). Wiesbaden: VS Verlag für Sozialwissenschaften.
Hepp, Andreas (2015). Qualitative Netzwerkanalyse. In Stefanie Averbeck-Lietz & Michael Meyen (Eds.), Handbuch nichtstandardisierte Methoden in der Kommunikationswissenschaft (pp.347-368). Wiesbaden: VS Verlag für Sozialwissenschaften.
Hepp, Andreas; Berg, Matthias & Roitsch, Cindy (2014). Mediatized worlds of communitization: Young people as localists, centrists, multi-localists and pluralists. In Andreas Hepp & Friedrich Krotz (Eds.), Mediatized worlds: Culture and society in a media age (pp.174-203). London: Palgrave.
Hepp, Andreas; Bozdag, Cigdem & Suna, Laura (2012). Mediatized migrants: Media cultures and communicative networking in the diaspora. In Leopoldina Fortunati, Raul Pertierra & Jane Vincent (Eds.), Migration, diaspora, and information technology in global societies (pp.172-188). London: Routledge.
Hepp, Andreas; Roitsch, Cindy & Berg, Matthias (2016). Investigating communication networks contextually: Qualitative network analysis as cross-media research. MedieKultur: Journal of Media and Communication Research, 32(60), 87-106, https://doi.org/10.7146/mediekultur.v32i60.21614 [Accessed: February 26, 2020].
Herz, Andreas; Peters, Luisa & Truschkat, Inga (2015). How to do qualitative structural analysis? The qualitative interpretation of network maps and narrative interviews. Forum Qualitative Sozialforschung / Forum: Qualitative Social Research, 16(1), Art. 9, http://dx.doi.org/10.17169/fqs-16.1.2092 [Accessed: February 26, 2020].
Hintermair, Manfred (2009). The social network map as an instrument for identifying social relations in deaf research and practice. American Annals of the Deaf, 154(3), 300-310.
Hölig, Sascha & Hasebrink, Uwe (2017). Reuters Institute Digital News Survey 2017 – Ergebnisse für Deutschland. Working Paper Series, Hans-Bredow-Institut, Hamburg, Germany, https://www.hans-bredow-institut.de/uploads/media/Publikationen/cms/media/2d87ccdfc2823806045f142bebc42f5f039d0f11.pdf [Accessed: April 26, 2020].
Hollstein, Betina (2006). Qualitative Methoden und Netzwerkanalyse — ein Widerspruch? In Betina Hollstein & Florian Straus (Eds.), Qualitative Netzwerkanalyse (pp.11-35). Wiesbaden: VS Verlag für Sozialwissenschaften.
Hollstein, Betina & Pfeffer, Jürgen (2010). Netzwerkkarten als Instrument zur Erhebung egozentrierter Netzwerke. In Hans-Georg Soeffner (Ed.), Unsichere Zeiten. Herausforderungen gesellschaftlicher Transformationen. Verhandlungen des 34. Kongresses der Deutschen Gesellschaft für Soziologie in Jena 2008. CD-Rom. Wiesbaden: VS Verlag für Sozialwissenschaften, http://www.pfeffer.at/egonet/Hollstein%20Pfeffer.pdf [Accessed: February 26, 2020].
Hollstein, Betina & Straus, Florian (Eds.) (2006). Qualitative Netzwerkanalyse. Wiesbaden: VS Verlag für Sozialwissenschaften.
Jones, Alasdair (2018). Revisiting Bott to connect the dots: an exploration of the methodological origins of social network analysis. Forum Qualitative Sozialforschung / Forum: Qualitative Social Research, 19(2), Art. 5, http://dx.doi.org/10.17169/fqs-19.2.2905 [Accessed: February 26, 2020].
Ju, Alice; Jeong, Sun & Chyi, Hsiang (2013). Will social media save newspapers?. Journalism Practice, 8(1), 1-17.
Kahn Robert L. & Antonucci, Toni (1980). Convoys over the life course: Attachment, roles, and social support. In Paul B. Baltes & Orville G. Brim (Eds.), Life-span development and behavior (pp.254-283). New York, NY: Academic Press.
Katz, Elihu & Lazarsfeld, Paul (1955). Personal influence: The part played by people in the flow of mass communications. New York, NY: The Free Press.
Kesselring, Sven (2006). Topographien mobiler Möglichkeitsraume. Zur soziomateriellen Netzwerkanalyse von Mobilitätspionieren. In Betina Hollstein & Florian Straus (Eds.), Qualitative Netzwerkanalyse (pp.332-358). Wiesbaden: VS Verlag für Sozialwissenschaften.
Kim, Yonghwan; Chen, Hsuan-Ting & Gil de Zuñiga, Homero (2013). Stumbling upon news on the Internet: Effects of incidental news exposure and relative entertainment use on political engagement. Computers in Human Behavior, 29(6), 2607-2614.
Kramp, Leif & Loosen, Wiebke (2018). The transformation of journalism: From changing newsroom cultures to a new communicative orientation?. In Andreas Hepp, Andreas Breiter & Uwe Hasebrink (Eds.), Communicative figurations: Transforming communications in times of deep mediatization (pp.205-239). Cham: Springer.
Kümpel, Anna; Karnowski, Veronika & Keyling, Till (2015). News sharing in social media: A review of current research on news sharing users, content, and networks. Social Media + Society, 1(2), 1-14, https://doi.org/10.1177/2056305115610141 [Accessed: February 26, 2020].
Löblich, Maria & Pfaff-Rüdiger, Senta (2011). Network analysis. International Communication Gazette, 73(7), 630-647.
Mathieu, David & Pavlíčková, Tereza (2017). Cross-media within the Facebook newsfeed. Convergence: The International Journal of Research into New Media Technologies, 23(4), 425-438.
Mitchell, Amy; Kiley, Jocelyn; Gottfreid, Jeffrey & Guskin, Emily (2013). The role of news on Facebook. Common yet incidental. Pew Research Center, https://www.journalism.org/2013/10/24/the-role-of-news-on-facebook/ [Accessed: February 26, 2020].
Möller, Judith; van de Velde, Robert; Merten, Lisa & Puschmann, Cornelius (2019). Explaining online news engagement based on browsing behavior: Creatures of habit?. Social Science Computer Review, Online first, https://doi.org/10.1177/0894439319828012 [Accessed: February 26, 2020].
Moreno, Jacob (1978 [1934]. Who shall survive? Foundations of sociometry, group psychotherapy and sociodrama. New York, NY: Beacon House.
Newman, Nic; Fletcher, Richard; Levy, David & Nielsen, Rasmus Kleis (2016). Reuters Institute Digital News Report 2016. Reuters Institute for the Study of Journalism, https://reutersinstitute.politics.ox.ac.uk/sites/default/files/research/files/Digital%2520News%2520Report%25202016.pdf [Accessed: February 26, 2020].
Newman, Nic; Fletcher, Richard; Kalogeropoulos, Antonis; Levy, David A.L. & Nielsen, Rasmus Kleis (2017). Reuters Institute Digital News Report 2017. Reuters Institute for the Study of Journalism, https://reutersinstitute.politics.ox.ac.uk/sites/default/files/Digital%20News%20Report%202017%20web_0.pdf [Accessed: February 26, 2020].
Pariser, Eli (2011). The filter bubble: What the Internet is hiding from you. New York, NY: Penguin Press.
Quandt, Thorsten (2005). Journalisten im Netz: Eine Untersuchung journalistischen Handelns in Online-Redaktionen. Wiesbaden: VS Verlag für Sozialwissenschaften.
Rogers, Everett (2003). Diffusion of innovations (5th ed.). New York, NY: Free Press.
Schaap, Gabi (2001). Using protocol analysis in television news research: proposal and first tests. Communications, 26(4), 443-464.
Schenk, Michael (2010). Anwendungsfelder der Netzwerkforschung: Medienforschung. In Christian Stegbauer & Roger Häußling (Eds.), Handbuch Netzwerkforschung (pp.773-784). Wiesbaden: VS Verlag für Sozialwissenschaften.
Schmidt, Jan-Hinrik; Merten, Lisa; Hasebrink, Uwe; Petrich, Isabelle & Rolfs, Amelie (2017). Zur Relevanz von Online-Intermediären für die Meinungsbildung. Working Paper Series, Hans-Bredow-Institut, Hamburg, Germany, https://www.hans-bredow-institut.de/uploads/media/default/cms/media/67256764e92e34539343a8c77a0215bd96b35823.pdf [Accessed: April 26, 2020].
Schmidt, Jan-Hinrik; Merten, Lisa; Hasebrink, Uwe; Petrich, Isabelle & Rolfs, Amelie (2019). How do intermediaries shape news-related media repertoires and practices? Findings from a qualitative study. International Journal of Communication, 13, 853-873.
Schrøder, Kim (2011). Audiences are inherently cross-media: Audience studies and the cross-media challenge. Communication Management Quarterly, 18(6), 5-27.
Straus, Florian (2002). Netzwerkanalysen: Gemeindepsychologische Perspektiven für Forschung und Praxis. Wiesbaden: Deutscher Universitätsverlag.
Straus, Florian (2013). Das Unsichtbare sichtbar machen: 30 Jahre Erfahrungen mit qualitativen Netzwerkanalysen. In Michael Schönhuth, Markus Gamper, Michael Kronenwett & Martin Stark (Eds.), Visuelle Netzwerkforschung. Qualitative, Quantitative und Partizipative Zugänge (pp.33-58). Bielefeld: Transcript.
Sunstein, Cass (2017). #Republic: Divided democracy in the age of social media. Princeton, NJ: Princeton University Press.
Tewksbury, David; Weaver, Andrew & Maddex, Brett (2001). Accidentally informed: Incidental news exposure on the world wide web. Journalism & Mass Communication Quarterly, 78(3), 533-554.
Valeriani, Augusto & Vaccari, Cristian (2015). Accidental exposure to politics on social media as online participation equalizer in Germany, Italy, and the United Kingdom. New Media & Society, 18(9), 1857-1874.
Vraga, Emily K.; Bode, Leticia; Smithson, Anne-Bennett & Troller-Renfree, Sonya (2016). Blurred lines: Defining social, news, and political posts on Facebook. Journal of Information Technology & Politics, 13(3), 272-294.
Wall, Melissa (2018). How and why pop-up news ecologies come into being. In Scott A. Eldridge II & Bob Franklin (Eds.), The Routledge handbook of developments in digital journalism studies (pp.375-286). London: Routledge.
Wellman, Barry & Berkowitz, Stephen (Eds.) (1988). Social structures: A network approach (Structural analysis in the social sciences: Vol. 2). Cambridge: Cambridge University Press.
Wolf, Christof (2010). Egozentrierte Netzwerke: Datenerhebung und Datenanalyse. In Christian Stegbauer & Roger Häußling (Eds.), Handbuch Netzwerkforschung (pp.471-483). Wiesbaden: VS Verlag für Sozialwissenschaften.
Yuan, Elaine & Ksiazek, Thomas (2011). The duality of structure in China's national television market: A network analysis of audience behavior. Journal of Broadcasting & Electronic Media, 55(2), 180-197.
Zuiderveen Borgesius, Frederik; Trilling, Damian; Möller, Judith; Bodó, Balázs; de Vreese, Claes & Helberger, Natali (2016). Should we worry about filter bubbles?. Internet Policy Review, 5(1), https://doi.org/10.14763/2016.1.401 [Accessed: February 26, 2020].
Lisa MERTEN is a researcher and PhD student at the Leibniz Institute for Media Research | Hans-Bredow-Institut in Hamburg. She is interested in patterns of digital news consumption, customization practices in current digital environments and the developments of digital methods. In her dissertation project, she conducts research on practices of social media news use and how this affects other online and offline news consumption.
Contact:
Lisa Merten, MA
Leibniz Institute for Media Research | Hans-Bredow-Institut
Rothenbaumchausee 36
20148 Hamburg, Germany
E-mail: l.merten@leibniz-hbi.de
Merten, Lisa (2020). Contextualized Repertoire Maps: Exploring the Role of Social Media in News-Related Media Repertoires [61 paragraphs]. Forum Qualitative Sozialforschung / Forum: Qualitative Social Research, 21(2), Art. 12, http://dx.doi.org/10.17169/fqs-21.2.3235.

Creative Commons Attribution 4.0 International License