Volume 21, No. 2, Art. 22 – May 2020
What is the REFI-QDA Standard: Experimenting With the Transfer of Analyzed Research Projects Between QDA Software
Jeanine Evers, Mauro Ugo Caprioli, Stefan Nöst & Gregor Wiedemann
Abstract: The open REFI-QDA standard allows for the exchange of entire projects from one QDA software to another, on condition that software vendors have built the standard into their software. To reveal the new opportunities emerging from overcoming QDA software lock-in, we describe an experiment with the standard in four separate research projects done by several researchers during a week at the Lorentz Centre (The Netherlands) in August 2019. Each researcher exchanged some processed research data between two qualitative data analysis software (QDAS) packages. We start by envisaging the development of the REFI-QDA standard, followed by the context of each research project, the type(s) of data in it, the reasons for wanting to do the transfer to another program and the lessons learnt in doing so. We conclude with the benefits of the REFI-QDA standard and the issues to be taken into account when considering a transfer between QDAS.
Key words: qualitative data analysis; QDAS; CAQDAS; ATLAS.ti; iLCM; NVivo; Transana; Quirkos; REFI-QDA project; REFI-QDA standard; REFI-QDA codebook; interoperability; use cases REFI-QDA
Table of Contents
1. Introduction
2. QDAS: Past and Future
2.1 The role and acceptance of QDAS
2.2 Origin and function of the REFI-QDA standard
3. Introduction to the Cases and Terminology of REFI and QDAS
4. ATLAS.ti to Transana: Revolt in Curaçao
4.1 Project context and goals
4.2 Data formats and preparation
4.3 Analysis and tools used in QDAS
4.4 Conclusion: lessons learnt and benefits of transfer
5. ATLAS.ti to NVivo: European Citizens Talking About Politics
5.1 Project context and goals
5.2 Data formats and preparation
5.3 Analysis and tools used in QDAS
5.4 Conclusion: Benefits from transfer
6. Quirkos to ATLAS.ti: The MONITORaccess Project
6.1 The MONITORaccess project: Context and goals
6.2 Data formats and preparation
6.3 Analysis and tools used in QDAS
6.4 Conclusion: Lessons learnt and benefits of transfer
7. iLCM to NVivo: Hate Speech in Facebook Comments
7.1 Project context and goals
7.2 Data format and preparation
7.3 Analysis and tools used in QDAS
7.4 Conclusion: Lessons learnt and benefits of transfer
8. Conclusive Remarks on the Use of the REFI-QDA Project
8.1 Planning the transfer
8.2 Teamwork
8.3 Transparency and secondary analysis
8.4 Text-mining and QDAS
In August 2019 we, a group of researchers,1) met for a week at the Lorentz Centre2) (The Netherlands) to experiment with the REFI-QDA project. Each of us used the own research data to experiment with, which meant utilizing two different packages of qualitative data analysis software (QDAS) in one project. All of us exported the processed data from the QDAS we originally had been working in and imported it into a second software package for further processing. The goal was to learn about user experience, obstacles and, most importantly, benefits from switching between different software packages. In the current article, we will describe four cases, one for each of us, in which we will provide some context of our projects, the reason(s) for transfer, data types and preparation, the analysis done and the process of transfer. The article will start, however, with a brief overview of the historical debates regarding QDAS, followed by a discussion on the need for such a standard and how it came into existence in Section 2. In Section 3, the cases and the language used in REFI as compared to QDAS packages involved in the experiment will be introduced. Case 1 using ATLAS.ti and Transana on the revolt in Curaçao will be handled in Section 4. Case 2 on European citizens' relation to politics with ATLAS.ti and NVivo is dealt with in Section 5. In Section 6, we describe the MONITORaccess project using Quirkos and ATLAS.ti, and in Section 7 on hate speech in Facebook we utilize iLCM and NVivo. [1]
2.1 The role and acceptance of QDAS
QDAS has been around since the 1980's (WOLSKI 2018). Although QDAS started with some researchers feeling the need to have tasks done by a computer and creating a software package for their own needs (mostly with very limited functionality), later on QDAS was created by professional programmers in a commercial setting. However, its advantage has been questioned ever since because of a perceived negative influence on the process of qualitative analysis. This is comprehensible for that era as computers were just beginning to become generally accepted and were mostly associated with quantification and positivistic research. While some of the critique on QDAS might even have been in place for several packages at that time, it surely does not any longer. [2]
However, the negative perception of QDAS is quite persistent (e.g., CABRERA, 2018; VAN MANEN, 2014), notwithstanding evidence to the contrary (BAZELEY & JACKSON, 2013; DI GREGORIO & DAVIDSON, 2008; EVERS, SILVER, MRUCK & PEETERS, 2011; KONOPÁSEK, 2008; SOHN 2017) and together with the growing use of QDAS for literature reviews as well (e.g., O'NEILL, BOOTH & LAMB, 2018). This persistent critique on QDAS even resulted in an attempt to finally put it to rest by JACKSON, PAULUS and WOOLF (2018, p.75) who distinguish four types of criticism3) that sometimes overlap and/or intertwine (see below). They illustrate quite interestingly the role of misrepresenting citations in keeping criticism alive, by tracing citations regarding the "separation/distancing critique" (p.76) back to their original source. They illustrate how arguments pro and contra—originally presented for the most part in a balanced manner—were attenuated over time. Based on our own experiences in using/teaching QDAS, we will build further on that analysis by briefly describing what we witnessed happening in this regard over the last 30 years and giving our thoughts on the issue4). Fundamental changes of the perception of QDAS relate to:
What is considered as a loss of direct contact with the data because the computer and its functionality prevent you from immersing into the data (separation/distancing criticism). This seems a somewhat outdated epistemological position, assuming that the truth/knowledge in the data can only be accessed by researchers "unmediated" by computers, which are seen as an unnecessary barrier, adding another layer of distortion. In this day and age of digitization this seems a weird/romantic position to take, as QDAS enables you to have more direct contact with your data in comparison to the paper era, as all your data types5) can be collected in one project file, thus enabling the use of multimodal data within one project (ANTONIADOU, 2017). Furthermore, a recording and the transcript of that recording can be synchronized via timestamps to compare, complement and analyze (e.g., EVERS, 2011; SOHN, 2017) whilst, depending on the QDAS used, you can create links between chunks of data, be it media files and/or textual files, allowing you to compare them immediately (e.g., SILVER & PATASHNICK, 2011). All of this was not possible in the paper era, where it was much more difficult to directly compare chunks of data. The cases described in this article will illustrate that as well (see Case 4, Section 7, hate speech in Facebook comments, as a particularly nice example in this article).
Coding as the only—and hence, forced—instrument of analysis in QDAS (partly homogenization/standardization criticism), which seems to indicate a lack of understanding of what codes really are in QDAS6). This includes also a lack of comprehension about annotation and other functionalities such as links, grouping of documents and/or codes, automated text searches etc. available in QDAS (e.g., DI GREGORIO & DAVIDSON, 2008; EVERS, 2011; SILVER & LEWINS, 2014). For an illustration of how different types of analysis presuppose different kinds of coding and QDAS functionality see Case 1, Section 4 (revolt in Curacao), Case 2, Section 5 (European citizens talking about politics) and Case 3, Section 6 (MONITORaccess project) in this article.
QDAS as a text mining and auto coding tool that replaces the researcher and the need for close reading of the data, which saves a huge amount of time (quantification/decontextualizing criticism). Automated tasks in software are mostly pre-programmed and sometimes considered more reliable than a human being doing that same task. However, computers are not meant to interpret meaning, but only to handle pre-programmed searching mechanisms on word patterns and automated coding based on available dictionaries or training data in (un)supervised machine learning (EVERS, 2018a). In that sense, automated tasks might be considered frozen in time as they depend on former programming or closed sets of dictionaries and training data, lacking the ability to take into consideration the linguistic and cultural contexts that humans have and are unable to reason abductively. This again seems to be a wrong perception of what QDAS is, as it is not intended to replace the researcher as an analyst and never was (e.g., BAZELEY, 2013; MUHLMEYER-MENTZEL, 2011; see Case 4, Section 7 in this article).
The use of QDAS as justification for research rigor (partly mechanization/dehumanizing criticism). If the justification argument is indeed used without further explanation/argumentation as to how the QDAS has helped in delivering research rigor, it rather seems to be an "abuse" of QDAS to veil a lack of methodological discipline and/or knowledge on the part of the researcher. Although QDAS makes some research and analytic processes more immediately visible because of functionality being available (annotations used by the researcher, automated logging of acts within the software), it cannot replace the qualitative measures taken by a researcher in all stages of the research. Those measures are a function of both their methodological discipline and the thinking process throughout the research project (EVERS, 2015). SOHN (2017) illustrates nicely how the mechanization/dehumanizing criticism was handled in a phenomenological research. As the cases described in this article focus on the description of using the REFI-QDA standard and not so much on the content of the research project at hand, this point is only dealt with superficially here. However, the REFI-QDA standard in itself can add to the transparency of qualitative research, as it enables users of different QDAS to review the analysis process of a colleague if confidentiality/consent issues permit it.
The concealed influence of the software on the analytic process, due to its architecture which forces the researcher into particular directions, for example quantification of results or certain ways of coding due to the architecture of the code as a functionality within QDAS. Of course, each software package is programmed by someone and as such will represent the ideas/creativity of its developer(s), which might to some extent "force" a certain way of handling upon its user. However, this 1. does not relieve a researcher from their obligation to have at least some understanding of what happens under the hood of the software package they use7), 2. handle that software reflectively and methodologically soundly and 3. it ignores the creativity of users to come up with work-arounds in their QDAS if they want to do something (in a different way); see Case 2, Section 5 (European citizens talking about politics) and Case 3, Section 6 (the MONITORaccess project) in this article as illustrations of researchers using software in their own way and Case 1, Section 4 (revolt in Curaçao) as an example of a work-around devised by the researcher.
The terminology used by marketing departments of QDAS differs slightly over time, moving along with trends in research methodology to promote their software. Although mostly used to illustrate that their software matches the current trend, it might account for some of the misconceptions about QDAS being suitable only for specific types of qualitative analysis, such as grounded theory or mixed methods research. Several authors, however, have already proven this conception to be false (PAULUS, LESTER & DEMPSTER, 2014; SILVER & LEWINS, 2014). [3]
While on first sight it seems that most QDAS have the same functionality on board, for example coding, memoing and creating segments of data, under the hood they differ in how they handle these functions and in which functions are available to the user. In 2019, the REFI-QDA standard has been published as an open file format, enabling researchers to switch between QDAS if they desire another functionality than that which their current package holds. Having said all this, we will now turn to the REFI-QDA standard and how it came into existence. [4]
2.2 Origin and function of the REFI-QDA standard
The REFI-QDA standard is an exchange standard meant to enable interoperability between QDAS programs. This means that via the standard, software packages have a "common language" that allows users to transfer their processed research data from one QDAS package to the other. Before, most QDAS only enabled users to import data from another package but prevented export, hence locking users into their software package. As licensing in the academic world is mostly an institutional affair and not an individual decision, this hindered researchers not only in collaborating with researchers from other institutions, but in choosing a QDAS most fit to their analytic needs or preferences as well. [5]
The idea for an interoperability standard is not new, it exists in several sectors (for example logistics, invoicing, temporary employment, international container transport8)) and is becoming more and more common in a digitized world as people nowadays expect their e-mails, videos and music to be readable in different software and on several devices. There have even been suggestions and endeavors to create a standard for QDAS and for archiving qualitative data (e.g., CORTI, 2008; CORTI & GREGORY, 2011; MUHR, 2000; RIZKALLAH, 2016). But never before were commercial QDAS developers themselves collectively involved in creating an exchange standard, which makes the creation of the REFI-QDA standard so unique (EVERS, 2018b). The REFI-QDA standard was created by the Rotterdam Exchange Format Initiative (REFI), a collaboration of different software developers facilitated by a coordination group of academic users/trainers in QDAS and a standardization expert. REFI originated in 2016 at Erasmus University (The Netherlands) during the KWALON Conference: Reflecting on the future of QDA software (PAULUS, EVERS & DE JONG, 2018). The group has been meeting online regularly and in person twice a year since September 2016, working together on the development and creation of the REFI-QDA standard. [6]
The goals the group wanted to achieve by creating the standard was to enable:
researchers to transfer their data to another program if they need analytic tools not provided by their current QDAS;
researchers to collaborate in teams using different QDAS;
researchers moving to a workplace with a license for a different QDAS to continue working on their data;
archives to archive entire projects and make them available for secondary analysis;
researchers to do secondary analysis on processed data from colleagues;
teachers of QDAS to illustrate the same project in different QDAS. [7]
Creating such a standard is quite complex, as QDAS is designed by different programmers using different computer languages and different data models to build their software package. A standard therefore needs to overcome those differences as much as possible and translate them into a universal language, in this case XML, to enable packages to communicate with one another. In the REFI group, those differences between QDAS were handled by negotiation: during the live meetings of the group each party had to seek compromise in order to achieve the standard. Due to the different data models underlying QDAS, a standard will always entail some loss of information. However, a compromise was reached, as the now available REFI-QDA standard shows. As all the major functionality of QDAS was incorporated in the data model created for the REFI-QDA standard9), this loss is quite minor compared to the enormous gain of enabling users to transfer their projects between packages. [8]
The REFI-QDA standard in effect consists of two different standards: the REFI-QDA project, handling the transfer of a whole set of processed data, codes and annotations (a project) from one software package to the other and the REFI-QDA codebook, handling the transfer of all the codes in a project and their annotations, mostly used to define them, from one software to the other. In effect, the REFI-QDA project incorporates the REFI-QDA codebook, but this (smaller) standard was created to enable researchers to exchange only their codebook between software packages if so desired. The REFI-QDA project will create a file with the extension QDPX upon export10), the REFI-QDA codebook will create a file with the extension QDC. [9]
The REFI-QDA standard as such is open, i.e., license-free and publicly documented such that any software manufacturer wanting to implement it, can do so which will make the standard more broadly implemented in future. Several data archives have declared the standard as their preferred archiving format as well11), and others are expected to follow in due course. [10]
3. Introduction to the Cases and Terminology of REFI and QDAS
In four use cases below, we will describe why and how we exchanged our projects between two different QDAS packages using the REFI-QDA project. Each case starts with a short description of the project involved, our reasons(s) for wanting to exchange between software packages, the process of transfer and lessons learnt in doing so. We conclude with the benefits experienced in using the standard. [11]
Before turning to the case descriptions however, the table below provides an overview of the terminology12) used in the packages described in this article. In the case descriptions, terminology of the QDAS used is italicized.
|
REFI |
|||||
|
Case |
Document group, code group |
Corpus |
Case |
Source variable |
Transcript, document |
|
Code |
Code |
Code |
Node |
Quirk |
Keyword |
|
Codebook |
Codebook |
Codebook |
Codebook |
Codebook |
Codebook |
|
Coding |
Coding |
Coding |
Coding |
Highlights |
Coding |
|
Description |
Comment |
Description |
Description |
Description |
Description |
|
Graph |
Network |
n/a |
Map |
n/a |
n/a |
|
Link |
Link, relation |
n/a |
Link, connector |
n/a |
n/a |
|
Note |
Comment, memo |
n/a |
Annotation, memo |
Memo |
Journal, note |
|
Project |
Project |
Project |
Project |
Project |
Database |
|
Selection |
Quotation |
Selection |
Reference |
Quote, highlight |
Quote, clip |
|
Set |
Group |
Collection |
Set |
n/a |
Collection |
|
Source |
Document |
Document |
File |
Source |
Transcript, document |
|
Transcript |
Transcript |
Document |
Transcript |
Source |
Transcript |
|
User |
User |
User |
User |
Author |
User |
|
Variable |
Document group, code group |
Variable |
Attribute |
Source property |
Keyword |
Table 1: Overview of terminology used in QDAS used for the cases in this article [12]
4. ATLAS.ti to Transana: Revolt in Curaçao
This case deals with a small subset of data from a larger project about the revolt in Curaçao on May 30, 1969. Personal interest was the main reason for choosing this topic, as we lived in Curaçao at the time and had to flee from our primary school when the uprising reached town. The data used in the experimental project was taken from the Internet13), an easy way to collect data. However, if one would want to archive these data in a research data repository, for which the REFI-QDA project would be very well suited, the "ownership" of the data becomes important (VAN HORIK, 2015). Data taken from the Internet, from a library or from another archive, are not owned by the researcher, but by their primary source and hence they need to agree with depositing such data in a research repository14). [13]
We planned to transfer several data types from ATLAS.ti to Transana15) on the revolt in Curaçao. The primary goal for choosing a transfer from ATLAS.ti to Transana was the possibility to have multiple transcripts for one data file in Transana. For video files specifically, this feature can be quite interesting. Analyzing possible different layers in a single video as for example 1. speech, 2. surroundings, 3. movements and 4. camera position, both separately and combined could certainly add to the understanding of some qualitative video data (BOHNSACK, 2009; WOODS & DEMPSTER, 2011). Different formats of data files were deliberately included to create a stress test for the REFI-QDA project for this small experiment. Furthermore, the data will be handled in ATLAS.ti in diverse ways in order to further pressure the REFI-QDA project. [14]
4.2 Data formats and preparation
As we wanted the dataset to be quite diverse in formats, we collected different video files in MP4 from the internet (made by eyewitnesses), some old newspapers in PDF, an e-mail about the revolt as RTF and a screenshot in PNG from a page about the revolt from the National Archive of Curaçao. The Curaçao newspapers of that time were collected from the Royal Library using Delpher. As the PDF format of these (old) papers later caused some problems in the QDAS environment, we additionally collected some pages in TXT format. Furthermore, one of the PDF files collected was passed through FineReader16) to see if this would enhance readability and saved again in PDF format. Besides, transcription software f5transkript was used to create a pragmatic visual transcript (DEMPSTER & WOODS, 2011; EVERS, 2011) of a film made by CREUTZBERG (1969) about the burning city of Willemstad and the rubbish and ruins left afterwards. This resulted in a so-called "linked" transcript, consisting of a MP4 file and an RTF file. The total amount of files in our experimental project is twelve. [15]
4.3 Analysis and tools used in QDAS
The different data files were loaded into ATLAS.ti 8, and we deliberately used several tools in ATLAS.ti for different analytic purposes to further challenge the REFI-QDA project. The analysis began explorative, but along the way we decided to aim for a rudimentary "thick analysis" (EVERS, 2016), as we began to distinguish the different layers in the data worth investigating. [16]
4.3.1 Handling of the video and audio data
The first video file, consisting of a photocollage with a voice over, was transcribed by creating a quotation for each photo and using the comment box to enter the remarks on that photo made by the voice over. Furthermore, these quotations were coded with attribute codes (SALDAÑA, 2013) and in vivo codes (BAZELEY & JACKSON, 2013), either naming the location or describing—according to the voice over—who was there, what happened and/or what object was involved in the action. Both code types were given prefixes ("At" or "Iv") to indicate the analytic technique they belong to17) and organized into code groups. One code group was created for actors somehow involved in the action, be it as instigator, perpetrator, victim or (authority) person trying to control the situation. Another code group was created for locations mentioned or observed in the data. [17]
At first, we merely wanted to get an overview of places where it all happened. Later on, we strived to reconstruct the route taken by the persons on strike and the events that happened along the way, by deliberately and systematically coding places and actors involved. In a second stage of analysis, we further refined the prefix: "At" in the codename to indicate whether this was an instigator, perpetrator, victim or (authority) person trying to control the situation. Furthermore, we added pragmatic open codes (EVERS, 2015) and annotations in the comment box, alongside the transcript of the voice over, to distinguish between our own observations and the items/places mentioned by the voice over. In cases of uncertain, precise location we started to check locations via Google maps/images and coded for the "new" location, describing our actions in the comment box of the quotation in brackets, to distinguish it from the transcription of the voice over, which can be found here as well. In addition, we decided to code both the date when something happened, and whether a place should be marked on the map we wanted to create of the route. This would enable us to reconstruct events on location along the route per date. [18]
As the "linked" multimedia transcript had no audio on the video, the transcript was used to describe what happened in the different scenes in the video, their location and the type of persons visible. It was divided in quotations according to the scenes distinguished by camera position (HEATH, HINDMARSH & LUFF, 2010) and coded similarly to the former video by re-use/creation of attribute codes and pragmatic open codes with locations, persons and/or situations visible, as well as a new code type: the camera location18). [19]
The third video file contained subtitles but no audio. It was "transcribed" by creating quotations of each scene, based on the subtitles and adding the subtitles verbatim in a comment for that quotation. It was coded similarly as the former ones with attribute, in vivo and pragmatic open codes on location, objects, actions and/or persons visible, either based on subtitles or own observation. [20]
The fourth video consisted of different interviews and was coded without transcribing it by using in vivo codes as summaries for what was said. In addition to this video, we downloaded another page of the National Archive about May 30, 1969 and made a screenshot of a report, visible in the video, which was later discovered to be physically available in the Royal Library of The Netherlands. [21]
4.3.2 Handling of the textual data
While trying to segment and code one of the old newspapers in PDF format, we discovered the PDF format could only be segmented into correct segments on some places on the page. This apparently was caused by the characteristic that an old newspaper has different blocks of text in different sizes on a page19). In selecting text chunks to code, the boundaries of a text block sometimes were surpassed and in such cases the selection made no sense20). We solved this textual data issue by downloading the TXT version of that same newspaper21) from Delpher and decided to have both the PDF and the TXT version of the newspaper in our project. The PDF will enable us 1. to see the original layout, which has meaning in its own right, and 2. to have the photographs in the paper available. The TXT will allow us to segment and code, either line-by-line or by text block, correctly on a page. We opened the two versions of the same newspaper alongside one another, created a quotation and coded it on the front page of the newspaper in TXT and hyperlinked that quotation to the spot in the PDF where it originates from to enable easy visual inspection of how things looked in 1969. As the photographs were codable as separate quotations in the PDF file, we coded those in the PDF (see Figure 1 below). This strategy enabled us to keep the integrity of the newspaper data intact.
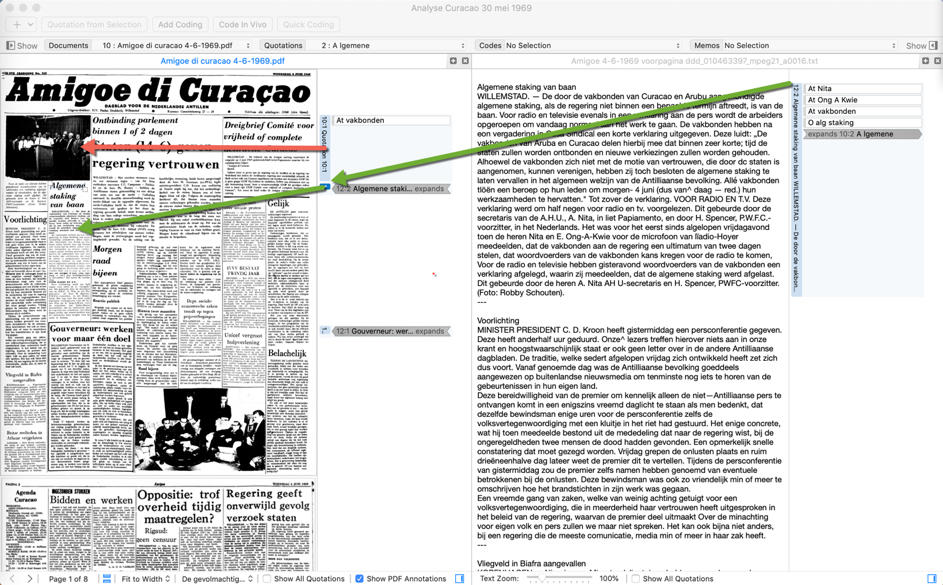
Figure 1: Coding photos in complex PDF files (orange) and hyperlinking coded text in TXT files to accompanying PDF file (green).
Please click here for an enlarged version of Figure 1. [22]
The code system developed in coding the video files, was used for coding the remaining textual data. Some data files were grouped together in document groups to keep files that belonged together organized, like for instance the TXT and PDF versions of the same newspaper. Along the way, some memos were written about different topics: this experimental project, the analytic process, questions we had about observations in the data, rules on archiving, and so on. This preliminary analysis resulted in a total of fourteen documents, three document groups, one hundred and seventy-seven codes, two code groups, five memos, and eight hyperlinks. An overview can be seen below.
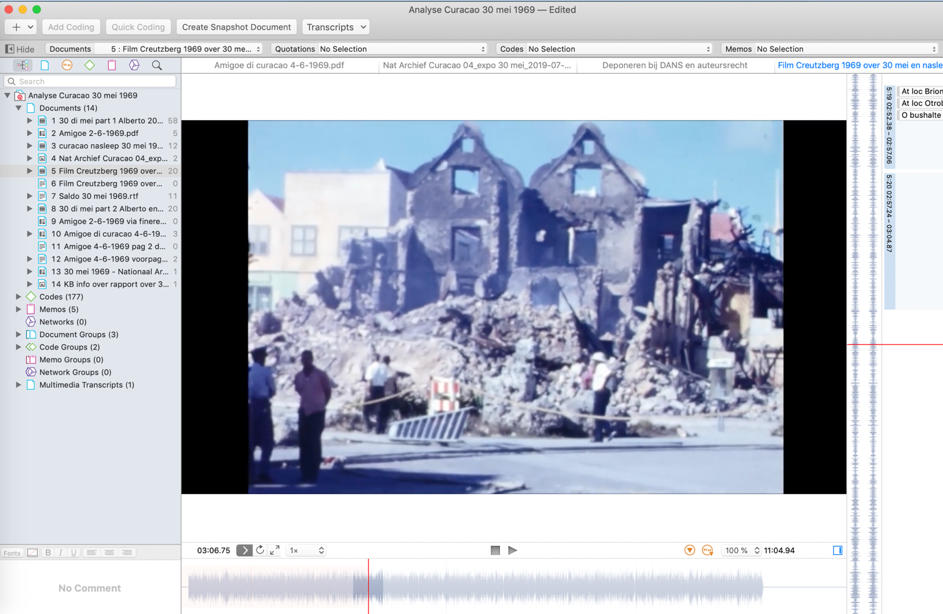
Figure 2: Overview of experimental project in ATLAS.ti for MAC. Please click here for an enlarged version of Figure 2. [23]
Although this was just the explorative phase of our analysis, due to time constraints we had to transfer the project to Transana in order to proceed. A full-blown analysis of this dataset would take far more time than was available for this experiment with the REFI-QDA project. For the transfer to Transana, we need the export function in ATLAS.ti and the import function in Transana. As mentioned earlier, the export with the REFI-QDA project will result in a so-called QDPX file, which can only be read by QDAS packages that have implemented the standard22). [24]
Once we got the data into Transana, we could start with the additional transcript we were aiming for. In creating two transcripts on a single video, we could separate the verbatim speech from what was done in order to analyze both of them in tandem and separately. After making the second transcript for a while, we decided to add a third transcript specifically for camera movements, to see what it could tell us about the data.

Figure 3: View of triple transcript in Transana. Please click here for an enlarged version of Figure 3. [25]
Even though there was no time to fully transcribe the video for this small experiment, creating the third transcript on camera movements already showed us that the video was edited according to how the interviewee was represented. Different positions of the interviewee in the surroundings were alternated by cutting and pasting video parts, possibly to enhance the liveliness of the video. We could only have discovered this by having focused our attention exclusively on camera movements. The handling of the video in milliseconds to find the right spot for the timestamp was additional to this discovery, as it made the editing of the video quite visible. The transfer to Transana already proved to be quite useful. [26]
4.4 Conclusion: lessons learnt and benefits of transfer
Looking back, the process of using the REFI-QDA project taught us several things. First and foremost, it brought us an additional layer of analysis for our data that would not have been available if we would have stayed within one QDAS. Second, we transferred the project to Transana after having done quite some work in ATLAS.ti. We could have approached this differently, by starting in Transana first in order to create the multiple transcripts and do some coding on the video data, and then moving to ATLAS.ti for further work. Furthermore, we could have moved to Transana earlier in the analytic process and then move back to ATLAS.ti. This so-called "roundtripping" in developers' terminology is currently not yet implemented, but will be so in the near future, enabling you to do something in Software 1, then move to Software 2 for some additional work on your data, and move back to Software 1 to finish up. [27]
5. ATLAS.ti to NVivo: European Citizens Talking About Politics
The following case study is based on personal experiences of teamwork and QDAS-usage. It builds on ongoing doctoral research that takes place within a larger project named Qualidem.23) In general terms, Qualidem aims to uncover the possible influence—by way of policy feedback effects as are elaborately discussed in CAMPBELL (2011) and PIERSON (1993)—that globalization, supra-nationalization processes (of which we consider European integration to be a special case, see DUPUY & VAN INGELGOM, 2015), or the "neoliberal turn" (HARVEY, 2005, p.2) could have had on the linkage mechanisms between citizens and the political system in a democracy. Our study focuses on "democratic linkage," a concept that refers to any attitudinal or behavioral evaluative orientation of citizens towards (parts of) their political system. By performing a qualitative analysis of how citizens themselves discuss their perceptions and experiences with politics, we address a lack of qualitative research in a predominantly quantitative literature (e.g., HAY, 2007; NORRIS, 2011). To allow cross-national and diachronic comparison we study three national cases (Belgium, France, UK) over a longer timespan (1995-2019). Methodologically, our study consists of a secondary analysis of qualitative data (HEATON, 2008). [28]
In order to enable the team of researchers to code collectively and share their coded data, the whole team has worked on the same ATLAS.ti master-project and used a collectively created deductive codebook. In this case, a mismatch between individual researchers' QDAS experience and preferences and those of their work environment will be explored. During the team coding process, we found that our ideas regarding qualitative research were the product of habits and subjective preferences formed during previous experiences in using another QDAS, NVivo. We hoped that using the REFI-QDA project would help us to overcome some issues encountered, as it facilitates the transfer of coded data from our team's ATLAS.ti file to NVivo. [29]
5.2 Data formats and preparation
The selection of qualitative data containing relevant information is key to determine the feasibility of secondary analyses (HEATON, 1998, 2008). This was ensured by selecting datasets from primary studies on similar relevant topics that contained sufficient information relevant to our questions. In our case, we selected qualitative data from studies looking at citizens' discourse on politics and Europe. Primary researchers' account on the richness of their data as well as our first results confirm its suitability for re-analysis (DUCHESNE, FRAZER, HAEGEL, & VAN INGELGOM, 2013; DUPUY & VAN INGELGOM, 2016). As such, we created an ATLAS.ti project with 72 textual documents: imported individual interview or focus group transcripts coming from three different primary studies (BELOT, 2000; DUCHESNE et al., 2013; MERCENIER, 2019).24) [30]
5.3 Analysis and tools used in QDAS
5.3.1 Initial work in ATLAS.ti
The ATLAS.ti project also included a shared deductive codebook, which contains 70 codes, each having a detailed code comment with for example information on: in-/exclusion criteria, examples, relevant literature, etc. The codebook contained two types of codes: broad thematic codes (SALDAÑA, 2015) that cover our project's different research interests25), and so-called "transversal" codes that further specify the thematic codes, e.g., if something refers to the European or national level. [31]
The task of applying the codebook to our data in this first round of coding was shared across our team. Therefore, we created a master-project, distributed it as a so-called project bundle to each team member, and after completing the assigned coding merged it into a new master-project. This new master project contained a considerable amount (n=11203) of coded quotations (text segments), resulting from six different team members coding their assigned selection from a total of 62 documents26). We regularly held meetings to discuss the team coding results and when necessary, the codebook was adapted. This led to an increasing convergence in how our team understood and used the codebook. The result of this first round of thematic coding will be used in the experiment with the REFI-project. [32]
Coding however, proved to be as much a subjective art as it is a craft (SALDAÑA, 2015, pp.41-42). In our team, for instance, we found that agreement on whether a code is present in citizen discourse, did not necessarily coincide with agreement on how much of the discourse should be coded to that code, as can be seen in Figure 4 below.

Figure 4: Coded text in ATLAS.ti illustrating different coding approaches of two coders. Please click here for an enlarged version of Figure 4. [33]
Figure 4 shows how two coders (red and brown) coded the discussion with the same codes but applied them to quotations (segments) of different length. The red coder applied the codes broadly by including more context, while the brown coder chose a more precise application by only coding the exact sentence(s) where a code occurs. This indicates the two coders had different views on what constituted the codes' "unit of meaning" (BAZELEY, 2013, p.144). In our study, the results of our first round of team coding will serve as the basis for further individual analyses. In the next phase the initial categories of the deductive codebook will be refined with inductive codes in a second round of recoding. For this purpose—ideally—we would like our previous stages' coding to be broad so the coded content can be understood in its discursive context. On the other hand, our final goal is to arrive at a systematic longitudinal cross-national and diachronic comparative analysis of how citizens with different sociological attributes discuss their relation to the political. Here, in contrast, the ideal would be very precise or detailed coding in order to compare code (co-)occurrences across participants. Moreover, this step requires the use of queries that rely on Boolean operators to relate the—reviewed and recoded—data to participants' attributes. However, after the first round of team coding in ATLAS.ti, it became clear that the way we theorized both the second (re-)coding round and the use of Boolean operators in queries were biased by previous experiences in qualitative analysis using NVivo. More precisely, on the incorrect assumption that ATLAS.ti and NVivo have exactly the same functionality in displaying and recoding coded data, as well as using the "and" operator to retrieve coding. The next paragraph will elaborate on these differences. [34]
5.3.2 Using NVivo to review team coded data in ATLAS.ti
Both NVivo and ATLAS.ti have the option to work on the coded transcripts directly. However, as we are working with broad deductive codes, we would like to display the full content of coded segments per code together as codable text. By displaying all this content per code, to us, patterns within the code are better discernible. This is a basic function in NVivo we are familiar with: by clicking on a node, NVivo opens the reference view which displays all of its content together on a new window as codable text. In ATLAS.ti, double clicking a code will also display all of its content, but very differently. Instead of the full textual content of a code, ATLAS.ti displays the list of quotations linked to the code. This list only displays the first 70 characters instead of the full content for each quotation. Moreover, the length of a quotation can only be changed by displaying it in its source document. As the codes we want to review have many quotations linked to them (see Figure 5 below), changing the length of the quotation while reviewing and recoding these in ATLAS.ti would quickly become cumbersome as it requires frequent "jumps" from one document to another.
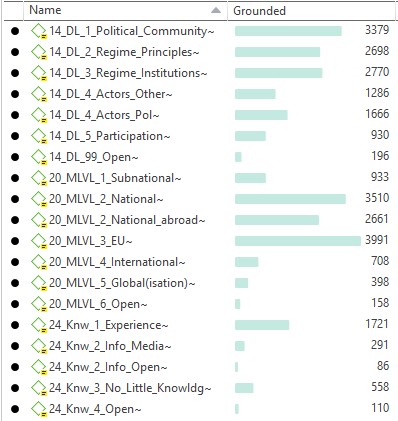
Figure 5: Screenshot from ATLAS.ti illustrating the results of the first round of team coding [35]
Alternatively, ATLAS.ti's split code tool (Figure 627)) allows you to recode quotations from a given code with other codes. However, as explained above, besides recoding we would also need to be able to change the length of quotations given the inconsistencies found in our team coding.
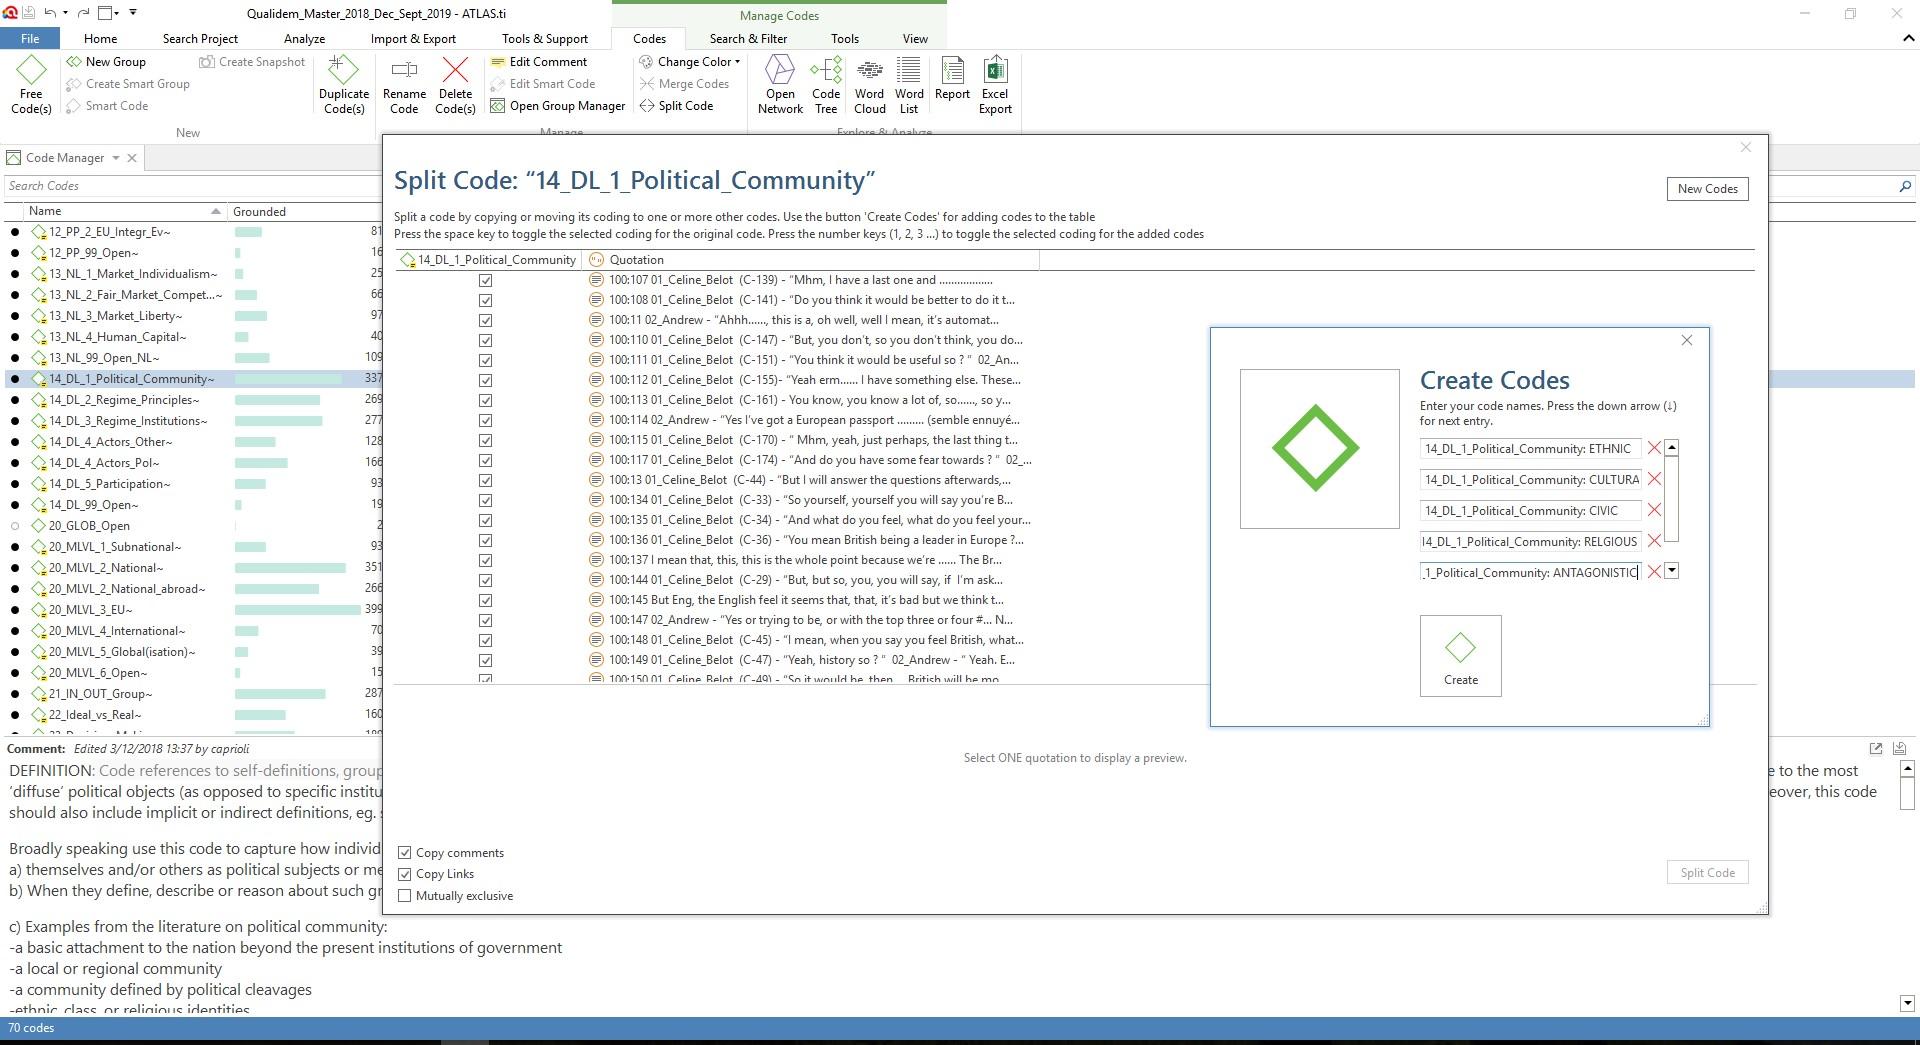
Figure 6: The "split code" function in ATLAS.ti. Please click here for an enlarged version of Figure 6. [36]
The issue was solved thanks to the REFI-QDA project, which enabled us to export our coded data from ATLAS.ti into a QDPX file which we successfully imported in NVivo. Figure 7 below illustrates the successful migration.

Figure 7: Successful migration of coded text; left: codebook with frequencies in ATLAS.ti, right: the same for Nvivo. Please click here for an enlarged version of Figure 7. [37]
To the left in ATLAS.ti the selected (in blue) code "political community," and on the right the same node in NVivo. As indicated by the high number of code references for "the political community" code, it will definitely need revision and be further developed in more detailed (sub)codes. As its definition was broad, this was expected. The primary goal for the shared coding was to highlight as much as possible relevant material for further analysis.28) [38]
Note the decrease (3379 vs. 3195) in the frequency of the political community node after migrating the project from ATLAS.ti to NVivo. This unexpected result can be understood by looking at the left side in figure 8. It shows how NVivo merged the smaller ATLAS.ti quotations from Figure 4 into the larger overlapping quotation coded with the same node. Apparently, the user logging in ATLAS.ti was not transferred to NVivo, making NVivo look at this node as being identical and, hence merging the former quotations into one reference. This means that when comparing coding done by different coders is the aim, this should be done before transferring the coded data. This is an important caveat for analyses where the number of code frequencies does matter, for instance for calculating intercoder reliability or for analyzing responses to open survey questions in large-n studies. [39]
After importing the data in NVivo, by double-clicking on the "political community" node the reference view is opened. The reference view shows all the references coded as "political community" together and also allows to code directly on the retrieved contents. On the right side of Figure 8, we can see the red quotation from Figure 4 which is now merged together with all the brown quotations earlier coded as "political community” into one reference. Seeing the full reference (and not just part of it) and being able to directly recode all content coded with a certain node, helps us to find patterns within the data assigned to nodes and signal false positives (cleaning up the coding). Reading through these references helps to determine what they have in common, how they differ and allows for the emergence of sub-dimensions.

Figure 8: Illustration of references in reference view on the right. Please click here for an enlarged version of Figure 8. [40]
5.3.3 Using the REFI-QDA project to mitigate different results of code retrieval queries
Another issue encountered, was the difference in query implementation between NVivo and ATLAS.ti. Both packages allow users to query their data using theoretical or Boolean operators but based on different assumptions. As we had a large amount of data, a lot of pre-designated codes and a big group of coders, querying coded data with Boolean operators was a necessity. However, in ATLAS.ti these operators work at the level of quotations, whereas in NVivo the operators work at the level of individual text characters. In effect, this means that ATLAS.ti will handle quotation size as a condition for retrieval, whilst NVivo handles textual boundaries (not necessarily coinciding with quotation size). The following example illustrates how this approach is quite different. It shows how different results are obtained on the same data when using the Boolean "and" operator in ATLAS.ti's query tool versus the same operator in NVivo's coding queries. As a test, we coded a piece of text in ATLAS.ti with two codes (A, B) in such a way that: 1. a first quotation was coded as both A and B, 2. a second quotation was coded as only A and it partially overlaps with 3. a third quotation coded as only B (see Figure 9 below).
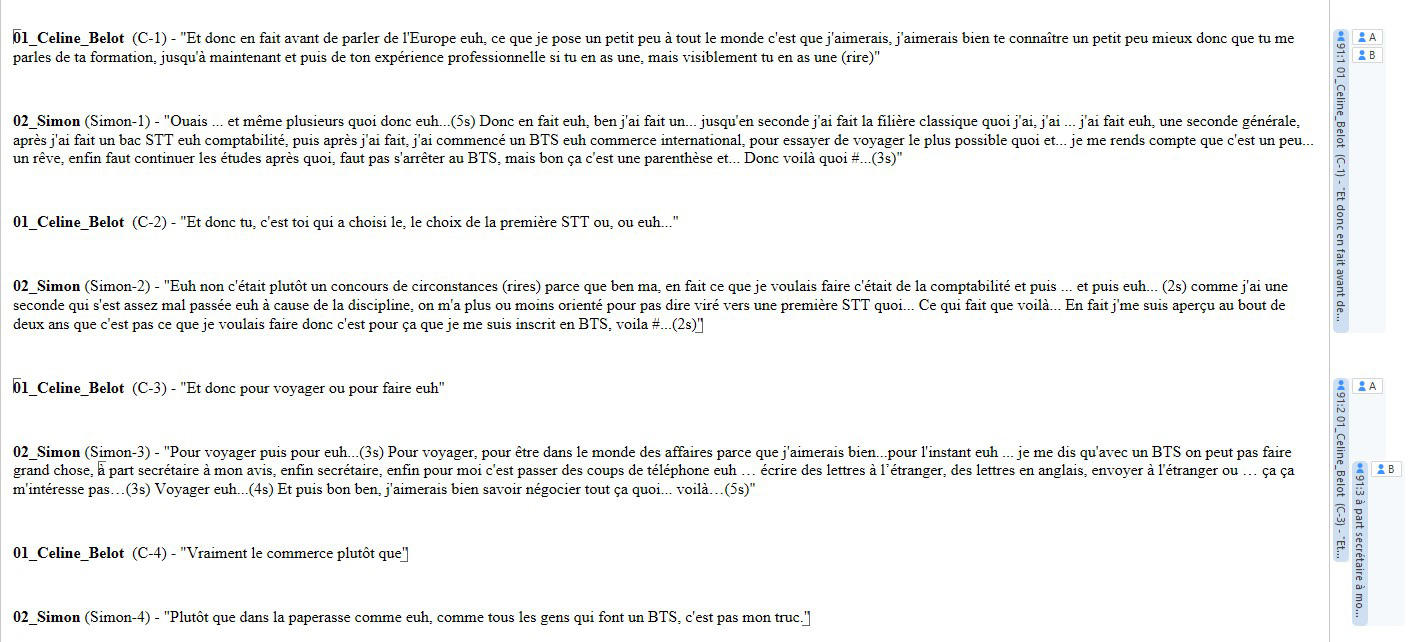
Figure 9: Screenshot showing the three different quotations coded with "A" and/or "B" in ATLAS.ti. Please click here for an enlarged version of Figure 9. [41]
We then used the query tool in ATLAS.ti to retrieve everything that matches the formula A "and" B. As the results in Figure 10 below show, only one quotation was retrieved (the first quotation in Figure 9) because ATLAS.ti looks for quotations coded as both "A" and "B."
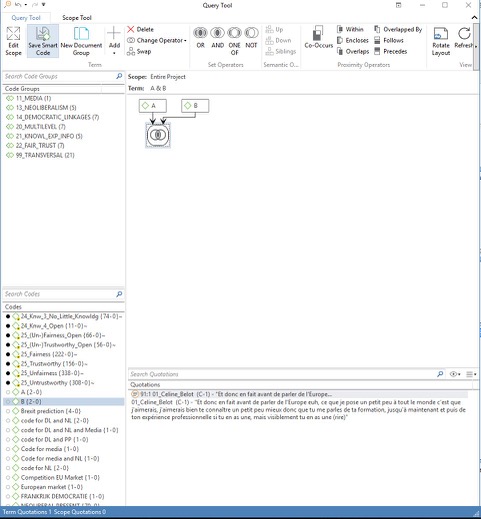
Figure 10: Screenshot of query results for A "and" B in ATLAS.ti [42]
However, given the variation in how different coders in our project determined quotation length, it might be interesting to ask which textual content, instead of which quotation, is coded as A "and" B. Therefore, we again exported a QDPX file from ATLAS.ti using the REFI-QDA project and imported it into NVivo. The coding query and results are shown below in Figure 11. It shows how the NVivo coding query looks for individual characters rather than quotations for which the Boolean formula "and" must be true. As a result, it retrieved both the quotation (coded with A "and" B in ATLAS.ti), and the part of text in which A and B overlap (which in ATLAS.ti was not a quotation, but the overlap between two separate quotations, one coded with A and the other coded with B). This means that query results will be different, as the ATLAS.ti "quotation level" gets lost in using the query option in NVivo. However, this does not mean that quotations created in ATLAS.ti get lost in NVivo, it merely indicates that the query functionality of both QDAS works differently.
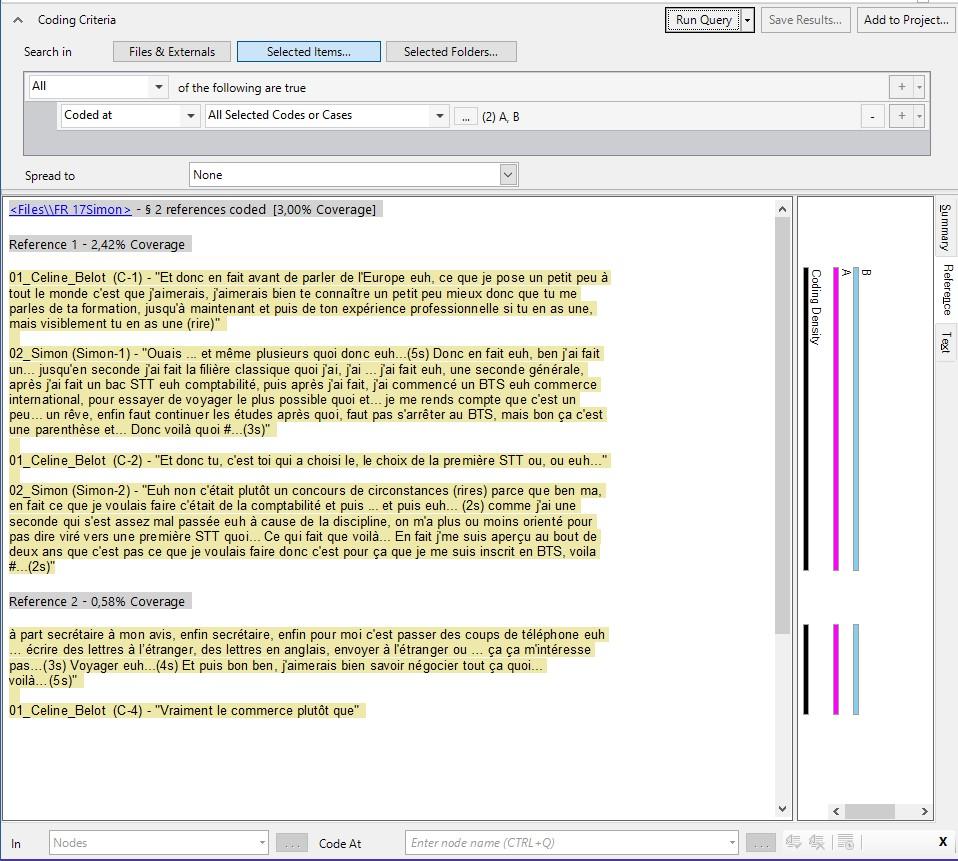
Figure 11: Screenshot illustrating 2 retrieved fragments using the "A" and "B" function in Nvivo. Please click here for an enlarged version of Figure 11. [43]
For researchers trained in ATLAS.ti, queries in NVivo using "and" retrieve more than expected; while for researchers trained in NVivo, queries in ATLAS.ti using "and" retrieve less than expected. Arguably, this is a case where unawareness or erroneous assumptions regarding specific QDAS functionalities could lead to biased or misinterpreted results. However, because of the REFI-QDA project, qualitative researchers can now make an informed decision regarding which tool or functionality of the different QDAS best fits their project's needs. [44]
5.4 Conclusion: Benefits from transfer
This case illustrates how researchers doing teamwork can use the REFI-QDA project to migrate their projects across QDAS. The issues we discussed are particularly relevant for larger projects involving multiple research questions requiring different methodological approaches. In our experiment, we found that the REFI-QDA standard could help researchers to address some of the issues that could arise in research groups due to different individual QDAS experiences, assumptions, and/or preferences. The results of our exploratory tests with the REFI-QDA project show how it succeeds at importing and exporting coded qualitative data from ATLAS.ti to NVivo. This was a benefit to our research group as it allows us to choose between different QDAS, based on our individual preferences regarding which QDAS best fits our analytical needs. [45]
6. Quirkos to ATLAS.ti: The MONITORaccess Project
6.1 The MONITORaccess project: Context and goals
In Germany, a large number of people have no health insurance and therefore are unable to access the formal health care sector. Migrants are particularly affected by this disparity in healthcare entitlement (SUESS, RUIZ PÉREZ, RUIZ AZAROLA, MARCH CERDÀ, 2014). Medical services for uninsured patients are instead provided within an informal system by non‐governmental organizations (NGOs) (CHAUVIN, SIMONNOT, VANBIERVLIET, VICART & VUILLERMOZ, 2015). Existing case studies, reports and literature reviews indicate that access and quality of health services is insufficient within this population (DE JONG, PAVLOVA, WINTERS & RECHEL, 2017; MÜLLERSCHÖN et al., 2019). Statistics covering all major NGOs offering services to uninsured patients are still lacking. The MONITORaccess project therefore aims to develop and pilot a monitoring tool of health and healthcare within the informal healthcare system. Monitoring in this project means to use a standardized measurement framework to evaluate health and health care outcomes within and across participating NGOs (the informal health care system). [46]
An exploratory sequential mixed‐methods research design was configured, including 1. a qualitative preliminary study and 2. a quantitative pilot study. Data were collected at four study sites across different regions, whilst three different NGOs were involved. The aim of the qualitative preliminary study was to develop a set of indicators to evaluate and monitor health and healthcare within the informal healthcare system. Expert interviews with healthcare coordinators and providers of care as well as participatory observation within the NGOs were conducted. The mainly desired outcomes of the monitoring tool were defined as 1. reasons for encounter and 2. access barriers to routine care. [47]
6.2 Data formats and preparation
As our data mainly consisted of interview transcripts, these were imported as DOCX files into Quirkos, which was used to analyze the interview transcripts first. The coded data were then transferred into ATLAS.ti. [48]
6.3 Analysis and tools used in QDAS
During the qualitative preliminary study (Step 1) the focus was on designing the measurement framework of the monitoring system. Based on a pragmatic content analysis approach (KUCKARTZ, 2018; VAISMORADI & SNELGROVE, 2019), relevant themes were identified out of the interview transcripts using Quirkos. [49]
Quirkos29) provides a set of basic functionalities to analyze qualitative data. Highlighting in Quirkos means coding and Quirks are the labels30) attached to chunks of text. To enable the coding process in Quirkos, a quirk has to be created first or be existent already. Next, a chunk of text can be selected from the text sources and dropped onto the desired quirk, which is then coded with that quirk. By coding the data in this way, themes were derived from the data by inductively and sometimes deductively grouping quirks together into themes. These groups of quirks or individual quirks were freely arranged within the canvas area to play around with the emerging themes (Figure 1231)). The coding process worked easily and intuitively with Quirkos.

Figure 12: Screenshot of Quirkos' home interface. Please click here for an enlarged version of Figure 12. [50]
Properties in Quirkos enable a standardized characterization of sources' metadata. Properties and their values (attributes, metadata) can be defined individually, either in numbers or text. We used properties to characterize the person and setting of each interview per source (document, case). We distinguished between male and female gender, different organizations by name, different positions of interviewees within their organization and different working conditions, i.e., volunteer or permanently employed persons. Based on the properties, we used the Query function for stratified analyses of the sources (interview transcripts). These themes consecutively were transformed into measurable indicators (e.g., reason for encounter, access barriers to routine care, housing situation, residence permit, nationality and health care coverage). Referring to these indicators, standardized evaluation instruments were developed in a participatory manner together with the coordinators from the NGOs by reflecting on and adapting the results of the analysis. [51]
While reflecting on the results and the initial research process together with the coordinators of the participating NGOs, different views about the scope and some barriers to the implementation of the monitoring tool occurred. Furthermore, different professional opinions existed on how to share and report conjointly collected data. Based on the preliminary study and experiences mentioned above and due to the heterogeneity of these organizations, more comprehensive and hermeneutical analysis (REICHERTZ, 2016) was needed. This analysis had to focus on how different organizations within this field handle conjoint measurement, collection and reporting of data, respecting both their heterogeneity and their organization-specific norms and values. We wanted to develop a hypothetical model to explain the heterogeneity of the NGOs emerging from the existing qualitative data. To transfer the project from Quirkos to ATLAS.ti the Quirkos project was exported into a QDPX-file, saved and imported into ATLAS.ti. [52]
6.3.2 Challenges: Characteristics of Quirkos data converted in ATLAS.ti
After transferring our coded data from Quirkos to ATLAS.ti, two challenges arose. First, the lack of one-to-one transformation of Quirkos' structure into the ATLAS.ti structure. The hierarchy of Quirkos coding could not be replicated in ATLAS.ti, but instead was reflected in new code names. Upon import, ATLAS.ti renamed the codes and applied the Quirkos hierarchy by using two colons within the new code name. Thus, ATLAS.ti reproduced the Quirkos hierarchy in a semantic way but did not include the different codes into the ATLAS.ti code tree. We then modified the code names and built code groups in ATLAS.ti to replace the former hierarchy. Secondly, the source properties defined in Quirkos were imported as document groups automatically in ATLAS.ti. [53]
In order to develop a hypothetical model, possible relations between the themes coded earlier and related phenomena on an organizational level were explored by using a network to visualize them. Relations and themes were compared per organization, using the underlying quotations (data segments) to ground them and document groups to group transcripts based on different attributes of the organizational context. We wanted to get a better understanding of which entities might be relevant to differences in organizational measurement, collection and reporting on healthcare data. In ATLAS.ti, two types of relations32) are available: 1. code-code relations and 2. quotation-quotation relations (hyperlinks). We used both hyperlinks and code-code relations to explore and compare differences between organizations, based on our data. By using the networks in ATLAS.ti, we discovered phenomena hidden in the textual data. We were able to construct and visualize new hypotheses of organizational relationships, helping us to explain differences across the organizations in dealing with data and monitoring within the informal health care system (see Figure 13 below). With regard to attributes and quotations, three groups of organizational subcultures were discovered using hermeneutical analysis (REICHERTZ, 2016). The association of these types of subcultures with varying organizational purposes and (formal and informal) organizational structures and processes were reflected by the data and formulated and visualized by code-code relations. Stepwise comparison of different subcultures and expected benefits of joint data monitoring led to causal hypotheses which were visualized in the network by using the "is cause of" code-code relation.
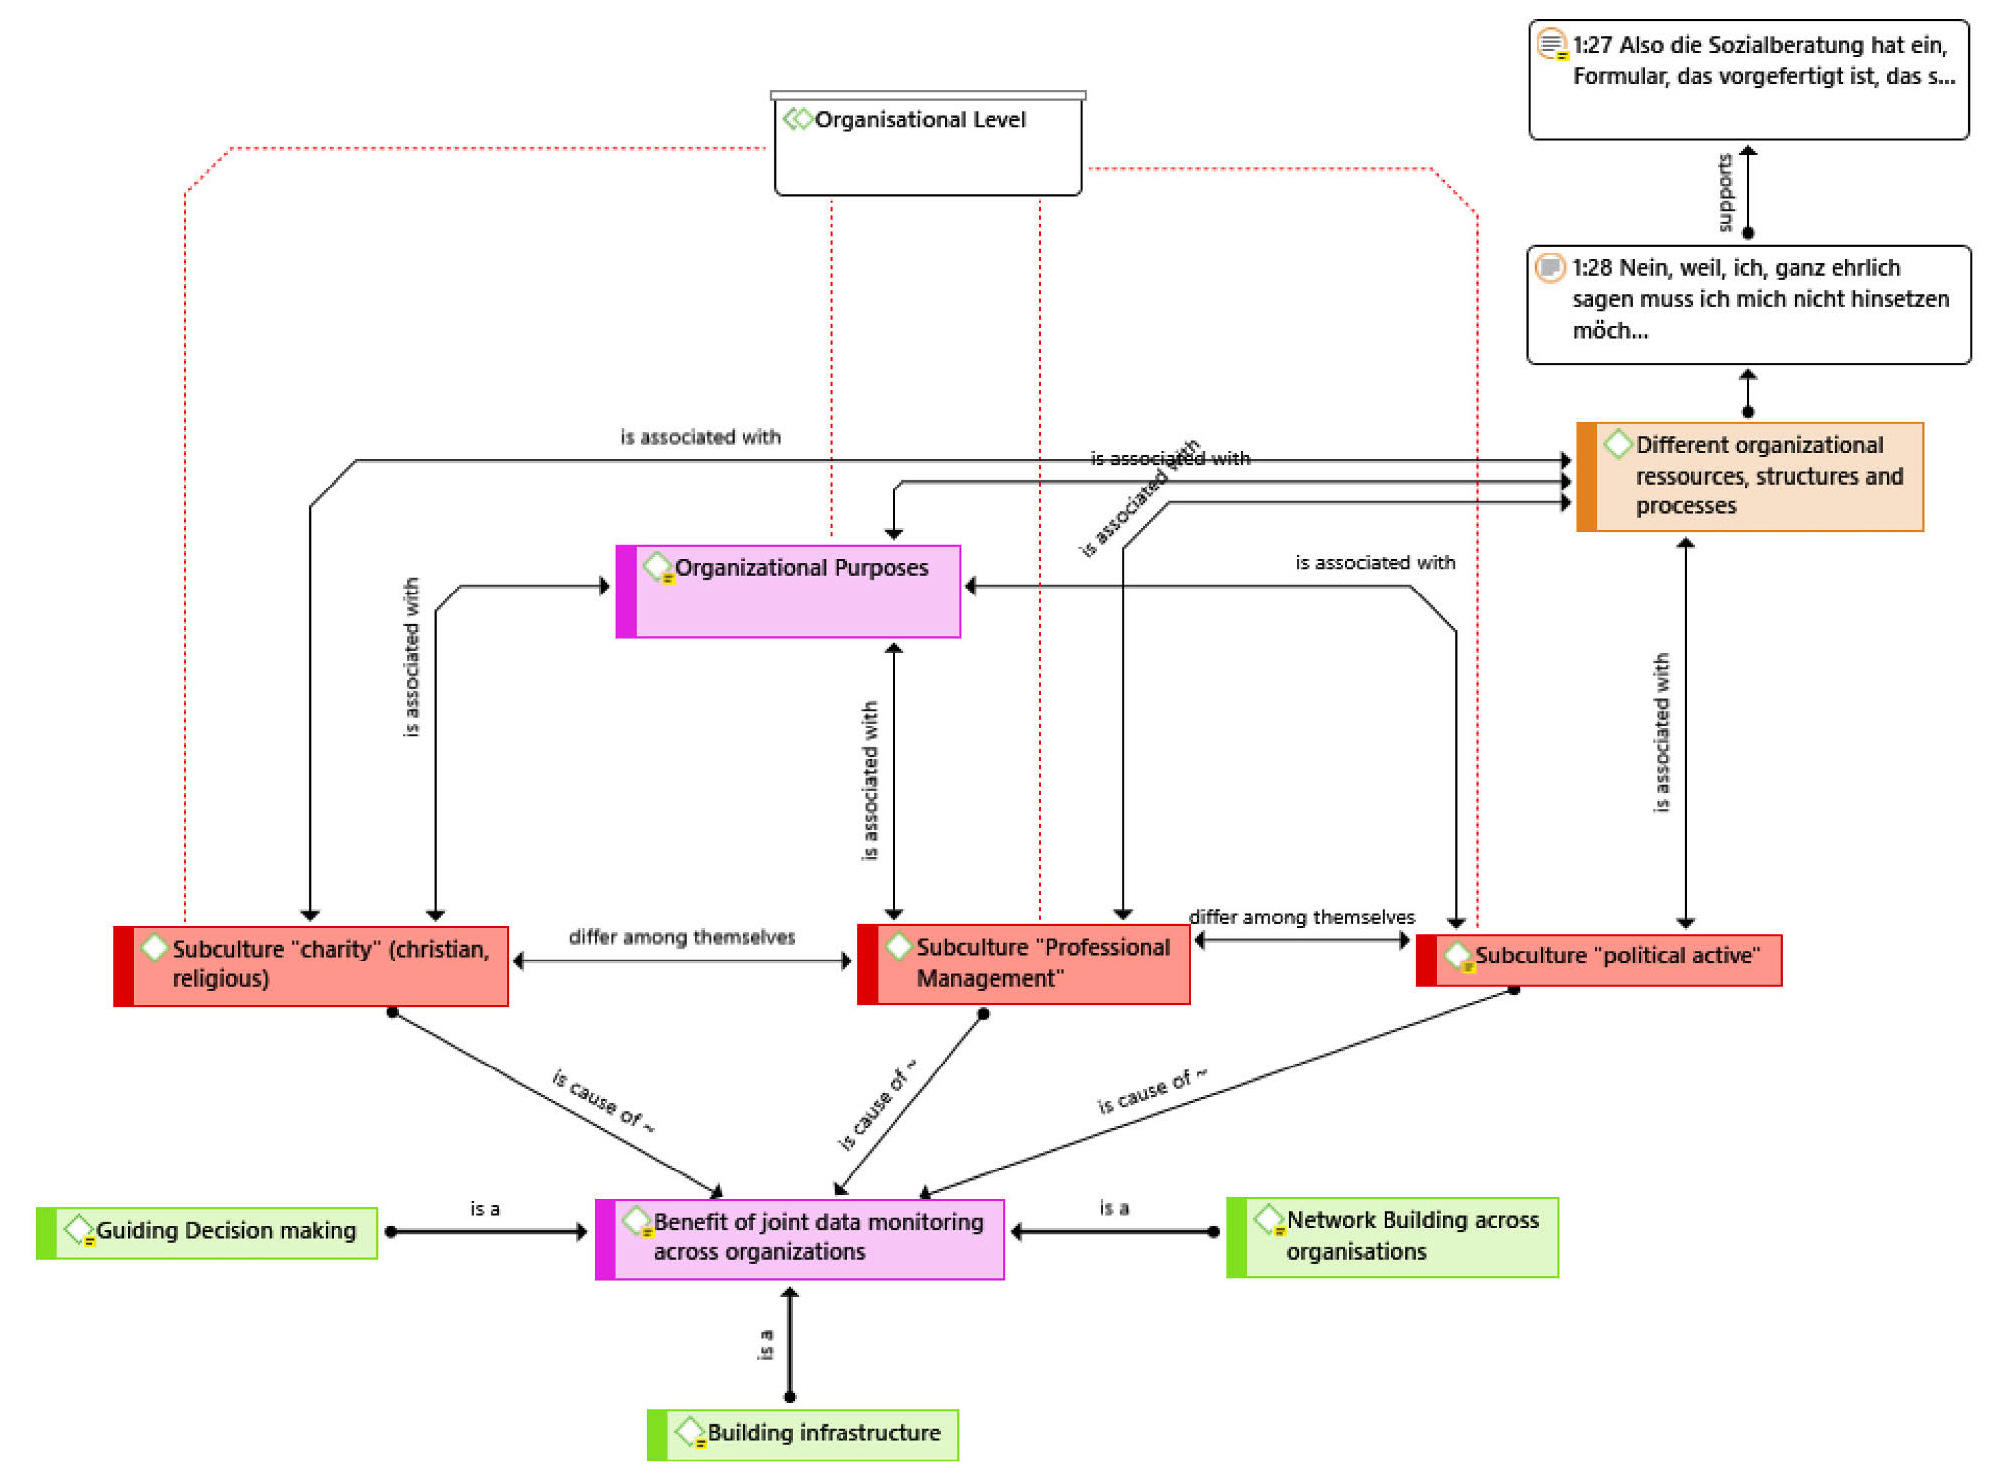
Figure 13: ATLAS.ti network of code-code relations and hyperlinks. Please click here for an enlarged version of Figure 13. [54]
6.4 Conclusion: Lessons learnt and benefits of transfer
While QUIRKOS worked well for finding and grouping different themes, the transfer to ATLAS.ti via the REFI-QDA project enabled us to develop hypotheses about relations regarding formal and informal organization, which could explain different practices in dealing with data, monitoring and reporting of healthcare within different organizations. While basic coding is possible in both software packages, coding relationships between entities is not possible in Quirkos. It is, however, possible in ATLAS.ti. With regard to the aim of our project and our research question, transferring our coded data for further analysis using the REFI-QDA project provided us with a more sophisticated result. The REFI-QDA project transfer enabled us to display linked and related organizational entities in an ATLAS.ti network, which can be translated into a hypothetical model. This model can help us understand differences between organizations in decision-making and behavior within the informal healthcare sector concerning the creation of data and a digital infrastructure, the harmonization of data, and the approach of public reporting of health data. Harmonizing of data and digital infrastructure are prerequisites for the monitoring or surveillance of health and health care of (sub-)populations (NÖST et al., 2019). To be sensitive to these differences between organizations is essential to promote a shared system within the informal healthcare system. [55]
The transfer from Quirkos to ATLAS.ti facilitated a more data driven, comparative hermeneutical coding approach. From a subjective view, skills and experience are necessary for using ATLAS.ti; Quirkos in contrast is simple and easy to use without experience. The export from Quirkos and import into ATLAS.ti worked well but produced some challenges that are attributable to the "translation" of Quirkos' structure into the structure of ATLAS.ti. The reported challenges are manageable and the benefits of transferability of data between both QDAS prevail. [56]
7. iLCM to NVivo: Hate Speech in Facebook Comments
In recent years, text mining as a set of computer-assisted methods to semantically structure large textual datasets became a methodological innovation in the social sciences (WIEDEMANN, 2013). There have been several attempts to integrate text mining with theoretical and methodological backgrounds from qualitative analysis (e.g., GLASZE, 2007; INABA & KAKAI, 2019; JACOBS & TSCHÖTSCHEL, 2019; LEMKE & STULPE, 2016; MAUTNER, 2009; WIEDEMANN, 2016). However, critics have been pointing to the fact that although (semi-) automatic structuring of large text collections can be useful, interpretively oriented social scientists usually are interested in much more in-depth understanding of their data. Beyond quantifiable structures of what is said, they look into how things are expressed, particularly into (potential) outliers, and contrastive cases (PHILIPPS, 2018). As an extension to the critical discourse analysis "Hate Speech and Counter-Speech in the Commentary of Mass Media Coverage on Facebook" (FEDTKE & WIEDEMANN, 2020), we employed the REFI-QDA project to engage in a truly mixed-method approach combining text mining using the iLCM software with qualitative coding using NVivo. [57]
7.2 Data format and preparation
In our study, we investigated a corpus of roughly 360.000 Facebook comments crawled from popular German mass media accounts of for example Spiegel Online33) and Tagesschau.34) Comments and replies to comments were selected from ca. 3.000 discussion threads during a time range of five months in 2017. Threads were selected only if the corresponding official post text of the mass media account contained at least one term of a list of filter keywords.35) This key term filter was applied to retrieve a corpus of (potentially) controversial topics around refugees, migration, and discrimination to study the relationship between hate and counter-speech on German Facebook. We aspired to answer the question how hate speech and counter-speech relate to each other on social media. In particular: with what topics are they associated most, and with what discursive strategies or patterns are they combined? [58]
However, the heterogeneity of the users and their discourse positions, as well as the sheer mass of comments, poses major challenges to qualitative analysis. The amount of data is simply too large to be evaluated manually. In a critical discourse analysis following JÄGER (2019), two main steps have to be conducted: structural analysis and in-depth analysis. The former step is supposed to structure a dataset according to themes it contains, then judge their relevancy and look at typical entanglements or framings. We argue that the structuring potential of text mining certainly serves this purpose. [59]
7.3 Analysis and tools used in QDAS
To conduct the structural analysis, we employed the interactive Leipzig Corpus Miner (iLCM, see NIEKLER et al., 2018), an open-source text mining tool for very large document collections. [60]
For a first thematic segmentation of the discourse, we used Latent Dirichlet Allocation (LDA, see BLEI, 2012), a data-driven topic modeling algorithm. Topic modelling results represent semantically coherent clusters based on latent variables inferred from word co-occurrence patterns in documents. Latent topics can be interpreted as categories for qualitative data analysis (WALDHERR et al., 2019). We computed a model with k=65 topics36), interpreted and labeled them along with their most probable words (see Figure 17 for a screenshot of the LDA result in iLCM), and finally attached the most likely topic label per Facebook comment as a thematic coding.
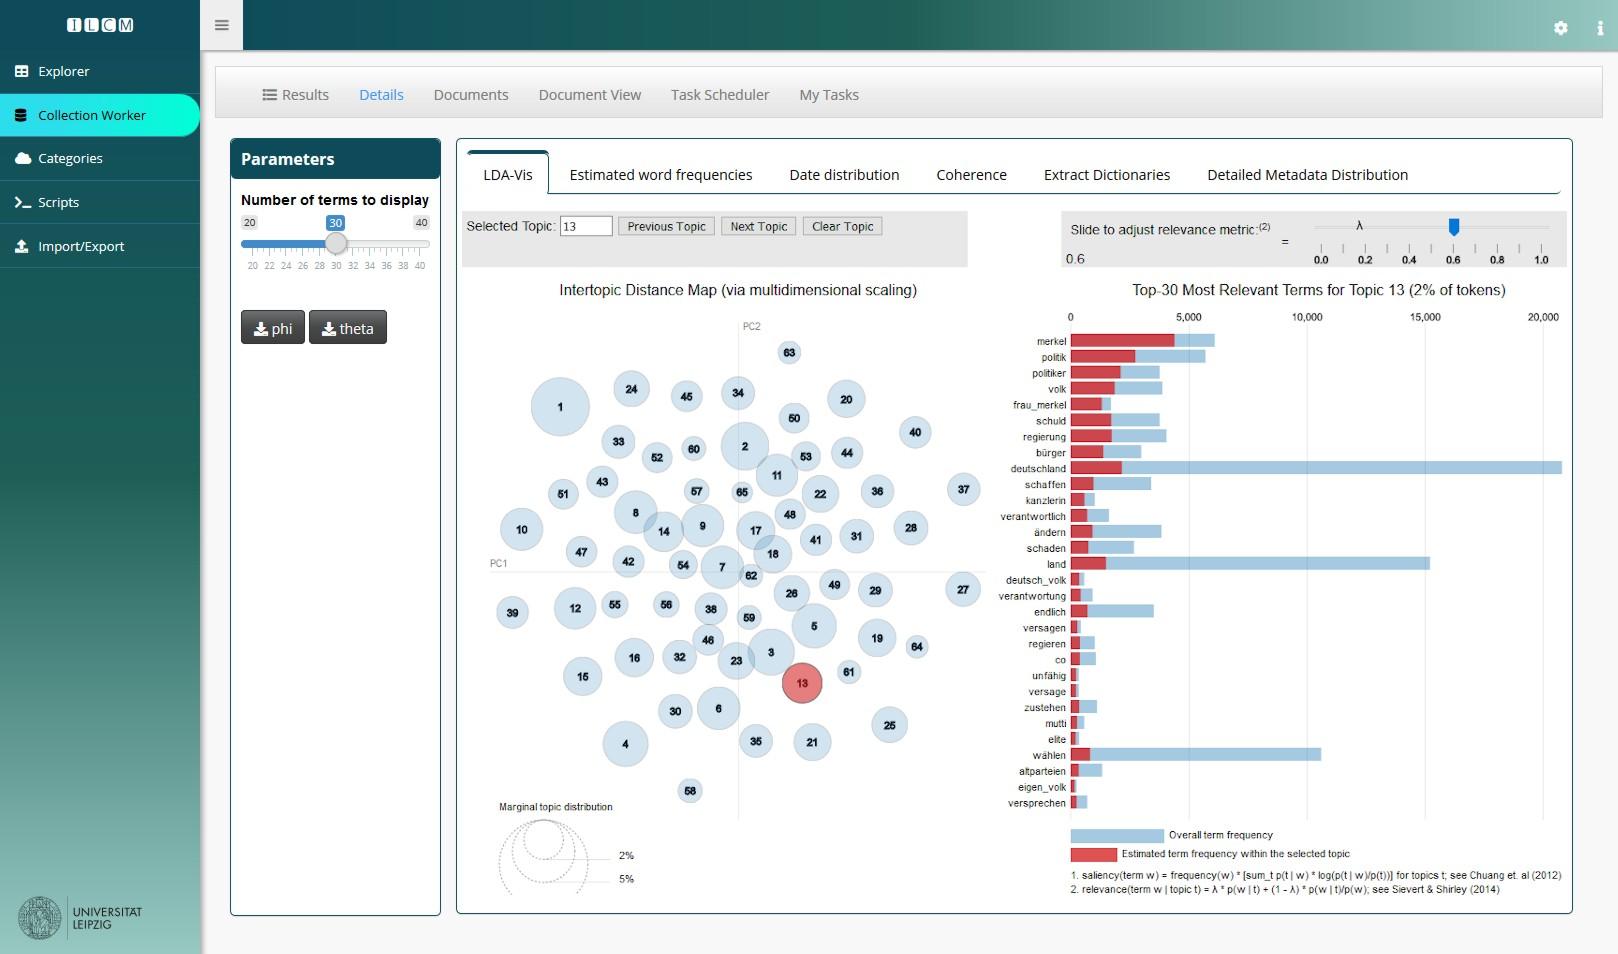
Figure 14: iLCM user interface with LDAvis topic model visualization (SIEVERT & SHIRLEY, 2014). Please click here for an enlarged version of Figure 14. [61]
As a second text mining method, we used text classification to identify hate and counter-speech categories per Facebook comment37). The text classifier is trained on ca. 10.000 comments manually coded into either "hate" or "counter-speech," or "none" according to a theory-driven codebook definition38). Having a primary topic and a classified category annotated to all 360.000 comments, we were then able to derive characteristic patterns of the joint occurrence of both topics and categories. From this, we could sub-select the most interesting and relevant sections of the discourse for further in-depth analysis. [62]
With the procedure described above, we were able to select all comment threads in which, for instance, a hate-speech comment against Angela MERKEL and her government (topic #47) is followed by a counter-speech comment in which a statement or an actor is called racist or "Nazi" (topic #16); a very typical pattern we observed from the final step of our structural analysis39). By this procedure, we obtained 3.667 comments in 118 threads (representing ca. 0.1 % of our original dataset), 162 of them hate speech of the selected anti-MERKEL topic and 205 counter-speech of the selected anti-Nazi topic. [63]
Thanks to the REFI-QDA project, we were able to convert selected threads into a QDPX file. iLCM exports primary topics as well as classified categories as codes. Depending on the export settings, metadata present in the iLCM dataset, such as usernames, the mass media Facebook source pages, or comment dates can be exported either as variables or codes of the REFI-QDA standard. We decided to export the "comment_id" metadata column of our iLCM dataset, which links a reply to its parent comment, as codes too. An important characteristic of the export from iLCM is that codes automatically derived from text mining are restricted to distinctively defined analysis units. Codes either span entire documents, paragraphs or sentences, since those are the context units the algorithms work on. Thus, our export from iLCM contained each Facebook comment as a single plain text document coded with three codings spanning the entire comment. The exported REFI-QDA project file contained 22.002 automatically created codings of the following types: "primary topic," "classification," and the "comment_id." The latter allowed reconstruction of the thread structure of single comments.
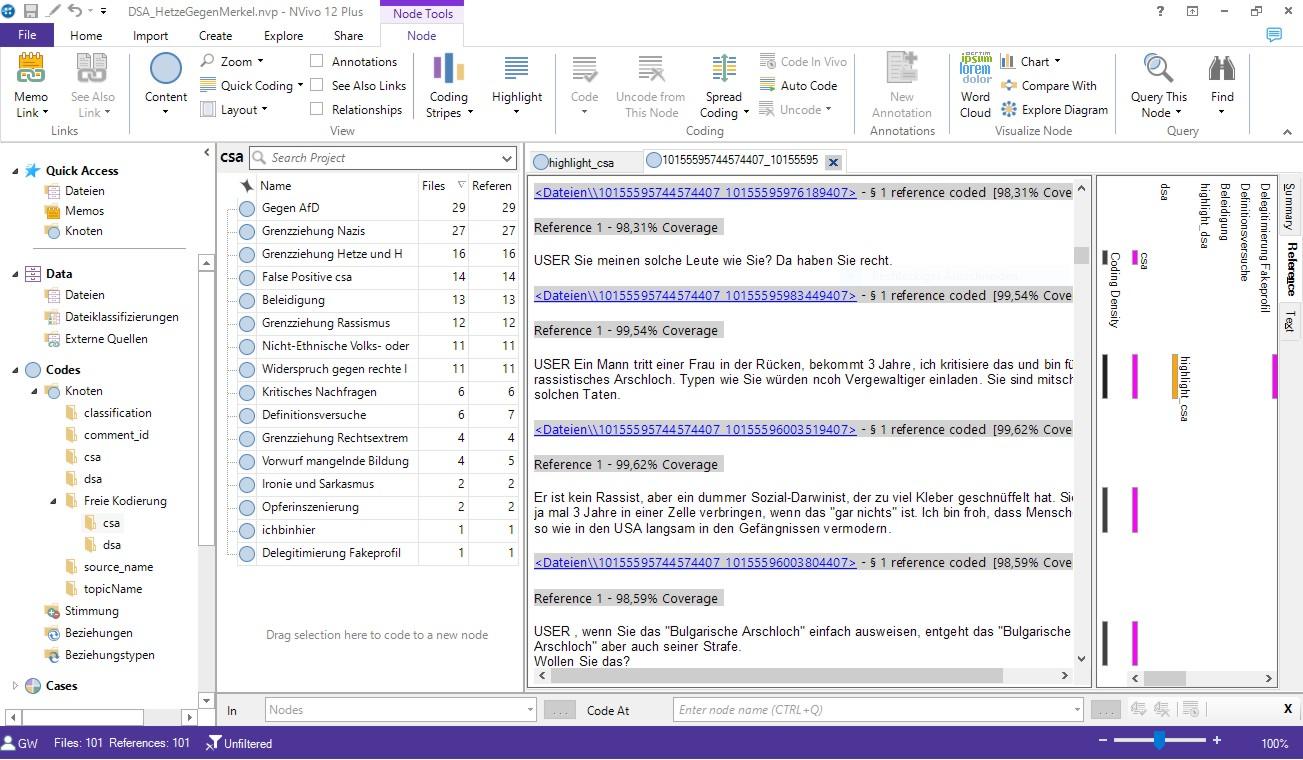
Figure 15: NVivo user interface with Facebook comment threads and open codings. Please click here for an enlarged version of Figure 15. [64]
Having this, we immediately were enabled to conduct the second part of our analysis with any QDAS software supporting the REFI-QDA standard for data import. We selected NVivo (RICHARDS, 2000) for the qualitative in-depth analysis of the systematically selected sub-collection. Import of a QDPX file into NVivo is as straight forward as the opening of any other project file. However, since NVivo has to convert the REFI-QDA project file to its own format, this rather large qualitative dataset with 3.667 comments and 22.002 codings took about 15 minutes to convert. Data selection and exploration in NVivo is quite handy along the exported codings. With one click on the node explorer (a code is called node in NVivo), we could select all hate- or all counter-speech comments, we could select comments by their primary topic, and even got a thread representation of the comments easily by selecting a parent comment_id, which we exported as a separate code from the Facebook metadata earlier (see Figure 15 for the resulting view of a comment thread in NVivo after the import). Being able to read comments in their thread context is especially important for social media data, since they can often only be interpreted meaningfully once one has read what other users wrote earlier. For the qualitative fine-grained analysis following our computer-assisted structural analysis, we carefully read and (re)coded hate, and/or counter-speech comments from our previously conducted automatic selection of threads. Comments were coded in an open coding process capturing, for instance, speech acts of definitions of the "self" and "others" or political stances towards certain issues. Coding the first hundred comments of each category already revealed clear patterns of discursive strategies to back up discourse positions of hate speech commentators and typical patterns of reaction by counter-speech. Computing a code co-occurrence matrix with NVivo further revealed which open nodes regularly were used together in comments. [65]
7.4 Conclusion: Lessons learnt and benefits of transfer
Engaging in an open coding process in NVivo while reading threads containing our selected, typical hate-speech/topic counter-speech/topic co-occurrence patterns, we were able to obtain much more fine-grained categories of counter-speech patterns which are used to repudiate anti-Merkel comments. Also, coding much more specific (short) text sequences instead of whole comments (as done by the automatic process) was helpful to obtain descriptive, exemplary data for in-depth interpretation. [66]
With the help of the fulltext search functionality in NVivo, we were able to look quickly for other occurrences of interesting words and metaphors which caught our attention. At the same time, we introduced a node "false positive" while open coding of counter-speech strategies. This node category was used to mark all occurrences where our previous automatic text classification apparently made a wrong prediction. By this, we learned a lot about the quality and typical errors of our automatic classifier in iLCM and also, we have been enabled to gain trust into its overall results. Although there was a considerable number of errors from automatic classification (ca. 15%), especially when sarcasm and irony were used by a commentator to attack his/her opponents, we learned that the overall majority of predicted categories was correct. Falsely labeled comments could be coded with their correct node and still be included in the overall interpretation. Along with writing memos, we were very efficient in conducting an in-depth qualitative study of the automatically selected 0.1% subset of our large dataset. [67]
Methodologically, the REFI-QDA project successfully enabled us to go directly from a computational process of structure identification to an in-depth analysis, thus smoothly switching from a rather quantitative to a qualitative perspective on our dataset. By this, we oriented ourselves to methodological recommendations of the critical discourse analysis while adapting especially the structural analysis to a sequence of text mining procedures. [68]
8. Conclusive Remarks on the Use of the REFI-QDA Project
The four use cases presented in this article highlight different aspects of benefits as well as challenges of transferring a QDA project from one software to another using the REFI-QDA project. In the next paragraphs we summarize the general conclusions which can be drawn from our experiment. [69]
Our experiment has shown the need for planning your transfer between QDAS in different respects.
In planning the transfer, you might want to think beforehand:
a) Which software would you want to transfer your project to?
b) Why?
c) What would be the best time to do the transfer? Ensure at least basic knowledge of both software packages or find someone who is (more) familiar in the software than you, as this will prevent you from handling the software in ways not intended or useful.
Planning on a transfer between QDAS somewhere along your project does not prevent you from doing another transfer along the way because something in your data (collection) makes this useful at that point in time as well. So please feel free to use the REFI-QDA project at any time for any purpose that seems eligible.
A transfer can go from a "light" QDAS to a more elaborate one, or the other way around, depending on the needs of the researcher. In the first case one might want to transfer in order to use additional functionality in the second QDAS not present in the light QDAS. In the latter case, transferring from a more elaborate to a light QDAS might be implicated when wanting to make research available to students for practice or when wanting to make research available to parties with less budget. [70]
We see the following consequences for teamwork when using the REFI-QDA standard.
Working in a team using different QDAS is surely possible and sometimes even preferable, but it requires (access to) enough expertise in the workings of the packages utilized.
The freedom for researchers to switch between QDAS that implemented the REFI-QDA project, might save them time to master a new QDAS fully as it enables them to work in their preferred QDAS. [71]
8.3 Transparency and secondary analysis
The re-use of your data for different purposes can be enabled using the REFI-QDA project.
The REFI-QDA project can be used for archival purposes as well, so you might consider depositing your analyzed data in a repository for research data40) afterwards. This will enhance the transparency of your project.
If you do archive your data in a repository, you need to ensure beforehand upon collecting your data that the "ownership" issues are dealt with and/or there is consent by owners/respondents to archive the data as well41).
You might consider archiving your old projects, made in earlier versions of QDAS in order to make the data available for secondary analysis. Of course, this would mean updating your old projects to the newer versions of QDAS that have the REFI-QDA project implemented and thinking about the consent issues mentioned above.
If consent issues are handled, archiving/sharing your project with the REFI-QDA project will enable other researchers and/or students to use your data for secondary analysis/training issues.
The availability of an open standard for QDAS projects may lead to increased attractiveness and feasibility of secondary analysis in qualitative research in general. [72]
As text-mining becomes more popular in these digitized times, the REFI-QDA project can enable the switch between different paradigms as illustrated below.
Using the REFI-QDA project is conceivable from different methodological starting points. One could start from a quantitative, text-mining stance and then do more qualitative, open coding in a different QDAS as was illustrated in Case 7 in this article. In this case, open coding even enabled the researcher to validate the quality of his automatic coding processes.
Starting the other way around would also be conceivable, going from qualitative to quantitative by reading and coding in a (stratified) sample of the data first in order to develop categories of interest for quantification. Moving to a text-mining QDAS would then enable the researcher to train the computer to automatically code the entire dataset.
The REFI-QDA project opens up the analysis of multi-modal data if one uses a mere text-mining QDAS like iLCM in the beginning and then switch to other data types like video or images to add on to that analysis. [73]
We are greatly indebted to the Lorentz Centre in Leiden (The Netherlands) for providing us with the space and hospitality for this inspiring week of hard work and interchange and to CLARIAH (The Netherlands) for partly funding this week.
1) Jeanine EVERS has two roles in this endeavor as she was the initiator of REFI and its chair from September 2016- September 2019 and takes part in the experiment with a dataset of her own. <back>
2) We are greatly indebted to the Lorentz Centre for providing us with the space and hospitality for this inspiring week of hard work and interchange. <back>
3) Separation/distancing criticism, homogenization/standardizing criticism, mechanization/dehumanizing criticism, quantification/decontextualizing criticism. As they describe each criticism shortly, it is difficult to grasp the exact meaning. <back>
4) In order to position ourselves: we are in favor of QDAS. Originating in the paper era, the use of QDAS since 1992 has greatly enhanced analytic possibilities and depth of analysis because of the ease of manipulating data in software. Therefore, the time spent in collecting the data in the first place is put to better use as well (EVERS, 2011). <back>
5) With data types, we mean textual data, video files, photographs and audio files in different formats. The so-called "light" QDAS (e.g., f4analyse and Quirkos) and text mining QDAS (e.g., iLCM and QDA Miner) are an exception, as they handle only textual data files. <back>
6) We liked the expression of coding as providing an "analytic skeleton" employed by CHEN, DROUHARD, KOCIELNIK, SUH & ARAGON (2018, p.5). Although they use it specifically in referring to grounded theory methodology, we believe it could be helpful in a more general sense as well. <back>
7) An analogy: would you step in a car and drive it if you hadn't any clue about what a car is and how it functions? To take that further, as you would take some driving lessons before driving a car, you might consider taking a course in QDAS before using it. <back>
8) Personal communication Lolkje ATTEMA and Fred VAN BLOMMESTEIN; see for example https://schemas.liquid-technologies.com. <back>
9) At the moment of writing (August 2019), Version 1 of the REFI-QDA project and of the REFI-QDA codebook. <back>
10) This is a zipped container file, consisting of the data files and all the work done by the researcher like for example coding, codes, links, descriptions, graphs, case organization, notes, selections, sets and such. See Table 1 for the translation of this REFI language into the different QDAS. <back>
11) In September 2019: DANS (Data Archiving and Networking Services, The Netherlands), QDR (the Qualitative Data Repository, USA), DataverseNO (Norway). <back>
12) See the REFI-QDA website for an updated overview of software packages that have implemented the standard and the terminology comparison between QDAS. <back>
13) Between July 6, 2018 and September 13, 2019. <back>
14) Of course, an informed consent declaration when one is interviewing/observing respondents, would need to take this into account as well. <back>
15) We worked on a MacBook (Apple), so the software mentioned in Case 1 was used in the Mac version, but all software packages used for this experiment have versions for different operating systems. <back>
16) An OCR software to convert textual files. <back>
17) The gain of adding prefixes per analytic technique (EVERS & VAN STAA, 2010) lies in 1. the immediate organization of the code list (as this is organized alphabetically), 2. making it really easy to have an quick overview of codes created per analytic technique, as such 3. creating a more systematic approach to your analysis. <back>
18) As geographic positions are important in this data set, we distinguish between camera location (position on the map of Curaçao) and camera position (how the camera is handled, zooming in and out and filming the topic/subject from different positions). <back>
19) Gregor WIEDEMANN shared the information that in earlier times, newspapers used columns of different sizes shattered over one page, which makes it quite difficult to select chunks of text within neighboring columns once they have been digitized. <back>
20) In Acrobat Reader the text blocks were distinguished and could only be selected one by one. We tried enhancing the quality of the PDF by passing it through the OCR software FineReader, but this did not help either. <back>
21) Amigoe di Curacao, June 4, 1969. <back>
22) At the time of the experiment in the Lorentz Centre (August 2019): ATLAS.ti, iLCM (only export, full implementation is foreseen for April 2020), NVivo, QDA Miner, Quirkos and Transana. See the website: www.qdasoftware.org for updated information on software packages that have implemented the REFI-QDA standard. <back>
23) This doctoral research was funded by the project ERC Starting Grant Qualidem – "Eroding Democracies. A Qualitative (Re-)Appraisal of how Policies Shape Democratic Linkages in Western Democracies." Awarded to Virginie VAN INGELGOM and coordinated by Virginie VAN INGELGOM and Claire DUPUY, the Qualidem project was supported by the European Research Council (ERC) under the European Union's Horizon2020 research and innovation program (grant agreement 716208). This article reflects only the authors' view, and the European Research Council is not responsible for any possible use of the information it contains. For more information on Qualidem see the project's website. <back>
24) More precisely: 40 transcribed individual one-three hour interviews with young people in France and Britain collected in the mid 1990's (BELOT, 2000); 24 transcribed three-hour focus group discussions with French, British, and Belgian citizens collected in 2006 by the "Citizens Talking About Europe" (CITAE) project (DUCHESNE et al., 2013; VAN INGELGOM, 2014); and eight transcripts of focus groups held in Brussels in 2014 (MERCENIER, 2019). The Qualidem project is very grateful to these researchers for having shared their data. <back>
25) Public policy, media, democratic linkage, and neoliberalism. <back>
26) Some documents were excluded from analysis, such as for instance transcripts of try-out or test focus groups conducted. <back>
27) Note how only a numbered listing of the first words for every coded quotation is visible to the user. <back>
28) The idea being that having something coded with the wrong code is preferable than something relevant being overlooked and not coded. <back>
29) "The name Quirkos comes from the Greek 'kirkos', the root of the word 'circle' and 'qu' for qualitative. It represents the Qualitative Bubbles (Quirks) that are central to the interface" (Quirkos Manual Version 2.2, 2019, p.6). <back>
30) They are called codes or nodes in other QDAS. <back>
31) Canvas view with Quirks bubbles on the left and a text column on the right. <back>
32) These relations "link" the objects together and define what relationship is conceived between them. <back>
33) Spiegel Online, an online offshoot of the news magazine Der Spiegel, is one of the most widely read German news websites. <back>
34) Tagesschau.de is the associated website for the most watched German television news program Tagesschau, which is produced by the public broadcast network ARD. <back>
35) The keyterm list contains the following German word stems (translation, respective explanations are given in square brackets):afd [AfD, a German right-wing radical party],afrika [Africa],anschlag [attack],asyl [asylum],ausländ* [foreign],flucht [escape],flücht* [refugee],frau [woman],humanit* [humanitarian],islam [Islam],kopftuch [headscarf],missbrauch [abuse],muslim [Muslim],nazi [Nazi],npd [NPD, a German right-wing extremist party],rassis* [racism],schleier [scarf],sexuell [sexual],sudan [Sudan],syr* [Syria],terror [terror],vergewalt* [rape]. <back>
36) The number of topics was decided based on a compromise between methodological considerations for rather fine-grained topics in combination with a numeric optimization method provided by NIKITA (2016). <back>
37) Text classification accuracy was measured with 10-fold cross validation 71% and F1=67%. <back>
38) Training data was annotated by two research assistants. Their intercoder-reliability was measured with Krippendorff's alpha=0.65. <back>
39) Patterns are determined on co-occurrence counts of hate-speech/topic and count-speech/topic pairs in a window of five sequential comments in a thread and ranked with the Dice coefficient. <back>
40) The Dutch repository DANS has proclaimed the REFI-QDA standard as a preferred format for deposit of qualitative data, as did the American Qualitative Data Repository QDR and the Norwegian DataverseNO. <back>
41) It is possible to archive data in a repository with restricted access if needed for privacy reasons. In such a case, either the depositing researcher needs to be approached for access to the dataset, or the data are blocked for a predesignated period of time. <back>
Antoniadou, Victoria (2017). Collecting, organizing and analyzing multimodal data sets: The contribution of CAQDAS. In Emilie Moore & Melinda Doody (Eds.), Qualitative approaches to research on plurilingual education (pp.435-450). Dublin: Research-publishing.net, https://research-publishing.net/manuscript?10.14705/rpnet.2017.emmd2016.640 [Accessed: April 8, 2020].
Bazeley, Pat (2013). Qualitative data analysis. Practical strategies. London: Sage.
Bazeley, Pat & Jackson, Kristi (2013). Qualitative data analysis with NVIVO (2nd ed.). Los Angeles, CA: Sage.
Belot, Céline (2000). L'Europe en citoyenneté: Jeunes français et britaniques dans le processus de légitimation de l'Union européenne [Europe and citizenship; French and British youth in the process of legitimizing the European Union]. Doctoral dissertation, political science, Université Pierre Mendès, France, http://www.theses.fr/2000GRE21044 [Accessed: April 9, 2020].
Blei, David M. (2012): Probabilistic topic models. Surveying a suite of algorithms that offer a solution to managing large document archives. Communications of the ACM, 55(4), 77-84.
Bohnsack, Ralf (2009). Qualitative Bild- und Videointerpretation. Opladen: Verlag Barbara Budrich.
Cabrera, Gino A. (2018). The use of computer applications in qualitative research: A review. Asia Pacific Journal of Academic Research in Social Sciences, 3, 35-42, https://research.lpubatangas.edu.ph/wp-content/uploads/2019/02/APJARSS-2018-005a.pdf [Accessed: April 9, 2020].
Campbell, Andrea L. (2011). Policy feedbacks and the impact of policy designs on public opinion. Journal of Health Politics, Policy and Law, 36(6), 961-973.
Chauvin, Pierre; Simonnot, Nathalie; Vanbiervliet Frank; Vicart, Marie & Vuillermoz, Cécile (2015). Access to healthcare for people facing multiple vulnerabilities in health in 26 cities across 11 countries. Report on the social and medical data gathered in 2014 in nine European countries, Turkey and Canada. Paris: Doctors of the World—Médecins du monde international network.
Chen, Nan-Chen; Drouhard, Margaret; Kocielnik, Rafal; Suh, Jina & Aragon, Cecilia R. (2018). Using machine learning to support qualitative coding in social science: Shifting the focus to ambiguity. ACM Transaction on Interactive Intelligent Systems, 9(4), Art. 39, https://dl.acm.org/doi/10.1145/3185515 [Accessed: April 13, 2020].
Corti, Louise (2008). JISC final report. Data exchange tools and utilities (DExT). Repositories and preservation tools programme. Colchester: UK Data Archive, https://dam.data-archive.ac.uk/reports/research/DExT_finalreport_JISC.pdf [Accessed: April 9, 2020].
Corti, Louise & Gregory, Arofan (2011). CAQDAS comparability. What about CAQDAS data exchange?. Forum Qualitative Sozialforschung / Forum Qualitative Social Research, 12(1), Art. 35, http://dx.doi.org/10.17169/fqs-12.1.1634 [Accessed: April 8, 2020].
De Jong, Lea; Pavlova, Milena; Winters, Marjolein & Rechel, Bernd (2017). A systematic literature review on the use and outcomes of maternal and child healthcare services by undocumented migrants in Europe. European Journal of Public Health, 27(6), https://doi.org/10.1093/eurpub/ckx181 [Accessed: April 8, 2020].
Dempster, Paul G. & Woods, David K. (2011). The economic crisis through the eyes of Transana. Forum Qualitative Sozialforschung / Forum: Qualitative Social Research, 12(1), Art. 16, http://dx.doi.org/10.17169/fqs-12.1.1515 [Accessed: April 8, 2020].
Di Gregorio, Silvana & Davidson, Judith (2008). Qualitative research design for software users. Maidenhead: Open University Press McGraw-Hill Education.
Duchesne, Sophie; Frazer, Elizabeth; Haegel, Florence & Van Ingelgom, Virginie (2013). Citizens' reactions to European integration compared overlooking Europe. London: Palgrave Macmillan. https://doi.org/10.1057/9781137297266 [Accessed: April 14, 2020].
Dupuy, Claire & Van Ingelgom, Virginie (2015). Citizens' exit from the EU, back to the nation-state? Policy feedback and legitimacy in times of crisis. Presented at the 2015 European Union Studies Association Conference, Boston, MA, USA, March, 5-7, https://dial.uclouvain.be/pr/boreal/object/boreal:166013 [Accessed: April 8, 2020].
Dupuy, Claire & Van Ingelgom, Virginie (2016). Eroding democracies: A qualitative (re-) appraisal of how policies shape democratic linkages in Western democracies. ERC Starting Grant 2016 Research Proposal. Confidential.
Evers, Jeanine C. (2011). From the past into the future. How technological developments change our ways of data collection, transcription and data analysis. Forum Qualitative Sozialforschung / Forum: Qualitative Social Research, 12(1), Art. 38, http://dx.doi.org/10.17169/fqs-12.1.1636 [Accessed: April 8, 2020].
Evers, Jeanine (Ed.) (2015). Kwalitatieve analyse: kunst én kunde [Qualitative analysis: Art and kraft]. Amsterdam: Boom Lemma uitgevers.
Evers, Jeanine C. (2016). Elaborating on thick analysis: About thoroughness and creativity in qualitative analysis. Forum Qualitative Sozialforschung / Forum: Qualitative Social Research, 17(1), Art. 6, http://dx.doi.org/10.17169/fqs-17.1.2369 [Accessed: April 8, 2020].
Evers, Jeanine (2018a). Ieder vogeltje zingt ... over big data en QDA software [Each bird sings ... about big data and QDA software]. KWALON, 23(3), 29-31.
Evers, Jeanine C. (2018b). Current issues in qualitative data analysis software (QDAS): A user and developer perspective. The Qualitative Report, 23(13), 61-73, https://nsuworks.nova.edu/tqr/vol23/iss13/5/ [Accessed: April 8, 2020].
Evers, Jeanine C. & Van Staa, AnneLoes (2010). Qualitative analysis in case study. In Albert J. Mills, Gabrielle Durepos & Elden Wiebe (Eds.), Encyclopedia of case study research (pp.750-758). Thousand Oaks, CA: Sage.
Evers, Jeanine C.; Silver, Christina; Mruck, Katja & Peeters, Bart (2011). Introduction to the KWALON experiment: Discussions on qualitative data analysis software by developers and users. Forum Qualitative Sozialforschung / Forum: Qualitative Social Research, 12(1), Art. 40, http://dx.doi.org/10.17169/fqs-12.1.1637 [Accessed: April 8, 2020].
Fedtke, Cornelia & Wiedemann, Gregor (2020/in print). Hass- und Gegenrede in der Kommentierung massenmedialer Berichterstattung auf Facebook. Eine computergestützte kritische Diskursanalyse. In Peter Klimczak, Christer Petersen & Samuel Schilling (Eds.), Die Gesellschaft im Spiegellabyrinth sozialer Medien. Wiesbaden: Springer VS.
Glasze, Georg (2007). Vorschläge zur Operationalisierung der Diskurstheorie von Laclau und Mouffe in einer Triangulation von lexikometrischen und interpretativen Methoden. Forum Qualitative Sozialforschung / Forum: Qualitative Social Research, 8(2), Art. 14, http://dx.doi.org/10.17169/fqs-8.2.239 [Accessed: April 8, 2020].
Harvey, David (2005). A brief history of neoliberalism. Oxford: Oxford University Press.
Hay, Colin (2007). Why we hate politics. Cambridge: Polity.
Heath, Christian; Hindmarsh, Jon & Luff, Paul (2010). Video in qualitative research. Analysing social interaction in everyday life. Los Angeles, CA: Sage.
Heaton, Janet (1998). Secondary analysis of qualitative data. Social Research Update, 22, http://sru.soc.surrey.ac.uk/SRU22.html [Accessed: April 13, 2020].
Heaton, Janet (2008). Secondary analysis of qualitative data: An overview. Historical Social Research / Historische Sozialforschung, 33(3), 33-45, https://www.ssoar.info/ssoar/bitstream/handle/document/19143/ssoar-hsr-2008-no_3__no_125-heaton-secondary_analysis_of_qualitative_data.pdf?sequence=1 [Accessed: April 13, 2020].
Inaba, Mitsuyuki & Kakai, Hisako (2019). Grounded text mining approach: A synergy between grounded theory and text mining approaches. In Antony Bryant & Kathy Charmaz (Eds.), The Sage handbook of current developments in grounded theory (pp.332-351). London: Sage.
Jackson, Kristi; Paulus, Trena & Woolf, Nicholas H. (2018). The walking dead genealogy: Unsubstantiated criticisms of qualitative data analysis software (QDAS) and the failure to put them to rest. The Qualitative Report, 23(13), 74-91, http://nsuworks.nova.edu/tqr/vol23/iss13/6 [Accessed: April 8, 2020].
Jacobs, Thomas & Tschötschel, Robin (2019). Topic models meet discourse analysis: A quantitative tool for a qualitative approach. International Journal of Social Research Methodology, 22(5), 469-485.
Jäger, Margarete (2019). Wie kritisch ist die kritische Diskursanalyse?. In Thomas Wiedemann & Christine Lohmeier (Eds.), Diskursanalyse für die Kommunikationswissenschaft (pp.61-82). Wiesbaden: Springer VS.
Konopásek, Zdenĕk (2008). Making thinking visible with ATLAS.ti: Computer assisted qualitative analysis as textual practices. Forum Qualitative Sozialforschung / Forum: Qualitative Social Research, 9(2), Art. 12, http://dx.doi.org/10.17169/fqs-9.2.420 [Accessed: April 13, 2020].
Kuckartz, Udo (2018). Qualitative Inhaltsanalyse. Methoden, Praxis, Computerunterstützung. Weinheim: Beltz.
Lemke, Matthias & Stulpe, Alexander (2016). Blended Reading. Theoretische und praktische Dimensionen der Analyse von Text und sozialer Wirklichkeit im Zeitalter der Digitalisierung. In Matthias Lemke & Gregor Wiedemann (Eds.), Text Mining in den Sozialwissenschaften. Grundlagen und Anwendungen zwischen qualitativer und quantitativer Diskursanalyse (pp.17-62). Wiesbaden: Springer VS.
Mautner, Gerlinde (2009). Checks and balances: How corpus linguistics can contribute to CDA. In Ruth Wodak & Michael Meyer (Eds.), Methods of critical discourse analysis (pp.122-143). London: Sage.
Mercenier, Heidi (2019). "C'est compliqué!": L'Union européenne vue par des jeunes Bruxellois. Contribution à l'étude des rapports des citoyens à la politique [It is complicated! The European Union seen by Brussels youth. Contribution to the study of citizens' relation to politics]. Doctoral dissertation, political and social sciences, Université Saint Louis, Belgium, https://dial.uclouvain.be/pr/boreal/object/boreal:214874 [Accessed: April 14, 2020].
Mühlmeyer-Mentzel, Agnes (2011). Das Datenkonzept von ATLAS.ti und sein Gewinn für "Grounded-Theory"-Forschungsarbeiten. Forum Qualitative Sozialforschung / Forum: Qualitative Social Research, 12(1), Art. 32, http://dx.doi.org/10.17169/fqs-12.1.1621 [Accessed: April 13, 2020].
Müllerschön, Johanna; Koschollek, Carmen; Santos-Hövener, Claudia; Kuehne, Anna; Müller-Nordhorn, Jacqueline & Bremer, Viviane (2019). Impact of health insurance status among migrants from sub-Saharan Africa on access to health care and HIV testing in Germany: a participatory cross-sectional survey. BMC International Health and Human Rights, 19, Art. 10, https://doi.org/10.1186/s12914-019-0189-3 [Accessed: September 15, 2019].
Muhr, Thomas (2000). Increasing the reusability of qualitative data with XML. Forum Qualitative Sozialforschung / Forum: Qualitative Social Research, 1(3), Art. 20, http://dx.doi.org/10.17169/fqs-1.3.1037 [Accessed: April 13, 2020].
Niekler, Andreas; Bleier, Arnim; Kahmann, Christian; Posch, Lisa; Wiedemann, Gregor & Erdogan, Kenan (2018). iLCM—A virtual research infrastructure for large-scale qualitative data. In Nicoletta Calzolari, Khalid Choukri, Christopher Cieri, Thierry Declerck, Sara Goggi & Koiti Hasida (Eds..), Proceedings of the Eleventh International Conference on Language Resources and Evaluation (LREC) (pp.13131319). Miyazaki: ELRA.
Nikita, Murzintcev (2016). ldatuning: Tuning of the latent dirichlet allocation models parameters. R package, Version 1.0.0., https://cran.r-project.org/web/packages/ldatuning/index.html [Accessed: April 14, 2020].
Norris, Pippa (2011). Democratic deficit: Critical citizens revisited. New York, NY: Cambridge University Press.
Nöst, Stefan; Jahn, Rosa; Aluttis, Frank; Drepper, Johannes; Preussler, Stella; Qreini, Markus; Breckenkamp, Jürgen; Razum, Oliver & Bozorgmehr, Kayvan (2019). Surveillance der Gesundheit und primärmedizinischen Versorgung von Asylsuchenden in Aufnahmeeinrichtungen: Konzept, Entwicklung und Implementierung. Bundesgesundheitsblatt-Gesundheitsforschung-Gesundheitsschutz, 62(7), 881-892, https://doi.org/10.1007/s00103-019-02971-5 [Accessed: April 14, 2020].
O'Neill, Maureen M.; Booth, Sarah R. & Lamb, Janeen T. (2018). Using NVivo™ for literature reviews: The eight step pedagogy (N7+1). The Qualitative Report, 23(13), 21-39, http://nsuworks.nova.edu/tqr/vol23/iss13/3 [Accessed: April 8, 2020].
Paulus, Trena M.; Evers, Jeanine C. & De Jong, Franciska. (2018). Reflecting on the future of QDA software: Special issue of the qualitative report. The Qualitative Report, 23(13), 1-5, https://nsuworks.nova.edu/tqr/vol23/iss13/1/ [Accessed: April 8, 2020].
Paulus, Trena M.; Lester, Jessica N. & Dempster, Paul G. (2014). Digital tools for qualitative research. London: Sage.
Philipps, Axel (2018). Text Mining-Verfahren als Herausforderung für die rekonstruktive Sozialforschung. Sozialer Sinn. Zeitschrift für hermeneutische Sozialforschung, 19(2), 367-387.
Pierson, Paul (1993). When effect becomes cause: Policy feedback and political change. World Politics, 45(4), 595-628.
Reichertz, Jo (2016). Qualitative und interpretative Sozialforschung. Eine Einladung. Wiesbaden: Springer VS.
Richards, Lyn (2000). Using NVivo in qualitative research. London: Sage.
Rizkallah, Elias (2016). QDA software combatibility: Towards an exchange format with developers for their users. Conference paper, KWALON Conference "Reflecting on the Future of QDA Software: Chances and Challenges for Humanities, Social Sciences and Beyond", Rotterdam, The Netherlands, August 25-26, 2016.
Saldaña, Johnny (2013). The coding manual for qualitative researchers (2nd ed.). Los Angeles, CA: Sage.
Saldaña, Johnny (2015). The coding manual for qualitative researchers (3rd ed.). Los Angeles, CA: Sage.
Sievert, Carson & Shirley, Kenneth E. (2014): LDAvis: A method for visualizing and interpreting topics. In Jason Chuang, Spence Green, Marti Hearst, Jeffrey Heer & Philipp Koehn (Eds.), Proceedings of the Workshop on Interactive Language Learning, Visualization, and Interfaces (pp.63-70). Baltimore, MD: ACL.
Silver, Christina & Lewins, Ann (2014). Using software in qualitative research. A step-by-step guide. London: Sage
Silver, Christina & Patashnick, Jennifer (2011). Finding fidelity: Advancing audiovisual analysis using software. Forum Qualitative Sozialforschung / Forum: Qualitative Social Research, 12(1), Art. 37, http://dx.doi.org/10.17169/fqs-12.1.1629 [Accessed: April 13, 2020].
Sohn, Brian K. (2017). Phenomenology and qualitative data analysis software (QDAS): A careful reconciliation. Forum Qualitative Sozialforschung / Forum: Qualitative Social Research, 18(1), Art. 14, http://www.qualitative-research.net/index.php/fqs/article/view/2688/4074 [Accessed: April 6, 2020].
Suess, Amets; Ruiz Pérez, Isabel; Ruiz Azarola, Ainhoa & March Cerdà, Joan Carles (2014). The right of access to health care for undocumented migrants: A revision of comparative analysis in the European context. European Journal of Public Health, 24(5), 712-720, https://doi.org/10.1093/eurpub/cku036 [Accessed: April 8, 2020].
Vaismoradi, Mojtaba & Snelgrove, Sherrill (2019). Theme in qualitative content analysis and thematic analysis. Forum Qualitative Sozialforschung / Forum: Qualitative Social Research, 20(3), Art. 23, http://dx.doi.org/10.17169/fqs-20.3.3376 [Accessed: April 8, 2020].
Van Horik, René (2015). Databeheer: hergebruik en archivering van kwalitatieve onderzoeksdata. [Data handling: Re-use and archiving of qualitative research data]. In Jeanine Evers (Ed.), Kwalitatieve analyse: kunst én kunde [Qualitative analysis: Art and kraft] (pp.341-350). Amsterdam: Boom uitgevers.
Van Ingelgom, Virginie (2014). Integrating indifference: A comparative, qualitative and quantitative approach to the legitimacy of European integration. Colchester: ECPR Press.
Van Manen, Max (2014). Phenomenology of practice: Meaning-giving methods in phenomenological research and writing. Walnut Creek, CA: Left Coast Press.
Waldherr, Annie; Wehden, Lars-Ole; Stoltenberg, Daniela; Miltner, Peter; Ostner, Sophia & Pfetsch, Barbara (2019). Induktive Kategorienbildung in der Inhaltsanalyse: Kombination automatischer und manueller Verfahren. Forum Qualitative Sozialforschung / Forum: Qualitative Social Research, 20(1), Art. 18, http://dx.doi.org/10.17169/fqs-20.1.3058 [Accessed: April 13, 2020].
Wiedemann, Gregor (2013). Opening up to big data: Computer-assisted analysis of textual data in social sciences. Forum Qualitative Sozialforschung / Forum: Qualitative Social Research, 14(2), Art. 17, http://dx.doi.org/10.17169/fqs-14.2.1949 [Accessed: April 13, 2020].
Wiedemann, Gregor (2016). Text mining for qualitative data analysis in the social sciences. A study on democratic discourse in Germany. Wiesbaden: Springer VS.
Woods, David K. & Dempster, Paul G. (2011). Tales from the bleeding edge: The qualitative analysis of complex video data using Transana. Forum Qualitative Sozialforschung / Forum: Qualitative Social Research, 12(1), Art. 17, http://dx.doi.org/10.17169/fqs-12.1.1516 [Accessed: April 13, 2020].
Wolski, Urszula (2018). The history of the development and propagation of QDA software. The Qualitative Report, 23(13), 6-10, http://nsuworks.nova.edu/tqr/vol23/iss13/2 [Accessed: April 8, 2020].
Jeanine EVERS is director of Evers Research & training, board member of KWALON and initiator and former chair (2016-2019) of REFI. She trains PhD students and researchers in qualitative methods and QDAS and recently did evaluative research in the fields of public administration and education.
Contact:
Jeanine Evers
Evers Research & training
PO Box 82118
2508 EC The Hague, The Netherlands
Tel.: +31 6 534 66123
E-mail: jcevers@eversresearch.nl
URL: https://www.eversresearch.nl
Mauro Ugo CAPRIOLI is currently working as a PhD-student. His research is concerned with how European citizens perceive, experience, and define their relationship with politics in the current age of neo-liberalism, globalization, and populism. His main research interests are political sociology, qualitative methods and methodologies, citizens' perceptions of politics, and populism.
Contact:
Mauro Ugo Caprioli
Faculty of Economic, Social and Political Sciences and Communication, UCLouvain
Institut de sciences politiques Louvain-Europe (ISPOLE)
SPLE
Place Montesquieu 1/L2.08.07
1348 Louvain-la-Neuve, Belgium
E-mail: Mauro.caprioli@uclouvain.be
URL: https://uclouvain.be/fr/repertoires/mauro.caprioli
Stefan NÖST is a professor for health and nursing sciences at the DHBW Stuttgart, Germany. He is also researcher at the department for General Medicine and Health Services Research, University Hospital Heidelberg, Germany. His research fields are health services for vulnerable groups and implementation research on health and nursing interventions.
Contact:
Prof. Dr. Stefan Nöst
Baden-Wuerttemberg Cooperative State University (DHBW) Stuttgart
Applied Health and Nursing Sciences
Tübinger Straße 33,
70178 Stuttgart, Germany
Tel.: +49 711 1849 4608
E-mail: stefan.noest@dhbw-stuttgart.de
URL: https://www.dhbw-stuttgart.de
Gregor WIEDEMANN is a post-doctoral researcher at the computer science department of the Universität Hamburg, Germany. He works in the field of natural language processing and is especially interested in text mining applications for the social sciences.
Contact:
Dr.-Ing. Gregor Wiedemann
MIN Fakultät
Fachbereich Informatik
Vogt-Kölln-Straße 30,
22527 Hamburg, Germany
Tel.: +49 40 42883 2366
Fax: +49 40 42883 2345
E-mail: gwiedemann@informatik.uni-hamburg.de
URL: https://www.inf.uni-hamburg.de/en/inst/ab/lt/people/gregor-wiedemann.html
Evers, Jeanine; Caprioli, Mauro Ugo; Nöst, Stefan & Wiedemann, Gregor (2020). What is the REFI-QDA Standard: Experimenting With the Transfer of Analyzed Research Projects Between QDA Software [73 paragraphs]. Forum Qualitative Sozialforschung / Forum: Qualitative Social Research, 21(2), Art. 22, http://dx.doi.org/10.17169/fqs-21.2.3439.

Creative Commons Attribution 4.0 International License