Volume 24, No. 1, Art. 11 – January 2023
The Fundamental Difference Between Qualitative and Quantitative Data in Mixed Methods Research
Judith Schoonenboom
Abstract: Mixed methods research is commonly defined as the combination and integration of qualitative and quantitative data. However, defining these two data types has proven difficult. In this article, I argue that qualitative and quantitative data are fundamentally different, and this difference is not about words and numbers but about condensation and structure. As qualitative data are analyzed with qualitative methods and quantitative data with quantitative methods, we cannot analyze one type of data with the other type of method. Quantitative data analysis can reveal new patterns, but these are always related to the existing variables, whereas qualitative data analysis can reveal new aspects that are hidden in the data. To consider data as quantitative or qualitative, we should judge these data as end products, not in terms of the process through which they come into being. Thus, quantitizing qualitative data results in quantitative data and the analysis thereof is quantitative, not mixed, data analysis. For mixed data analysis, both real, non-quantitized qualitative data and quantitative data are needed. As these quantitative data may be quantitized qualitative data, the implication is that, contrary to a common view, mixed methods research does not necessarily involve quantitative data collection.
Key words: mixed methods research; qualitative data; quantitative data; hybrid data; quantitizing; mixed dataset; qualitative data analysis; quantitative data analysis; mixed data analysis; case comparison table
Table of Contents
1. Introduction
2. A First Exploration: Numerical Quantitative Data
3. An Extension: Textual Values as Quantitative Data
4. Qualitative Data
5. Transforming Data in Mixed Methods Research
6. Integrating Data: The Mixed Dataset
7. Implications for Mixed Methods Practice
In definitions of mixed methods research, an important role is played by quantitative and qualitative data. Mixed methods research is defined by various authors as a combination of quantitative and qualitative data collection and data analysis (BRYMAN, 2008; DE ALLEGRI et al., 2020), resulting in the production of both quantitative and qualitative data. Importantly, these quantitative and qualitative data should be meaningfully connected or integrated for a study to be called a mixed methods study (BRYMAN, 2006; CRESWELL & PLANO CLARK, 2018; MERTENS et al., 2016). [1]
For this definition to be workable, we must know what qualitative and quantitative data are, that is, how they are defined. This question has proven to be complex and controversial. In general, mixed methods scholars have tended to move away from the "false dichotomy" (NEWMAN, RIDENOUR, NEWMAN & DeMARCO, 2003, p.169) between qualitative and quantitative research approaches (BERGMAN, 2008; MERTENS et al., 2016; TASHAKKORI, JOHNSON & TEDDLIE, 2021; but see MAXWELL, 2019, 2022) and away from viewing qualitative and quantitative data as two mutually exclusive categories. WITT (2001), for instance, identified hybrid data as a category of its own. More recently, some mixed methods scholars have denied that data have a quantitative or qualitative character and instead viewed them as experiences represented in the form of words or numbers (SANDELOWSKI, 2014; SANDELOWSKI, VOILS & KNAFL, 2009). Others have argued that by separating quantity from qualities, we risk losing the perspective of the whole (BAZELEY, 2018a). Thus, the distinction between qualitative and quantitative data is "not straightforward" (VOGL, in press). [2]
This raises a question: How can we engage in mixed methods research as a meaningful integration of qualitative and quantitative data if we do not know what these data types are? Various solutions have been proposed. One would be to define mixed methods research not as involving quantitative and qualitative data but as different methodological styles (BREWER & HUNTER, 1989) or mental models (GREENE, 2007; MAXWELL, 2019). Another solution is to interpret the labels quantitative and qualitative not as mutually exclusive categories but, rather, "shorthand" (BAZELEY, 2018b, p.8; SMALL, 2011, p.60) or "convenient" labels (BERGMAN, 2008, p.14). In this way, we would still be able to speak of integrating qualitative and quantitative data. A third solution would be to find one or more characteristics that can be used to distinguish qualitative from quantitative data. Until now, however, no clear defining characteristics of qualitative and quantitative have been identified (BAZELEY, 2018b; GOBO, FIELDING, LA ROCCA & VAN DER VAART, 2022; MORGAN, 2018; SMALL, 2011). [3]
In this article, I take up this challenge by arguing that qualitative and quantitative data are fundamentally different. In my argument, I depart from two common positions. I will argue that the distinction between qualitative and quantitative data is not a question of words and numbers, and that data transformation is not an argument against distinguishing between qualitative and quantitative data. I begin by exploring numerical quantitative data (Section 2), followed by quantitative data with textual values (Section 3). Section 4 is about qualitative data. Having described the characteristics of and differences between quantitative and qualitative data in Sections 2 to 4, I next turn to their relations in mixed methods research. In Section 5, I describe how in mixed methods research, qualitative data can be transformed into quantitative data. Section 6 is about data integration, combining datasets into one new dataset, and I discuss the difference between quantitative integrated datasets and mixed datasets, both of which contain quantitative and qualitative data. In Section 7, I close by drawing out the implications of this fundamental difference between qualitative and quantitative data for practice and discussing the different possible roles of quantitative, qualitative, and mixed datasets and data analysis in mixed methods research. [4]
2. A First Exploration: Numerical Quantitative Data
|
Government |
Country |
CNr |
GER |
IRE |
Unema |
Corpa |
Opena |
Lefta |
Act |
|
Kohl 3 |
Germany |
1 |
1 |
0 |
0.83 |
0.75 |
0.48 |
0 |
-18.22 |
|
Kohl 4 |
Germany |
1 |
1 |
0 |
0.67 |
0.75 |
0.52 |
0 |
-2.53 |
|
Haughey 4 & Reynolds 1 |
Ireland |
2 |
0 |
1 |
0.67 |
0.75 |
1 |
0 |
-1.58 |
|
Reynolds 2 |
Ireland |
2 |
0 |
1 |
0.33 |
0.75 |
1 |
0 |
1.8 |
|
Lubbers 2 |
Netherlands |
3 |
0 |
0 |
0.67 |
0.75 |
1 |
0.45 |
2.83 |
|
Lubbers 3 |
Netherlands |
3 |
0 |
0 |
0.33 |
0.75 |
1 |
0.33 |
2.85 |
Table 1: Quantitative data with numerical and textual values (from VIS 2012, Web appendix, adapted with permission)1) [5]
VIS (2011, 2012) investigated the conditions under which governments increase spending on active labor market policies. She analyzed 53 governments between 1985 and 2003 using fuzzy-set qualitative comparative analysis (fsQCA; RAGIN, 2000). In Table 1, a small portion of the data in the VIS (2012) web appendix is displayed. [6]
Does Table 1 contain quantitative data, qualitative data, or both? The answer depends on how we treat them. Reading Table 1 aloud reveals that it consists of words and numbers. Various authors have associated numbers with quantitative data and words with qualitative data (BAZELEY, 2018a; GREENE, CARACELLI & GRAHAM, 1989; MILES & HUBERMAN, 1994; see also HAMMERSLEY, 1996; MORGAN, 2018). Similarly, words have been called "experience-qualitized," and numbers have been called "experience-quantitized" by SANDELOWSKI et al. (2009, p.209). All this suggests that Table 1 includes both qualitative and quantitative data. [7]
However, when we equate words with qualitative data and numbers with quantitative data we contradict the idea that we cannot determine whether data are quantitative or qualitative without considering their contexts (ibid.). I interpret this to mean that, depending on the context, words could potentially be quantitative data, and numbers could be qualitative data. Looking at Table 1, we notice an important characteristic that may affect whether the data should be considered qualitative or quantitative: It has a structure. Words and numbers in Table 1 are categorized into 10 columns. Eight of the columns contain one number per line, one column contains one word, and another column contains one word followed by one number. Lines 2-7 are actually six rows where words and numbers are displayed in a fixed order, and the first row (Line 1), which consists solely of words, is a header row. [8]
In this section, I will explore the numerical data in Table 1, Columns 6-10, and argue that they are quantitative. I start by observing that these columns contain discrete and distinct objects (MARTIN & LYNCH, 2009). Each object is placed into a separate cell, and there is no overlap between the cells. These objects were constructed, like all quantitative data, through classification and categorization (SANDELOWSKI et al., 2009). Thus, in Table 1 Column Unem, object 0.83 in Row Kohl 3, object 0.67 in Row Kohl 4, and object 0.67 in Row Haughey 4 & Reynolds 1 are all instances of the category Unem, or level of unemployment. To use the standard terms of quantitative research, all are values of the variable Unem. Without such embedding, 0.83 is merely a number. Once embedded, it becomes the value of Unem for Kohl 3. [9]
Quantitative data values do not include the semantic content of what was measured (WITT, 2001). This semantic content should be added afterward by the reader or user. To interpret a value, we must know to which variable it belongs. Thus, to interpret the value 0.83 in Table 1, we must know that it is situated at the intersection of Row Kohl 3 and Column Unem and that it indicates that the level of unemployment during Government-Kohl 3 was high. In Columns 6-10, such statements are represented as numbers, which aligns with another characteristic of quantitative data: They can be represented as numbers (WITT, 2001). Lastly, when we consider how quantitative data are constructed, we see that they are highly condensed: Unemployment during the government of Kohl 3 is summarized into one number: 0.83. According to the above criteria, the data in Columns 6-10 are quantitative: They consist of discrete and distinct objects with no overlap; are the result of strong condensation; are presented in a structure as values of variables, that is, non-overlapping categories; and can be (and in Columns 6-10 are) represented as numbers. [10]
Further, these data share another important characteristic: They can be analyzed using a specific type of methods, commonly called quantitative methods of data analysis. A varied range of quantitative methods of data analysis exists. Table 1 was used in an fsQCA to investigate various routes of influence on the change in spending on active labor market policies, the dependent variable Act in VIS (2012). FsQCA is a case-oriented quantitative analysis in which cases (here, governments) are allocated to specific paths (RAGIN, 1997). We could also analyze the data in Table 1 using cluster analysis, another case-based approach, to identify clusters of governments resembling one another. Alternatively, we could perform a variable-oriented analysis of these data and calculate, for instance, each variable's mean, median, and variance. A variable-oriented regression analysis could be used to calculate how each variable, alone, and in interaction, influences the change in active spending per unemployed person (for a comparison of fsQCA and regression analysis, see VIS, 2012). If we had sufficient data, we could take the clustering of the governments into countries into account by performing a multilevel regression analysis. Thus, although different analyses could be applied to the numerical data in Table 1, they all have something in common: Each number in each cell is treated as a value of a specific variable. This characteristic is shared by all quantitative methods of data analysis. [11]
3. An Extension: Textual Values as Quantitative Data
Are the values in Table 1 for the country variable Germany, Ireland, and Netherlands qualitative or quantitative? According to the words/numbers dichotomy, the answer would be qualitative. However, as is already implied by the terms variable and values, my answer would be quantitative. Similar to the numbers in Table 1, these three country names are categorized into a larger country category, which does not overlap with the other categories. Similar to the numbers, each value neatly fits into the table, with one value in each cell. Each value for the country variable is distinct and discrete. It is not represented by a number, but it could be, as shown in Column CNr (Country Number). An alternative numerical representation is found in Columns GER and IRE, in which a value of 1 indicates the presence of Germany and the presence of Ireland, respectively, and a value of 0 indicates the absence of Germany and the absence of Ireland, respectively, a standard procedure called dummy coding (FIELD, 2009). [12]
Changing textual labels into numbers, and vice versa, does not alter the nature of these variables. Both the textual values of the variable country and the numerical values of the variables country number, GER, and IRE are quantitative data. They are distinct and discrete, are categorized into non-overlapping categories, and can be represented in a matrix or table. Thus, WITT (2001) correctly wrote that quantitative data can be represented (rather than are represented) as numbers. Moreover, changing textual labels into numbers does not change the types of analysis that can be performed with these data, nor does it change their outcomes. Thus, whether we count countries using the country variable or the country number variable, the outcome is the same: Each country occurs twice. With sufficient data, we could perform a multilevel regression analysis using the countries as clusters. Again, the outcome would be the same whether we used the country, country number, or GER and IRE variables. [13]
Variables such as country, whether in their textual or numerical form, are called nominal variables (FIELD, 2009). Their values cannot be ordered. In Table 1, Germany is not higher, better, or bigger than Ireland or the Netherlands. All three textual labels indicate the presence of a specific country—nothing more. By contrast, the values of the numerical variables in Columns 7-12 can be ordered. That is, 18.22 is a larger change in active spending per unemployed person than 2.85, which is larger than 1.58. Such variables are called continuous variables (FIELD, 2009). [14]
This difference between categorical and continuous variables has wide-ranging and well-known implications for the type of calculations that can be meaningfully performed. Whereas we can establish a rank order of changes in spending between the countries or calculate the mean spending for this continuous variable, we cannot do this for the countries. Thus, the mean value of the variable country number (2) does not have a meaningful interpretation. However, we can meaningfully ask how frequent each value of the country number variable is, the answer being that each of the values 1, 2, and 3 occurs twice. We can do this because the nominal variables, as quantitative data, are still condensed, discrete, distinct, categorized, and structured. As a result, there is no overlap between Germany and Ireland, and Germany in Row 1 has the same condensed meaning as Germany in Row 2. All of this allows us to calculate how the six governments are divided over the three countries. Thus, a final distinguishing feature of quantitative data is that we can perform numerical calculations that make sense—although not all possible calculations make sense with all types of quantitative data. With respect to this feature, quantitative and qualitative data are different, as will be discussed below. [15]
As noted earlier, various authors have challenged the distinction between quantitative and qualitative data (BAZELEY, 2018a; SANDELOWSKI et al., 2009; VOGL, in press). SANDELOWSKI (2014) argued that a questionnaire cannot be easily categorized as quantitative because it can be used in many different ways, some of which would not qualify as quantitative:
"The idea, for example, that the closed-ended and highly structured questionnaire constitutes a QN element and the open-ended minimally structured interview a QL element effaces the countless variations in how questionnaires and interviews may be conceived, developed, conducted, or administered, in the purposes they are intended to fulfill, and in the way questionnaire and interview data may be analyzed, interpreted, and represented. [...] Questionnaire items may be used as elicitation devices in narrative interviewing. Responses to both open- and closed-ended data collection devices may be analyzed via a range of diverse approaches, including varieties of content, narrative, conversation, and statistical analyses" (pp.5f.). [16]
My view, however, is different. In the previous section, I argued that quantitative data can only be analyzed using quantitative methods, which are applied to data consisting of variables and their values. If we use questionnaire items as elicitation devices in narrative interviews, we do not analyze these quantitative data using a qualitative analysis method. Instead, we use the items to collect new data. Using quantitative items as input in a procedure aimed at collecting qualitative data is not an argument against calling these items quantitative data. The decisive criterion is that the quantitative items can only be analyzed using quantitative methods. [17]
Similarly, the fact that "responses to [...] closed-ended data collection devices may be analyzed via [emphasis added] narrative or conversation analyses" does not constitute proof that these closed-ended data are not quantitative. My point is that closed-ended data cannot be analyzed by using qualitative methods directly. Yes, we can construct profiles by analyzing closed-ended data with cluster analysis. Yes, we can analyze descriptions of cluster profiles with narrative analysis. However, what is analyzed using such narrative analysis is the description of the profile as a new piece of data, not the original quantitative data. Thus, in my view, SANDELOWSKI rightly drew attention to the ubiquity of transformations and conversions of all types of data in research. However, in my view, such transformations are not an argument against the distinction between qualitative and quantitative data, because each dataset can only be analyzed using methods of its own type. [18]
In summary, quantitative data are condensed, distinct, discrete, and categorized into non-overlapping categories, and they can be represented as numbers in a structured table or matrix. Such data can be analyzed only through numerical calculations, which are commonly called quantitative data analysis methods. [19]
It is now time to turn to qualitative data. As an example, I consider SHAW et al.'s (2013) evaluation of an intervention to improve colorectal cancer screening rates at 12 primary care practices in New Jersey (USA). The researchers observed the intervention's facilitated team meetings and learning collaboratives. In their methods section, SHAW et al. described their qualitative data and data analysis methods as follows:
"Qualitative data included MAP [multimethod assessment process] field notes and audio-taped RAP [reflective adaptive process] and learning collaborative meetings. Field notes of RAP meetings and learning collaboratives were written to capture elements not available from audio-recordings, such as group dynamics [...]. An immersion/crystallization technique was used to analyze the qualitative data. Descriptive case summaries were written for each practice and discussed in detail with the coauthors to identify initial patterns and themes. During this analytic process, 6 characteristics emerged as key contributing factors for the teams' QI implementation" (p.222). [20]
SHAW et al. used a multistep qualitative analysis consisting of two types of qualitative data and two qualitative data analysis methods. In the first step, qualitative data in the form of audio tapes and field notes from MAP and RAP meetings were analyzed using an immersion/crystallization analysis, resulting in case summaries. Next, the case summaries were analyzed through a detailed discussion with the coauthors to identify patterns, themes, and, lastly, six characteristics. SHAW et al. did not explain the type of data making up the case summaries, but we can see that they are qualitative when we examine one paragraph from their case summary of Practice 10:
"This practice held 8 RAP meetings and had a consistent team of 6 members. As evidence of their strong communication, in an early RAP meeting, the team decided on a plan to distribute all ideas, decisions, or action plans to the entire practice for input and feedback. The team took a democratic decision-making approach: they brainstormed a list of areas for improvement, which was then distributed to all practice members for a vote on what to focus on first. The top choice was to address 'chaos' in the practice, which was articulated as various kinds of interruptions, trying to address multiple patient problems in a single 15-minute visit, and confusion or miscommunication that occurred among support staff. There was some evidence that the lead physician was not in favor of focusing on these issues but did not obstruct the dialogue. Although subsequent RAP meetings entailed team discussion on their communication and working relationship issues, they simultaneously worked on implementing other plans to improve work flow at the front office and update an unused flow sheet and mammogram referral sheet. During the intervention time frame, the team spent little time working directly on anything CRC [colorectal cancer] related" (Supplemental Appendix 2). [21]
These case summaries are not quantitative data. Their inner structure is not that of a table; we do not see any categorization or non-overlapping categories. Although numbers are used, they do not represent values of variables: RAP meetings in "8 RAP meetings" is not a variable, and neither is minute in "a 15-minute visit." In addition, the level of condensation in the case summary is much lower than that of the quantitative Table 1. Instead of non-overlapping values of non-overlapping variables, we see many constructs that are connected and rich in meaning. According to WITT (2001), qualitative data contain much more detail than quantitative data and are closer to everyday life. Instead of describing characteristics, the authors of this case summary describe what happened. [22]
Unlike the word labels in Table 2, we could not convert the text of the case summary into numbers and analyze the numbers statistically. Indeed, the case summaries were "discussed in detail with the coauthors" (SHAW et al., 2013, p.222), which is a qualitative method of data analysis. This analysis is not a calculation; it is applied directly to the qualitative case summaries and not to a structured table derived from the case summaries. [23]
In the previous two paragraphs, I have mainly explained why the case summaries are not quantitative data. Negatively defined, qualitative data are unstructured data that cannot be subjected to quantitative data analysis. Defining what qualitative data share is more difficult for reasons that will become clearer in the next section. One reason is that qualitative data can have many different structures. SHAW et al.'s qualitative data consisted of field notes, audiotaped meetings, and case summaries. Case summaries have a text structure that audiotaped meetings do not possess. [24]
5. Transforming Data in Mixed Methods Research
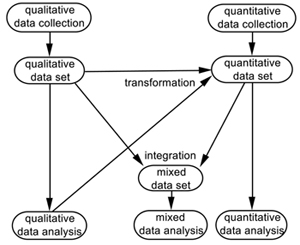
Figure 1: From data collection to data analysis in mixed methods research via transformation and integration [25]
Figure 1 provides an overview of how data are used in mixed methods research that aligns with our argument in the previous sections. Qualitative datasets can only be subjected to qualitative analysis, whereas quantitative datasets can only be subjected to quantitative analysis. New in Figure 1 is that quantitative and qualitative datasets are connected. They can be integrated into a mixed dataset, which can be subjected to mixed data analysis; such integration will be the topic of Section 6. In this section, I will discuss the other connecting process in Figure 1: transformation. Figure 1 shows that qualitative data can be transformed into qualitative data. Consequently, in a mixed methods study, quantitative data can be obtained in three different ways (Figure 2):
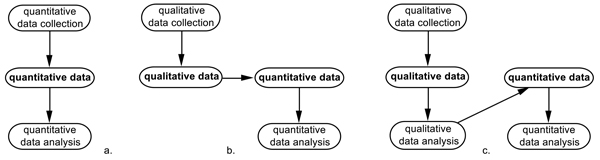
Figure 2: Obtaining and analyzing quantitative data in mixed methods research: a. direct quantitative data collection; b.
transforming qualitative data into quantitative data through coding; c. obtaining quantitative data through analyzing qualitative
data. [26]
In Figure 2c, qualitative data are obtained through qualitative data collection and subsequently analyzed through qualitative data analysis, which results in quantitative data. An example of this process is presented in Table 2.

Table 2: A table containing textual and numerical quantitative data (from SHAW et al. 2013, p.225, reprinted with permission)2). Click here to download the PDF file. [27]
In Columns 2-7 of Table 2, SHAW et al. (2013) presented quantitative data (the six practice characteristics) that resulted from the qualitative data analysis (the detailed discussion) of each practice's qualitative case summary. The textual values weak, moderate, and strong have all the characteristics of quantitative data: They are condensed, discrete, distinct, categorized in non-overlapping categories, and represented in a table. These textual variables form ordinal data (FIELD, 2009) because their values can be meaningfully ordered: Strong is stronger than moderate, and moderate is stronger than weak. Similar to nominal and continuous data, ordinal data can be analyzed using quantitative methods only. We could count, for instance, how many practices have strong leadership (there are two). [28]
The last two columns of Table 2 contain quantitative data obtained directly through quantitative data collection (Figure 2a). In addition to their qualitative data, SHAW et al. (2013) collected quantitative data before and after the intervention. Based on information in medical records, they calculated colorectal cancer screening rates by comparing the number of patients for whom the practice met the screening guidelines and who should have received screening to the number of patients who actually received appropriate screening. [29]
Thus, Table 2 contains quantitative data obtained in fundamentally different ways. The quantitative data on the screening rates were collected as quantitative data (Figure 2a). The quantitative data on the six practice characteristics were obtained through qualitative data analysis of the case summaries (Figure 2c). Consequently, the perhaps surprising conclusion is that qualitative data analysis of qualitative data can result in quantitative data. [30]
We can now look at the process through which qualitative data analysis leads to quantitative data in more detail. When we compare Table 2 with the case summary for practice P10 mentioned earlier, we can understand how a detailed discussion may have resulted in textual values. For instance, "the team decided on a plan to distribute all ideas, decisions, or action plans to the entire practice for input and feedback" is described in the case summary as "evidence of strong communication," which is visible in Table 2 as the value strong for the variable intercommunication. "The team took a democratic decision-making approach" may have been taken as evidence of strong intra-communication. In Table 2, leadership is valued as moderate, which is indicated in the text as "evidence that the lead physician was not in favor of focusing on these issues but did not obstruct the dialogue." Engagement is valued as moderate, and the case summary indicated that "the team spent little time working directly on anything CRC-related." [31]
The process through which this qualitative analysis leads to quantitative data includes various steps. As a first step, condensed codes are created, such as intercommunication, intracommunication, leadership, team structure, engagement, and psychological safety, together with possible values such as weak, moderate, and strong. Such codes are condensed entities because one instance of the intercommunication code is assumed to have the same condensed meaning as another instance of the intercommunication code. In addition to being condensed, these codes are also distinct entities because leadership is different from team structure, and weak is different from strong. However, a case summary that has been coded with such codes does not consist of quantitative data, because the summary still lacks a tabular structure and includes various types of overlap. Thus, the same text fragment could still be coded as being about leadership and team structure. We can also have different evaluations within the case summary, with some sentences indicating weak leadership and others indicating strong leadership. Thus, even after coding, the case summaries are still qualitative data, and we cannot analyze them using a quantitative analysis method. [32]
The crucial step in turning the codes and their values into quantitative data is to separate them from the text and store them in a table (here, Table 2). Once separated from the text, the values weak, moderate, and strong acquire an independent existence. They become distinct, discrete, mutually exclusive, categorized, and structured. In Table 2, all overlaps have been removed, and all within-case contradictions: Each practice is assigned only one value for each characteristic. In Table 2, the values weak, moderate, and strong are values of variables, namely the six practice characteristics. These values can be used in various quantitative analyses, for example, in counting the number of teams with a strong, moderate, or weak value for each characteristic or in a cluster analysis that results in various practice profiles. Given that the values weak, moderate, and strong, in contrast to nominal variables, can be ranked, we could rank practices based on their scores. All such quantitative analyses are possible because, in Table 2, the codes have been transformed into quantitative data. [33]
SHAW et al. (2013) used a two-step summarizing analysis process. First, qualitative field notes and audiotaped meetings were condensed into qualitative case summaries. Subsequently, the qualitative case summaries were reduced into six quantitative practice characteristics. Through such multistep summarizing analysis processes it becomes evident why qualitative data can be so different. The possibilities for summarizing qualitative data are much more varied than they are for quantitative data for two reasons. First, there are many ways in which qualitative data can be unstructured, and thus many possible types of qualitative data. Conversely, quantitative data all have the same structure: They consist of variables and their values. Second, because quantitative data are more condensed than qualitative data, they are necessarily a last step of summarization: We can condense qualitative data into other qualitative data or into quantitative data, but we can condense quantitative data only into other quantitative data but not into qualitative data (WITT, 2001). [34]
The quantitative data in Table 2 are the result of a transformation process that is complete. Qualitative data were analyzed and turned into ordinal quantitative data. These ordinal quantitative data are indistinguishable from ordinal quantitative data obtained directly through quantitative data collection. The completeness of the transformation process is an important argument against distinguishing hybrid data, which some authors have proposed. For example, SANDELOWSKI (2014, p.5) stated that "data are neither QL nor QN, but rather aspects of experiences or phenomena transformed into words, numbers, visual forms, and the like, each of which may, in turn, be transformed again into other forms." Apparently, SANDELOWSKI viewed the existence of transformations as an argument against the distinction between qualitative and quantitative data. [35]
Upon reflection, however, the transformation argument is somewhat odd. In many other realms of life, the possibilities of transformation are not used as an argument against distinguishing the transformed elements. A healthy person can become ill and then become healthy again. This transformation does not imply that distinguishing between illness and health is impossible or useless. Similarly, water transforms into ice, given the right combination of temperature and pressure, but it still makes sense to distinguish water from ice. Therefore, I do not consider the possibility of transformations to be a convincing argument against the existence of qualitative and quantitative data. [36]
Other authors have called the quantitized qualitative data in Table 2 hybrid data. According to WITT (2001, §4), "Mixed forms come into being when qualitative data are subsequently quantified, a process in which they lose part of their meanings and are transferred into a more abstract form" (my translation). This statement implies that quantitized qualitative data are still more qualitative than collected quantitative data ("part of their meanings" and "more abstract"). However, my analysis of Table 2 shows that this is not true. Quantitized qualitative data meet all criteria for quantitative data: They are condensed, discrete, distinct, can be represented as numbers, are values of variables, and can be analyzed using quantitative methods only. In short, quantitized qualitative data are quantitative data. [37]
By referring to such quantitized qualitative data as quantitative data, I am not only indicating that they are indistinguishable from quantitative data obtained through quantitative data collection. I also suggest that we name data after their characteristics as end products, not after the methods through which they came into being. My viewpoint differs, for instance, from that of SANDELOWSKI (2014), who made the case that creating quantitative data often involves quantitizing qualitative entities. Our making of observations and categorizing them using a checklist can be called a form of quantitizing qualitative data. Similarly, answering a questionnaire can be called quantitizing our qualitative thoughts. I have no objections to this view. However, the status of the resulting data is determined by their properties and not by the transformation process. When the qualitative thoughts are transformed into answers to questions ranging from strongly disagree to strongly agree, then each question is a variable, each answer is a value, and the data are quantitative. Further, if we use an observation checklist to structure our textual observation notes, the resulting data are still qualitative. [38]
My view also differs from that of GUETTERMAN, FETTERS, and CRESWELL (2015), who presented Table 2 as an example of a joint display, which is defined, in their article, as a "table or figure [...] that simultaneously arrays the quantitative and qua[l]itative results" (p.555) of a mixed methods study. Thus, in Table 2, "The columns [...] displayed the qualitatively derived [emphasis added] QI [quality improvement] implementation characteristics next to the quantitative colorectal cancer screening rates at baseline and 12 months" (p.558). My point is that although these quantitative data had been derived from qualitative data analysis, the data themselves, as end products, are quantitative. [39]
Thus, Figure 2 shows that the transformation process from qualitative to quantitative data in Table 2 is complete, implying that we do not have to assume hybrid data, and that qualitative data analysis of qualitative data can result in quantitative data. In addition, we observe in Figures 2b and 2c that mixed methods research can, but need not, include quantitative data collection, contrary to a common definition (BRYMAN, 2006; CRESWELL & PLANO CLARK, 2018). A study without quantitative data collection that follows one of the patterns in Figures 2b or 2c could still be called a mixed methods study because it includes both qualitative and quantitative data. [40]
Figure 2 displays the transformation of qualitative data into quantitative data, but not of qualitative data into quantitative data, a process commonly called qualitizing (NZABONIMPA, 2018; ONWUEGBUZIE & LEECH, 2019; SANDELOWSKI, 2014). Qualitizing is also implied in the previous quotation by SANDELOWSKI (2014, p.6): "Questionnaire items may be used as elicitation devices in narrative interviewing. Responses to both open- and closed-ended data collection devices may be analyzed via a range of diverse approaches, including varieties of content, narrative, conversation, and statistical analyses." However, in my opinion, using questionnaire items as elicitation devices in narrative interviewing does not transform these quantitative data into qualitative data but instead uses these quantitative data to collect new qualitative data. Further, analyzing responses to closed-ended data collection devices via content, narrative, or conversation analysis can only be done by collecting new qualitative data based on the closed-ended quantitative data. For instance, quantitative cluster analysis can result in groupings. However, to interpret these groupings and create profiles, additional information is needed that is not in the quantitative data, which are highly condensed. In subsequently analyzing such profile descriptions, we do not analyze qualitized quantitative data; rather, we analyze these profile descriptions as new data. [41]
6. Integrating Data: The Mixed Dataset
In this section, I focus on the second characteristic of mixed methods research in Figure 1—data integration—that is, bringing together data from different datasets into a new dataset. Figure 3 shows two different types of integration that occur regularly in mixed methods research.
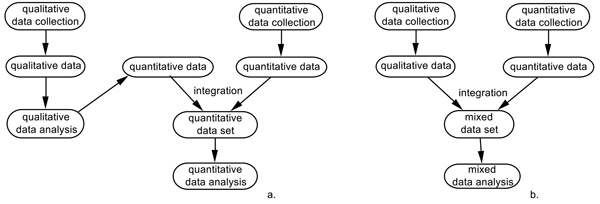
Figure 3: Integrating datasets in mixed methods research: a. Integrating quantitized qualitative and quantitative data into
a quantitative dataset; b. integrating qualitative and quantitative data into a mixed dataset [42]
In Figure 3a, the integration that resulted in Table 2 is displayed. The quantitative data on the screening rates (obtained by quantitative data collection) were integrated with the qualitatively derived quantitative data on the practice characteristics, resulting in a quantitative dataset. Similar to all quantitative datasets, the dataset in Table 2 can only be subjected to quantitative data analysis. Such a quantitative data analysis was performed by SCHOONENBOOM and JOHNSON 2021, who used Table 2 to develop a counterintuitive hypothesis: "[i]t appears that, in general, the highest raise [sic] in screening rates are found in practices that have only weak or moderate leadership, psychological safety, engagement, and intracommunication" (p.282). [43]
In contrast to an integrated quantitative dataset (Figure 3a), a mixed dataset (Figure 3b) consists of both quantitative and qualitative data for each unit of observation (in the social sciences, this is often a person, but many other units of observation are possible). One or more columns of a mixed table contain quantitative data (either numerical values or textual labels) obtained by either collecting quantitative data or by quantitizing qualitative data. At least one other column contains qualitative data, most typically text fragments. Creating a mixed dataset is also called data consolidation (CARACELLI & GREENE, 1993; VOGL, 2019). [44]
The use of a mixed table is described by SCHOONENBOOM (2023):
"Schoonenboom and Johnson (2021) took quantitative and qualitative data published in Lee and Greene (2007), a study on the relationships between language problems of international students and their grade point average (GPA) in their first semester at one university in the US. Schoonenboom and Johnson (2021) created a simple table, containing one record for each student along their language score, their GPA, and a quote from their interview, which could then be sorted and resorted to uncover patterns. One specific group of four students emerged: Despite their language problems, members of this group still obtained the highest GPA." [45]
This mixed table is shown below as Table 3.
|
ID |
C |
GPA |
Quotation |
|
0607 |
4 |
4.00 |
I do not have any language problems. |
|
2020 |
3 |
4.00 |
I understand 80% of the lectures. Careful reading complements 20% of lack of understanding. |
|
1315 |
3 |
4.00 |
My biggest problem is related with speaking in English. I will get a good grade because my mathematical background is strong. |
|
0609 |
3 |
4.00 |
The professor is old so that his pronunciation is not clear. He usually handed out important contents and I could understand it by reading the textbook. |
|
0620 |
2 |
4.00 |
I understand only 60-70% of the lectures. It has made my scores less than my expectation. |
|
1310 |
3 |
3.89 |
I want to participate and argue the subject. But I cannot find myself enough. This does not affect my grade. |
|
0624 |
2 |
3.80 |
It is easy to understand the lectures and participate in class discussions. The instructor speaks slowly. |
|
2036 |
3 |
3.57 |
The major problem is speaking. I spoke once or twice during the whole semester. |
|
0610 |
3 |
3.53 |
Listening is a problem. Lack of cultural knowledge interferes with understanding the concept. |
|
0605 |
2 |
3.50 |
Because of my poor listening, I am struggling with catching up with my content courses. |
|
0603 |
3 |
3.39 |
I still have some problem in speaking. This difficulty doesn’t affect my ability to do well in all the courses I take. |
|
2037 |
2 |
3.22 |
Lack of knowledge about idiomatic expressions prevents me from understanding questions on the homework assignment. |
|
2025 |
3 |
3.18 |
I was not able to finish all the reading assignments every week. |
|
2031 |
3 |
3.11 |
I have problems with my hearing and how to speak correctly. |
|
0608 |
4 |
2.89 |
I understand almost 100% of the lectures. I understand the professor completely. […] Grades are not important. That is the least of my worries. […] |
Table 3: A mixed table containing both quantitative and qualitative data (from SCHOONENBOOM and JOHNSON 2021, p. 278, adapted with permission)3) [46]
The data in Columns C and GPA are undeniably quantitative. These data are condensed, and the meaning of the values cannot be understood without knowing the variables to which they belong. They are discrete; for example, GPA 3.39 is a value different from GPA 4.00, which is different from GPA 3.57. There is no overlap between these values. Each identical value has the same condensed meaning: C 3 for student 0609 has the same meaning as C 3 for student 0610. These quantitative data are continuous; each value is a position on a scale such that 3.57 is higher than 3.11. We could meaningfully calculate their mean and variance or perform a regression analysis to determine whether the CEEPT test score influences GPA—which is what LEE and GREENE (2007) did using data from 100 international students. Note also that the CEEPT score has only three possible values—2, 3, and 4 (students with scores of 1 were not admitted)—making it useful to count how often each score occurs, something that would not make sense with the fine-grained GPA score. [47]
What about the data in the Column Quotation? Are they quantitative data? Are these data the values of a variable quotation? Here, the answer must be no. Values such as 1.83 or moderate can only be interpreted when we know the variable to which they belong. Conversely, although much of the context is missing, we can still understand the quotations on their own; the presence or absence of the heading Quotation does not make much of a difference. These data are also much richer and more complex than quantitative data; they do not contain one value but many. As statements, rather than numbers or labels, they convey rich meanings. They differ from both continuous and nominal variables. They differ from continuous variables because they do not represent positions on a scale. Although we could order Table 3 using GPA from high to low and obtain something sensible, ordering the quotations alphabetically has no meaning. The quotation data also differ from nominal data or ordinal data. It makes sense to ask how many students obtained each CEEPT value, because we can use this information to determine the variance in the group to identify extreme values. Asking the same question regarding the quotations would not make sense. Each quotation is unique; therefore, the frequency of each quotation would be one. If two quotations proved to be the same, this would be a rare coincidence rather than being baked into the system. [48]
Therefore, the Column Quotation in Table 3 contains qualitative data. Although they are, at first sight, similar and have both been classified as joint displays, Tables 2 and 3 are fundamentally different. I explained previously that Table 2 can only be subjected to quantitative analysis because both the CRC ratings and the six characteristics are quantitative data. Given that Table 3 contains both qualitative and quantitative data, we could analyze its quantitative data using quantitative methods or its qualitative data using qualitative methods of data analysis. However, we only capitalize on its strength when we jointly analyze its quantitative and quantitative data via a mixed analysis. [49]
Table 3 is a case comparison table; the corresponding method of data analysis is described in detail in SCHOONENBOOM and JOHNSON (2021). The first step in a case comparison table analysis is to create initial groups with different combinations of values for the quantitative variables. Table 3 contains four groups: 1. one student (ID0607) who has no language problems and the highest possible GPA; 2. one student who has no language problems but a low, actually the lowest, GPA (ID0608); 3. four students with language problems (C < 4) and nevertheless the highest possible GPA (those presented in bold); and 4. a remaining group of students with language problems and GPA's that are not the highest possible (GPA < 4.00). The analysis can be classified as mixed when we ask the following questions: Could we use the qualitative data to either confirm or adapt these groups, and more importantly, could we find experiences in the qualitative data that are related to and, perhaps, could even explain the differences between the four quantitative groups? Upon reflection, three of the students in bold, who had the highest possible GPA despite having language problems, referred to both their language problems and to compensation strategies: careful reading (ID 2020), a strong mathematical background (ID 1315), and reading the textbook (ID 0609). Such compensation strategies were not mentioned by any of the less successful students. SCHOONENBOOM and JOHNSON interpreted this outcome as a confirmation of the four groups and, more importantly, formulated a preliminary hypothesis: Language problems affect students' grade point averages at one US university, except for students who had developed compensation strategies. [50]
7. Implications for Mixed Methods Practice
In this article, I have argued that qualitative and quantitative data are fundamentally different. Quantitative data are condensed, distinct, and discrete and can be represented as numbers in a table or matrix containing non-overlapping variables and their values. By contrast, qualitative data do not have a table or list structure and do not consist of non-overlapping variables and their values. Qualitative data can have various structures, for instance, the structure of a text, with words forming sentences. Qualitative data can be coded, but such codes can overlap in position and/or meaning. They can be analyzed with qualitative but not quantitative methods. For example, listing each sentence of a text in a table and performing calculations would either be impossible (regression analysis) or meaningless (counting the occurrence of each sentence). Compared to quantitative data, qualitative data have rich and varied meanings. For instance, whereas the condensed value moderate for the quantitative variable leadership means the same for each practice to which it is attached (Table 2), the instances of moderate leadership in the textual summaries show very different processes. In Practice 10, "[t]here was some evidence that the lead physician was not in favor of focusing on these issues but did not obstruct the dialogue" (SHAW et al., 2013, Supplemental Appendix 2), whereas in Practice 2, "[t]he lead physician attended meetings regularly ... was instrumental in their team development," while at the same time "the team had difficulty keeping on track during meetings" (Supplemental Appendix 1). [51]
I have argued that qualitative and quantitative data should be distinguished in mixed methods research because they are connected to different methods of data analysis. Qualitative data can be analyzed with qualitative methods of data analysis and quantitative data with quantitative methods of data analysis. Consequently, we will have to revise the concept of crossover analysis, in which one type of analysis is used to analyze the other type of data (BERNARD, 1996; COMBS & ONWUEGBUZIE, 2010; ONWUEGBUZIE & JOHNSON, 2021). In my view, this is not possible. Thus, in my definition, "using regression to analyze interview transcripts" (SMALL, 2011, p.60) is impossible, as is the "Exploratory Factor Analysis of Text" (VAN HANEGHAN, 2021) or the "Multidimensional Scaling of Qualitative Data" (SUERDEM, 2021). [52]
My objection, of course, does not apply to the analyses themselves but, instead, to how they are named and conceptualized. By using these titles, the authors suggest that quantitative data analysis methods can be applied directly to qualitative data, which is clearly impossible. Consequently, they hide the complex processes through which qualitative data are used to generate quantitative data. The authors explain these transformation procedures in their chapters, but this does not remove this first misleading impression. [53]
When we say that we analyze qualitative data with a quantitative method of data analysis, we actually analyze a different quantitative dataset, which is related to, but in no way identical to, the qualitative dataset on which it is based. Therefore, such analyses should not be called "mixed" (as in HITCHCOCK & ONWUEGBUZIE, 2020, p.67) but, rather, quantitative. As elsewhere, quantitative analyses used to analyze quantitized qualitative data must still meet their quantitative assumptions. Again, calling such analyses quantitative enables us to distinguish them from real mixed analysis, as in Example 2, in which quantitative and qualitative data are analyzed jointly. [54]
Thus, the formula in ONWUEGBUZIE and JOHNSON (2021, p.2)4) should be rewritten for three reasons: It is impossible to perform a quantitative analysis of qualitative data, it is impossible to perform a qualitative analysis of quantitative data, and an analysis of qualitative and quantitative data jointly is a mixed analysis, which fundamentally differs from both qualitative and quantitative methods of data analysis. Further, the possible roles of quantitative and qualitative data in mixed methods research are different. In quantitative analysis, however sophisticated, all the effects and patterns we discover are necessarily bound to the existing variables and their values; they are all we have. Conversely, qualitative analysis can be used to discover new characteristics that are hidden in the qualitative data. This difference is visible in the examples. Superficially, Tables 1, 2, and 3 look similar: All three contain columns with numbers and columns with words. However, as we have seen, Table 1 and the joint display Table 2 contain quantitative data only, whereas the case comparison Table 3 includes both quantitative and qualitative data. Consequently, these tables differ in their possibilities for analysis. The structured data in Tables 1 and 2 can be analyzed with quantitative data analysis methods only, either a variable-oriented approach, such as a frequency count or a regression analysis, or a case-oriented approach, such as QCA or a cluster analysis. Therefore, all outcomes in Tables 1 and 2 are necessarily restricted to the variables, as is visible in the causal pattern "~unem*open + ~unem*~corp*left + ~unem*corp*~left → act," VIS's (2012, p.187) result of analyzing Table 1 using an fsQCA. Only specific combinations of the existing variables unemployment level, corporatism, openness, and leftist orientation increased spending on active labor market policies, which is, itself, also an existing variable. Conversely, SCHOONENBOOM and JOHNSON (2021)'s case comparison analysis of mixed Table 3 revealed a new characteristic hidden in the interview quotations: the importance of compensation strategies. After grouping the quotations using the quantitative data, they were able to compare qualitative quotations from individuals with similar quantitative characteristics. [55]
In Sections 5 and 6, I explored the transformation and integration processes in mixed methods research. In Section 5 on transformation, I argued that we can quantitize qualitative data, but we cannot qualitize quantitative data, something already noted by WITT (2001). What appears to be qualitizing quantitative data turns out to be the use of quantitative data to collect new data, for instance, by using the quantitative data in an interview or by interpreting groupings that result from quantitative data analysis together with other information that is not in the quantitative data. Creating quantitative data from qualitative data is a complex process that is fraught with difficulties. As emphasized by SANDELOWSKI et al. (2009, p.213), following MARTIN (2004, p.939), creating quantitative data from qualitative data is a "disciplinary technology" through which researchers make the variables discrete, distinct, and non-overlapping. In this process, much is lost, for example, the varying practices behind the label moderate in Table 2. This raises questions about the validity of the outcomes of quantitative analysis that is based on quantitized qualitative data. Mixed methods researchers should always consider whether it is justified to ignore differences such as those between the practices in Table 2 in their quantitative analyses. In this respect, researchers may benefit from research traditions in new materialism, in which researchers rebuild the worlds from which research data and outcomes have been generated (FOX & ALLDRED, 2017; LATOUR & WOOLGAR, 1986; SCHADLER, 2019; UPRICHARD & DAWNEY, 2019). In Section 6, regarding integration, I explored two types of data integration and their consequences for data analysis. Integrating quantitative and quantitized qualitative (and hence quantitative) data results in a quantitative integrated dataset that can only be subjected to quantitative data analysis. By contrast, integrating quantitative and qualitative data results in a mixed dataset, which can be subjected to mixed analysis (Figure 3). [56]
My explorations have consequences for how we consider mixed methods research. We could start by defining a mixed methods study as a study in which both qualitative and quantitative data are used. This definition includes mixed methods studies without quantitative data collection, because we can obtain quantitative data by transforming qualitative data. Thus, we could call a study that includes quantitative and qualitative data a mixed methods study. This does not mean, however, that we should do so. Rather than identifying a study as a whole as a qualitative, quantitative, or mixed methods study, I have shown the importance of identifying the transformation and integration processes within the study. Researchers should identify the different types of data obtained throughout their studies, with their different possibilities and impossibilities for data analysis. It is also important to differentiate between different forms of integrated datasets (see Figure 3) because different types of integrated datasets can be subjected to different forms of data analysis. [57]
Researchers who use qualitative and quantitative data in one study can have different reasons for calling their study a mixed methods study or not. SHAW et al. (2013), for example, called their study a mixed methods study. According to our definition, this is legitimate because their study followed the pattern shown in Figure 3a and included both qualitative and quantitative data. The opposite happened in VISSER, KORTHAGEN and SCHOONENBOOM (2018). VISSER et al. collected quantitative data that they used to draw a sample for qualitative interviews, which were subjected to qualitative analysis. Although they could have called their study a mixed methods study, VISSER et al. instead called it a qualitative study, emphasizing that their main findings came from qualitatively analyzing the interviews. [58]
A second common reason why researchers often refrain from using the label mixed methods is that they use an established methodology that has its own name and happens to include qualitative and quantitative data. For instance, researchers performing an ethnography or a social network analysis often do not use the label mixed methods, although their studies usually contain qualitative and quantitative data (for more examples of such mixed methodologies, see GOBO et al., 2022). In this respect, QCA is an interesting case. According to RIHOUX, ÁLAMOS-CONCHA and LOBE (2021), "QCA is itself a data analysis—not a data collection—method" (p.186). Based on my analysis of the QCA data in Table 1 as quantitative data, I would call QCA a quantitative method of data analysis, a quantitative analysis method that can be fruitfully used in mixed methods research, as RIHOUX et al. (2021) convincingly showed. However, in many studies, the quantitative data analyzed with QCA are partially or wholly obtained by collecting qualitative data, which are analyzed using qualitative methods, as shown in Figure 3a. Thus, calling QCA a mixed methodology, as many do, is legitimate as long as we recognize the transformation patterns and the quantitative nature of the final analysis (see Table 1). [59]
To summarize my exploration, my aim in this article has not been to provide new guidelines or validity criteria that should affect how we perform mixed methods research. Instead, my goal has been to describe and understand what we are doing in more detail and with more clarity than before. By making a sharp distinction between qualitative and quantitative data, I have shown how different types of data can be transformed, combined, and integrated in a variety of ways. As a result, the complex structure of mixed methods research has become more transparent. Ultimately, researchers will benefit from such transparency when designing and communicating their mixed methods studies. [60]
I wish to thank the guest editors/reviewers of this special issue and Katja MRUCK for their support and feedback and for their patience.
1) Government = cabinet, "Name X" = Xth cabinet chaired by this prime minister; CNr = country number; GER = Germany; IRE = Ireland; Unem = unemployment; Corp = corporatism; Open = trade openness; Left = leftist orientation; Act = change in spending on active labor market policies in percentage points. aFuzzy-set scores, indicating category membership, from 0 = fully out to 1 = fully in.
In the table, 7 of the columns are from data on 6 of the 53 governments in VIS (2012, Web appendix): Columns Government, Country, and Act are from VIS (2012, Web appendix, Table A1, p.1); Columns Unem, Corp, Open, and Left are from VIS (2012, Web appendix, Table A2, p.3). Copyright 2012 by Barbara VIS, permission by Sage Publications. <back>
2) Copyright 2013 by Annals of Family Medicine. <back>
3) ID = student ID; C = CEEPT score; GPA = student GPA; Quotation = utterance by a student. Copyright 2021 by Taylor & Francis, CC BY-NC-ND 4.0, permission through PLSclear. <back>
4) "Crossover mixed analysis = (quantitative analysis of qualitative data) ∪ (qualitative analysis of quantitative data) ∪ (quantitative analysis of quantitative data + qualitative data) ∪ (qualitative analysis of quantitative data + qualitative data) ∪ (qualitative analysis ∪ quantitative analysis of multidata)." <back>
Bazeley, Pat (2018a). "Mixed methods in my bones": Transcending the qualitative-quantitative divide. International Journal of Multiple Research Approaches, 10(1), 334-341,
Bazeley, Pat (2018b). Integrating analyses in mixed methods research. Los Angeles, CA: Sage.
Bergman, Manfred M. (2008). The strawmen of the qualitative-quantitative divide and their influence on mixed methods research. In Manfred M. Bergman (Ed.), Advances in mixed methods research (pp.11-21). Los Angeles, CA: Sage.
Bernard, H. Russell (1996). Qualitative data, quantitative analysis. CAM Journal, 8(1), 9-11.
Brewer, John & Hunter, Albert (1989). Multimethod research: A synthesis of styles. Thousand Oaks, CA: Sage.
Bryman, Alan (2006). Integrating quantitative and qualitative research: How is it done?. Qualitative Research, 6(1), 97-113.
Bryman, Alan (2008). Why do researchers integrate/combine/mesh/blend/mix/merge/fuse quantitative and qualitative research?. In Manfred M. Bergman (Ed.), Advances in mixed methods research (pp.87-100). Los Angeles, CA: Sage.
Caracelli, Valerie J. & Greene, Jennifer C. (1993). Data analysis strategies for mixed-method evaluation designs. Educational Evaluation and Policy Analysis, 15(2), 195-207.
Combs, Julie P. & Onwuegbuzie, Anthony J. (2010). Describing and illustrating data analysis in mixed research. International Journal of Education, 2(2), E13, https://doi.org/10.5296/ije.v2i2.526 [Accessed: October 22, 2022].
Creswell, John W. & Plano Clark, Vicki L. (2018). Designing and conducting mixed methods research. Los Angeles, CA: Sage.
De Allegri, Manuela; Brenner, Stephan; Kambala, Christabel; Mazalale, Jacob; Muula, Adamson S.; Chinkhumba, Jobiba; Wilhelm, Danielle & Lohmann, Julia (2020). Exploiting the emergent nature of mixed methods designs: Insights from a mixed methods impact evaluation in Malawi. Health Policy and Planning, 35(1), 102-106, https://doi.org/10.1093/heapol/czz126 [Accessed: October 22, 2022].
Field, Andy (2009). Discovering statistics using SPSS. London: Sage.
Fox, Nick J. & Alldred, Pam (2017). Sociology and the new materialism: Theory, research, action. London: Sage.
Gobo, Giampietro; Fielding, Nigel G.; La Rocca, Gevisa & Van der Vaart, Wander (2022). Merged methods: A rationale for full integration. Los Angeles, CA: Sage.
Greene, Jennifer C. (2007). Mixed methods in social inquiry. San Francisco, CA: Jossey-Bass.
Greene, Jennifer C.; Caracelli, Valerie J. & Graham, Wendy F. (1989). Toward a conceptual framework for mixed-method evaluation designs. Educational Evaluation and Policy Analysis, 11(3), 255-274.
Guetterman, Timothy C.; Fetters, Michael D. & Creswell, John W. (2015). Integrating quantitative and qualitative results in health science mixed methods research through joint displays. Annals of Family Medicine, 13(6), 554-561, https://doi.org/10.1370/afm.1865 [Accessed: October 22, 2022].
Hammersley, Martyn (1996). The relationship between qualitative and quantitative research: Paradigm loyalty versus methodological eclecticism. In John T.E. Richardson (Ed.), Handbook of qualitative research methods for psychology and the social sciences (pp.159-174). Leicester: British Psychological Society.
Hitchcock, John H. & Onwuegbuzie, Anthony J. (2020). Developing mixed methods crossover analysis approaches. Journal of Mixed Methods Research, 14(1), 63-83, https://doi.org/10.1177/1558689819841782 [Accessed: October 22, 2022].
Latour, Bruno & Woolgar, Steve (1986). Laboratory life: The construction of scientific knowledge. Princeton, NJ: Princeton University Press.
Lee, Young-Ju & Greene, Jennifer (2007). The predictive validity of an ESL placement test: A mixed methods approach. Journal of Mixed Methods Research, 1(4), 366-389.
Martin, Aryn (2004). Can't any body count? Counting as an epistemic theme in the history of human chromosomes. Social Studies of Science, 34(6), 923-948.
Martin, Aryn & Lynch, Michael (2009). Counting things and people: The practices and politics of counting. Social Problems, 56(2), 243-266.
Maxwell, Joseph A. (2019). Distinguishing between quantitative and qualitative research: A response to Morgan. Journal of Mixed Methods Research, 13(2), 132-137.
Maxwell, Joseph A. (2022). Integration in mixed methods research: An alternative perspective. In John H. Hitchcock & Anthony J. Onwuegbuzie (Eds.), The Routledge handbook for advancing integration in mixed methods research (pp.86-93). London: Routledge.
Mertens, Donna M.; Bazeley, Pat; Bowleg, Lisa; Fielding, Nigel; Maxwell, Joseph; Molina-Azorin, Jose F. & Niglas, Katrin (2016). The future of mixed methods: A five year projection to 2020. https://mmira.wildapricot.org/resources/Documents/MMIRA%20task%20force%20report%20Jan2016%20final.pdf [Accessed: October 22, 2022].
Miles, Matthew B. & Huberman, Alan M. (1994). Qualitative data analysis: An expanded sourcebook. Thousand Oaks, CA: Sage.
Morgan, David L. (2018). Living within blurry boundaries: The value of distinguishing between qualitative and quantitative research. Journal of Mixed Methods Research, 12(3), 268-279.
Newman, Isadore; Ridenour, Carolyn S.; Newman, Carole & DeMarco, George Mario Paul, Jr. (2003). A typology of research purposes and its relationship to mixed methods research. In Abbas Tashakkori & Charles Teddlie (Eds.), Handbook of mixed methods in social & behavioral research (pp.167-188). Thousand Oaks, CA: Sage.
Nzabonimpa, Jean P. (2018). Quantitizing and qualitizing (im-)possibilities in mixed methods research. Methodological Innovations, 11(2), https://doi.org/10.1177/2059799118789021 [Accessed: October 22, 2022].
Onwuegbuzie, Anthony J. & Johnson, R. Burke (2021). Mapping the emerging landscape of mixed analysis. In Anthony J. Onwuegbuzie & R. Burke Johnson (Eds.), The Routledge reviewer's guide to mixed methods analysis (pp.1-22). New York, NY: Routledge.
Onwuegbuzie, Anthony J. & Leech, Nancy L. (2019). On qualitizing. International Journal of Multiple Research Approaches, 11(2), 98-131.
Ragin, Charles C. (1997). Turning the tables: How case-oriented research challenges variable-oriented research. Comparative Social Research, 16, 27-42.
Ragin, Charles C. (2000). Fuzzy-set social science. Chicago, IL: University of Chicago Press.
Rihoux, Benoît; Álamos-Concha, Priscilla & Lobe, Bojana (2021). Qualitative comparative analysis (QCA): An integrative approach suited for diverse mixed methods and multimethod research strategies. In Anthony J. Onwuegbuzie & R. Burke Johnson (Eds.), The Routledge reviewer's guide to mixed methods analysis (pp.185-197). New York, NY: Routledge.
Sandelowski, Margarete (2014). Unmixing mixed-methods research. Research in Nursing & Health, 37(1), 3-8, https://doi.org/10.1002/nur.21570 [Accessed: October 22, 2022].
Sandelowski, Margarete; Voils, Corrine I. & Knafl, George (2009). On quantitizing. Journal of Mixed Methods Research, 3(3), 208-222.
Schadler, Cornelia (2019). Enactments of a new materialist ethnography: Methodological framework and research processes. Qualitative Research, 19(2), 215-230.
Schoonenboom, Judith (2023). Mixed methods and multimethod research in education: Six design decisions for collecting, combining, and developing datasets. In Robert J. Tierney, Fazal Rizvi & Kadriye Ercikan (Eds.), International encyclopedia of education: Vol. 12. Qualitative, multimethod, and mixed methods research (pp.361-371). Amsterdam: Elsevier.
Schoonenboom, Judith & Johnson, R. Burke (2021). The case comparison table: A joint display for constructing and sorting simple tables as mixed analysis. In Anthony J. Onwuegbuzie & R. Burke Johnson (Eds.), The Routledge reviewer's guide to mixed methods analysis (pp.277-288). New York, NY: Routledge, https://doi.org/10.4324/9780203729434-24 [Accessed: October 22, 2022].
Shaw, Eric K.; Ohman-Strickland, Pamela A.; Piasecki, Alicja; Hudson, Shawna V.; Ferrante, Jeanne M.; McDaniel, Reuben R., Jr.; Nutting, Paul A. & Crabtree, Benjamin F. (2013). Effects of facilitated team meetings and learning collaboratives on colorectal cancer screening rates in primary care practices: A cluster randomized trial. Annals of Family Medicine, 11(3), 220-228, https://doi.org/10.1370/afm.1505 [Accessed: October 22, 2022].
Small, Mario Luis (2011). How to conduct a mixed methods study: Recent trends in a rapidly growing literature. Annual Review of Sociology, 37(1), 57-86.
Suerdem, Ahmet (2021). Multidimensional scaling of qualitative data. In Anthony J. Onwuegbuzie & R. Burke Johnson (Eds.), The Routledge reviewer's guide to mixed methods analysis (pp.45-56). New York, NY: Routledge.
Tashakkori, Abbas M.; Johnson, R. Burke & Teddlie, Charles B. (2021). Foundations of mixed methods research. Los Angeles, CA: Sage.
Uprichard, Emma & Dawney, Leila (2019). Data diffraction: Challenging data integration in mixed methods research. Journal of Mixed Methods Research, 13(1), 19-32, https://doi.org/10.1177/1558689816674650 [Accessed: October 22, 2022].
Van Haneghan, James (2021). Exploratory factor analysis of text. In Anthony J. Onwuegbuzie & R. Burke Johnson (Eds.), The Routledge reviewer's guide to mixed methods analysis (pp.25-36). New York, NY: Routledge.
Vis, Barbara (2011). Under which conditions does spending on active labor market policies increase? An fsQCA analysis of 53 governments between 1985 and 2003. European Political Science Review, 3(2), 229-252.
Vis, Barbara (2012). The comparative advantages of fsQCA and regression analysis for moderately large-N analyses. Sociological Methods & Research, 41(1), 168-198.
Visser, Lennart; Korthagen, Fred A.J. & Schoonenboom, Judith (2018). Differences in learning characteristics between students with high, average, and low levels of academic procrastination: Students' views on factors influencing their learning. Frontiers in Psychology, 9(808), https://doi.org/10.3389/fpsyg.2018.00808 [Accessed: October 22, 2022].
Vogl, Susanne (2019). Integrating and consolidating data in mixed methods data analysis: Examples from focus group data with children. Journal of Mixed Methods Research, 13(4), 536-554.
Vogl, Susanne (in press). Data integration as a form of integrated mixed analysis in mixed methods research designs. In Cheryl Poth (Ed.), The Sage handbook of mixed methods research design. London: Sage.
Witt, Harald (2001). Forschungsstrategien bei quantitativer und qualitativer Sozialforschung. Forum Qualitative Sozialforschung / Forum: Qualitative Social Research, 2(1), Art. 8, https://doi.org/10.17169/fqs-2.1.969 [Accessed: October 22, 2022].
Judith SCHOONENBOOM is professor of empirical pedagogy at the University of Vienna, Austria. She has extensive experience in designing and evaluating innovations in education, especially those involving educational technology. Her research interests include mixed methods design and the foundations of mixed methods research. Judith is an associate editor of the Journal of Mixed Methods Research and a past president (2020-2021) of the Mixed Methods International Research Association (MMIRA).
Contact:
Judith Schoonenboom
University of Vienna
Department of Education
Sensengasse 3A
1090, Vienna, Austria
E-mail: judith.schoonenboom@univie.ac.at
Schoonenboom, Judith (2023). The fundamental difference between qualitative and quantitative data in mixed methods research [60 paragraphs]. Forum Qualitative Sozialforschung / Forum: Qualitative Social Research, 24(1), Art. 11, http://dx.doi.org/10.17169/fqs-24.1.3986.

Creative Commons Attribution 4.0 International License