Volume 24, No. 1, Art. 16 – January 2023
Mixing Standardized Administrative Data and Survey Data With Qualitative Content Analysis in Longitudinal Designs: Perceptions of Justified Pensions and Related Life Courses
Leila Akremi & Dagmar Zanker
Abstract: Citizens are more likely to accept reforms of welfare state arrangements if they perceive them as just and reasonable. However, the concept of social justice is multidimensional. For instance, in discourses on old-age security, justice is addressed in terms of meritocratic principles, demands, processes, redistribution, gender, or intergenerational equity.
In the study "Lebensverläufe und Altersvorsorge" (LeA) [Life Courses and Old-Age Provision], respondents could express their wishes for retirement and the German statutory pension system in an open-ended question. We draw on this study to illustrate who addresses which social justice dimensions and how. Methodologically, we mixed standardized administrative and survey data with qualitative content analysis.
More generally, we aim to highlight the rich analytical potential and challenges of open-ended questions. We reflect on methodological issues, e.g., the time-consuming preparation and interpretation of an enormous amount of non-standardized data, the interview situation compared to conventional qualitative interviews as well as interpretation difficulties due to missing contextual information. Furthermore, we prepared the open-ended question for quantitative analysis and integrated it into the data set while preserving its qualitative character. Finally, to illustrate options for joint analyses, we combined content analysis results with sequence/cluster analysis for longitudinal quantitative data.
Key words: mixed methods; qualitative content analysis; sequence analysis; cluster analysis; administrative data; survey data; open-ended questions; longitudinal design; welfare state; social justice
Table of Contents
1. Why Combine Open-Ended Questions and Longitudinal Data Within a Mixed Methodology?
2. The LeA Study and its Research Objectives
2.1 Welfare states and attitudes toward distributive justice
2.2 Research design and data collection
3. Quantitative Strand: Types of Employment Biographies—Results From the Sequence and Cluster Analysis
4. Qualitative Strand: Analysis of Open-Ended Questions
4.1 Open-ended questions and survey methodology
4.2 Three wishes for the German statutory pension system—data and analytical methods
4.3 Some results of the qualitative-interpretative content analysis
5. Combining the Quantitative and Qualitative Strands: Life Courses and Wishes
6. Conclusion and Recommendations
1. Why Combine Open-Ended Questions and Longitudinal Data Within a Mixed Methodology?
Open-ended questions are included in various forms in almost every questionnaire, but are rarely analyzed thoroughly. Our quantitative study on "Lebensverläufe und Altersvorsorge" (LeA) [Life Courses and Old-Age Provision], which we use as an example in this article, also contained an open-ended question: In the last question of the survey, interviewees could express their wishes for the German statutory pension system. The abundance of responses and detailed comments represent rich data for analysis. An initial inspection of the data showed that the respondents commented extensively on the fairness of pensions. As a result of this discovery, we were confronted with an almost unmanageable amount of diverse, non-standardized responses that needed interpretation. [1]
We opted for a qualitative-interpretative analysis strategy, which is best suited for this data. To gain as much knowledge as possible, we also decided to integrate the qualitative results with the quantitative part of the study within a mixed methodology. With this exploratory data-driven approach we obtained meaningful additional insights into our initial predominantly quantitative focus on life courses and old age provision. Based on our research question—concerning the relationship between perceptions of justified pensions and peoples' life courses—we first illustrate how to conduct an in-depth qualitative analysis of open questions with large data sets. Secondly, we show how to transform the results so we can link them to the standardized data while preserving the qualitative character of the data despite quantification. [2]
Although the study's research design and the data collection process were mono-methodologically quantitative, we demonstrate that a combination of qualitative and quantitative methods can be applied successfully. The interpretative approach toward both components constitutes the link in the mixed methodology, and the researcher's decision whether to use mixed methods does not have to be determined by the initial research design. A more flexible approach is also of benefit to qualitative and quantitative researchers alike. [3]
In Section 2, we provide background information to the LeA study, and in Section 3, we present the quantitative component: exploratory sequence and cluster analysis to identify types of employment biographies. Subsequently, in Section 4, we discuss the relevance of open-ended questions in survey methodology and describe the qualitative-interpretative content analysis of open-ended questions using our research example. We address both the potential for insights and the challenges and limitations. In Section 5, we explain how we combined the quantitative and qualitative strands to link the respondents' wishes to their life courses. Finally, we reflect on the methodological approach and provide recommendations for further research in Section 6. [4]
2. The LeA Study and its Research Objectives
The study on "Life Courses and Old-Age Provision" was designed to provide empirical data and analyses for well-founded pension policy debates, i.e., it was commissioned to generate a comprehensive data set which could be used to provide answers to various research questions related to life courses and old-age security in Germany. We use the LeA data to examine the respondents' perceptions of justified pensions in combination with their life courses and employment biographies, as people's notions of social justice play a crucial role in their discussions of pension policy. [5]
2.1 Welfare states and attitudes toward distributive justice
In welfare states the societal distribution of goods and burdens is influenced by the levying of taxes, state subsidies, social policy measures, and social insurance systems. The different components of social protection are closely linked to specific notions of social justice (LORENZ, 2014). As a result, citizens are willing to accept welfare state regulations when they feel that reform projects and the social security system are implemented in a socially fair manner. [6]
The German welfare state has been substantially transformed over the past 30 years, so that receiving old-age benefits from occupational and private pension schemes has become increasingly important. At the same time, forms of employment, which are associated with lower (or no) contributions to statutory pension insurance such as part-time jobs, marginal employment, combinations of dependent employment and independent self-employment or "new" models of self-employment (e.g., crowdworkers and clickworkers), have gained in importance. Furthermore, the effects of demographic change are beginning to be felt in the labor market. [7]
These changes need not, but can, lead to constellations in which certain principles of justice become more important than others. In addition, competing or even contradictory principles of justice could underlie different components of the welfare state. FRANKE and SIMONSON (2018) illustrated this using the example of old-age security in Germany: Statutory pension insurance is the primary source of income for retired employees (the first pillar) and the pension level depends mainly on the contributions they made during their working lives. Although the equivalence principle between contributions and benefits is still significant, the current multi-pillar system means that occupational and private pension provisions (second and third pillar) are becoming increasingly important, and individuals bear a greater responsibility in maintaining their standard of living in old age. [8]
When researchers refer to this aspect of social justice, they focus on social order and procedural justice. Laws, regulations, and administrative actions comprise an institutional framework for a just distribution of goods and burdens into which citizens are socialized. Citizens internalize this institutional framework as a blueprint with which to evaluate their perceptions of justice and related actions. [9]
Even though different perceptions of justice can be linked to different socialization depending on welfare state regimes, we assume that there are other influencing factors: public discourses about the welfare state or specific reform projects (SCHRÖDER & VIETZE, 2015; VIETZE, 2018), an individual's social embeddedness, their life course, or other subjective factors such as political attitudes, or specific fears (FRANKE & SIMONSON, 2018). The standards for social justice applied by citizens in different social insurance sectors, such as unemployment, health, or pensions, can also vary. Characteristics of the sectors differ, and this affects the concepts addressed in discourses on justice-related policies. Regarding old-age security we find e.g., merit-based, needs-based, procedural, distributive, gender-based, and intergenerational justice. [10]
In the following analyses we draw on the four principles of justice LIEBIG and SAUER (2016, p.50) described concerning social order: 1. equality (everyone should get the same); 2. equity (benefits and burdens should be distributed proportionally to individuals' investments); 3. need (everyone should have enough to cover basic needs), 4. entitlement (burdens and benefits should be distributed according to ascribed or achieved status, e.g., gender, education, occupation, or origin). Knowledge about societal changes, welfare state reforms, and perceptions of social justice is essential contextual information for interpreting our open-ended question. [11]
2.2 Research design and data collection
The LeA study was a standardized survey administered to a representative sample of people living in Germany (born between 1957 and 1976) and their partners, containing questions on fundamental aspects of employment and old-age provision. After data collection, the survey data were individually connected with administrative data from the statutory pension insurance records. With the longitudinal data, we were able to group employment biographies into typical trajectories using sequence and cluster analysis. These typical patterns could then be linked to current attitudes towards justice regarding pensions and the old-age security system derived from an open-ended question: The respondents could state their detailed wishes for the statutory pension system at the end of the survey. They expressed their concerns and fears, rarely mentioning confidence or satisfaction. From these statements we derived the principles of justice that are of particular concern to the respondents. [12]
In this paper, we are interested in using this combination of administrative data, survey data on life histories and old-age provision, and a qualitative-interpretative analysis of an open-ended question to examine outcome-oriented perceptions of distributive justice in old-age provision. More specifically, we focus on framing principles of justice and the relation between the life course and current attitudes toward the old-age security system: Which principles of justice are addressed in which way, and which individuals with which work biographies are moved by which issues? Do individuals with similar life courses tend to have similar concerns? Our approach is exploratory, and we do not aim to uncover causalities. Instead, based on our substantive question, we demonstrate the potential of combining rich data from an open-ended question with administrative and survey data in the context of a mixed methods analysis. [13]
The market research company Kantar Public collected the data for the LeA study in 2016. Based on a representative sample derived from the German residents' registration offices, the target population of LeA covered people living in Germany aged between 40 and under 60 years in 2016. In order to build the LeA data set, two different data sources were matched using record linkage: Firstly, survey data on life courses and entitlements in all three pension pillars were collected through computer-assisted, face-to-face interviews (CAPI). Secondly, process-generated administrative data were drawn on for information stored in the respondents' pension insurance accounts. The LeA data provide detailed information on the respondents'—and if applicable their cohabiting partners'—life and work histories since the age of 15, and their entitlements in all three pillars of the German pension system. A total of 9,447 cases including partners outside the target age bracket, or of 8,901 cases (representative for the target age bracket) are available for analysis.1) [14]
The LeA study was based on a quantitative research design resulting in standardized numerical data, but there are also verbal data, which were collected via open-ended questions in the questionnaire. Here, we are particularly interested in the last question of the LeA survey—a typical open-ended question—where the interviewees could express wishes, comments, or suggestions regarding statutory pension insurance: "Last but not least, if you had three wishes for statutory pension insurance, what would they be?"2) Interviewers recorded the answers by typing them into the survey notebook. They could not use a touchpad pen and autocompleting, nor could they copy answers.3) For our analysis, we can include 6,581 respondents (about 70%) who expressed at least one wish. [15]
We examined the perceptions of distributive justice regarding pensions and life courses by combining numerical with verbal data and employing quantitative and qualitative methods:4) In a first step, we used the administrative data from the respondents' pension insurance accounts supplemented with biographical information on gaps in the sequence and subsequent cluster analysis. In a second step, we drew on the numerical survey data to describe the clusters, e.g., socio-demographic variables. In a third step, we turned to the non-standardized verbal survey data from the open-ended question and conducted a qualitative-interpretative content analysis, which we then linked to the results of the exploratory quantitative analysis in the fourth and final step. [16]
3. Quantitative Strand: Types of Employment Biographies—Results From the Sequence and Cluster Analysis
Combining the two exploratory statistical procedures, sequence and cluster analysis, we considered all relevant episodes of the employment trajectories and grouped similar patterns into specific types (JÄCKLE, 2017; KÖNIG & JÄCKLE, 2017). Depending on the particular research question, social scientists determine which episodes they consider relevant. We focused on episodes related to employment and defined seven distinct states to keep the analysis manageable (short names in parentheses):5)
full-time employment subject to social security contributions (SSC full-time),
near full-time employment subject to social security contributions (SSC near full-time),
part-time employment subject to social security contributions (SSC part-time),6)
marginal employment (marginal),
care work for the elderly or children (care work),
unemployment or illness (unemployed/ill),
remaining episodes, e.g., self-employment or school/vocational education (miscellaneous). [17]
We used sequence analysis to examine the order of these episodes for each individual in our sample and compare them with other cases to find differences and similarities. These (dis)similarities concerned, for instance, the extent to which specific episodes were present in the life course, the timing of states in different periods of life, and the presence of transitions and successions "or, in other words, the typical successions of states through which the trajectories run" (STUDER, 2013, p.3). We chose the optimal matching method to transform the (dis)similarities of the individual employment histories into a distance matrix between all cases in the sample. This distance matrix was then directly used in the subsequent cluster analysis (hierarchical clustering with the Ward algorithm). The purpose of this procedure was to find typical patterns of employment biographies and to assign the cases in the sample to these types (JÄCKLE, 2017; KÖNIG & JÄCKLE, 2017).7) After comparing and examining different classifications, we chose the cluster solution with nine typical patterns of employment histories (see Figure 1):8)
Figure 1: State distribution plots: Nine patterns of employment biographies (Source: LeA, n = 8,901). Please click here for an enlarged version of Figure 1. [18]
First, there were two comparatively large clusters—1 and 2—where the individuals' employment history patterns corresponded to the concept of (male) continuous full-time employment. In Figure 1, we see that more than 50% of respondents were working full-time in cluster 1 between the ages of 15 and 20 years. The distribution reached its peak of almost 80% after age 25. In cluster 2, the share for full-time employment between ages 15 and 20 was already more than 70%, rose very quickly to over 90%, and remained at this high level. Both clusters were male-dominated, with a disproportionately high number of persons from East Germany (44% in cluster 1, 38% in cluster 2). [19]
A second finding was a group of three clusters (3, 4, 5) comprised almost exclusively of women (predominantly married, nearly all with at least one child) and differentiated mainly by the extent of their paid employment—West German housewives, balancing work & family—part-time/marginal employment, and balancing work & family—near full-time employment. Among West German housewives (3), the share of SSC full-time peaked at about 30% by the age of 18. After that, it slowly declined to almost zero. Simultaneously, these women were increasingly engaged in care work; at the age of 30, this applied to about 80%. In the other two clusters, after having children, women either switched from full-time employment to care work and part-time or marginal employment (4) or they reduced their working hours only a little (5). [20]
Two slightly different clusters included respondents whose employment histories were predominantly outside the statutory pension system (6, 7). The peculiarity of cluster 6 was that 80% and more did not have any episodes of full-time employment with contributions to statutory pension insurance over the entire period from age 15 to 40. As with all clusters, most were in education at the beginning of the observation; between ages 30 and 40, a small share was engaged in care work. Episodes of unemployment/illness, SSC part-time/full-time, and marginal employment were negligible. Therefore, we assumed that the cluster consisted mainly of civil servants and the self-employed who were covered by other pension schemes or who did not make any provisions for old age at all. Cluster 7, employment outside the statutory pension system & unemployment in middle age, shared similarities with cluster 6, but there was also a notable proportion of unemployment in the age group 25 to 40 years. SSC full-time employment decreased from a relatively low level after age 30. The low importance of further SSC employment and care work was striking, and the visible share of unemployment/illness increased steadily after the age of 20. This cluster had a slightly higher share of males. [21]
Finally, two more clusters seemed complementary—academic and precarious life courses (8, 9). Focusing on the cluster academic life courses (2), residual episodes—e.g., attending school and university—dominated until about the 25th birthday. Subsequently, there was a steady increase in SSC full-time employment, and by the mid-30s, more than 80% of respondents were in SSC full-time employment. As in cluster 6, people with academic life courses showed a strong affinity for the labor market. The final and smallest cluster, precarious life courses (9), was primarily characterized by unemployment or illness. Starting even before the age of 20 and rapidly increasing, this state was by far the most dominant one from age 25 until 40. It was also a mainly male-dominated cluster (61%). [22]
4. Qualitative Strand: Analysis of Open-Ended Questions
4.1 Open-ended questions and survey methodology
Social scientists apply open-ended questions in multifaceted forms for a variety of purposes. When used in pretests, researchers can verify with open-ended questions if they have considered all key aspects or whether readjustments are necessary. Open response categories are also well suited for discovering unknown attributes. Furthermore, it is appropriate to opt for an open question format if there are so many possible answers that they cannot be reasonably represented in a closed response item. In such cases, ready-made classification schemes such as the International Standard Classification of Occupations (ISCO) from the International Labour Organization can be used. With another type of open-ended question, interviewees can describe specific issues in more detail or provide longer comments and suggestions about the study's content. An exhaustive list is provided by SINGER and COUPER (2017, pp.116f.) who mentioned several goals scholars pursue with the use of open-ended questions (see also FIELDING, FIELDING & HUGHES, 2013, p.3261):
clarifying the meaning of a respondent's answer,
drawing out the crucial aspects of an opinion,
finding out what influenced an opinion,
understanding respondents' reasons for hesitancy or rejection,
determining which options to use in closed response items,
figuring out complex questions about attitudes,
evaluating how well questions work,
testing theories and hypotheses,
checking for errors,
clarifying statistical relationships,
interpreting motivations,
encouraging more truthful answers,
indicating the quality of answers,
providing an opportunity for feedback. [23]
Although there are many reasons for using open-ended questions in surveys, in-depth analysis of detailed verbal answers is often neglected or not carried out at all (FIETZ & FRIEDRICHS, 2019). Furthermore, reports on quantitative studies do not always include responses to open-ended questions. In handbooks on social science methods (e.g., BAUR & BLASIUS, 2019; LITTLE, 2013a, 2013b) or introductory texts on questionnaires and on survey methodology (GIDEON, 2012), the advantages and disadvantages of open-ended questions are mentioned rather generally in the context of addressing different question formats. These descriptions are usually not sufficient for deriving practical recommendations for analyzing open-ended questions or best practice examples. In earlier debates, researchers exchanged views on the benefits of open versus closed questions (see, e.g., SINGER & COUPER, 2017). They also addressed the issues of what open-ended questions measure (e.g., GEER, 1988), which individuals are more likely to respond to them (e.g., ZUELL & SCHOLZ, 2015), and whether open-ended questions can be used to obtain relevant information (GEER, 1991). [24]
There may be various reasons why researchers attach little importance to open-ended questions: Indeed, some open-ended questions are not primarily intended to capture substantive information about the research topic. They may just be seen as an opportunity for the respondents to express something personal, including thoughts about the survey itself, as typically used toward the end of the questionnaire. Open-ended questions can also have low response rates, or the answers are not as substantial as expected. Research teams more familiar with quantitative methods may lack expertise or affinity for a qualitative analysis. Alternatively, as FIELDING et al., 2013 (p.3261) put it: "[…] when the time comes for analysis, the survey researcher may find that the OEQ [open-ended question] data are as much an irritant as a resource." Another obstacle is that open-ended questions cannot be processed well in statistical software such as SPSS or Stata. Researchers must therefore export the data in a specific file format (e.g., .csv, .xlsx, .txt, .docx) corresponding to their preferred software for qualitative analysis. Also, detailed analysis of open-ended questions by human coders may be too time- and resource-consuming. [25]
Whatever the underlying reasons are for researchers to avoid or not fully exploit the potential of open-ended questions, from a research ethics perspective using data sparingly, i.e., collecting only what can or will be analyzed, is compulsory. When designing a questionnaire, social scientists should clarify whether open-ended questions are necessary and what benefits they have for their study. Otherwise, what FIELDING and colleagues (p.3262) pointed out remains true: "Stories of studies that end up not analyzing, transcribing, or even accurately recording response to OEQs continue to be encountered." [26]
In recent years, researchers have shown a renewed interest in open-ended questions. In general, this is related to automation techniques, and they are building on the older tradition of text mining methods. Several methods and algorithms have been developed and refined for (semi-)automated text analysis (for an overview, see, e.g., ANANDARAJAN, HILL & NOLAN, 2019; LEMKE & WIEDEMANN, 2016; RIEBLING, 2019). From a methodological perspective, the trade-off between effort or feasibility of analysis by human coders and the achievable reliability and degree of accuracy through automation is of particular significance (see, e.g., HE & SCHONLAU, 2020, 2021; SCHONLAU & COUPER, 2016; for a more critical view, see ASCHAUER, SEYMER, WEICHBOLD, HERDIN & RÖSER, 2019). Unfortunately, computational social science techniques are not (yet) part of the general methodological training for social scientists and there are hardly any introductions for beginners in this field. [27]
When proponents of these methods emphasize time savings through automation, this aspect is usually not discussed in detail. The ability to carry out such analyses requires a great deal of training and data preparation effort. Indeed, this might necessitate close cooperation with experts in this field (ASCHAUER et al., 2019). However, analysis software in qualitative research has also been developed considerably over recent years. It comprises a variety of methods for analyzing different types of data (e.g., verbal text, pictures, audio, or video), including statistical procedures for mixed methods studies. FIELDING et al. (2013) described how researchers can analyze open-ended questions using qualitative analysis software. They also showed how simple quantifications such as word frequencies or cross-tabulations can support the analysis. RÄDIKER and KUCKARTZ (2020) introduced the analysis of open-ended questions with MAXQDA. [28]
From our experience, automated coding of extremely unstructured texts appears to be far more problematic than manual coding. Furthermore, we do not consider a complete transformation of verbal data into numerical codes as the highest goal of adequately analyzing the data. Quantifications initially serve well as a structuring tool and help to abstract from the multitude of details. But with a qualitative approach, scholars can develop different interpretations of the respondents' statements, discuss the context in which these statements were made, and determine which understanding is finally the most plausible. All relevant aspects within statements can be coded, and several codes can be assigned to ambiguous statements. We do not want to argue against the benefits of automation techniques, as researchers can use them to discover unexpected aspects (for an outline of advantageous possibilities see e.g., HOXTELL, 2019). Instead, we would like to emphasize the importance of knowing one's data well and making the best use of the interpretive power of human coders. Without ignoring the challenges, our goal is to show how enriching a qualitative analysis of open-ended questions can be. Research projects can benefit from open-ended questions if they are not just seen as a tiny, roughly analyzed qualitative appendix. To prove our point, we also made the open-ended questions usable for quantitative analysis and integrated them into the data set so that the quantitative and qualitative data could be analyzed together. In this sense, we pursued a data-integrative mixed methods approach to data analysis. [29]
4.2 Three wishes for the German statutory pension system—data and analytical methods
As mentioned above, respondents to the LeA study could name three wishes for German statutory pension insurance. Their answers were stored in an SPSS file as string variables. A total of 6,581 persons expressed at least one wish. This is about 70% of the whole sample (n=9,447). There were no further instructions for answering this question and the interviewers recorded the statements very differently. A response could consist of a single word or a compound term such as "basic income," "pension security," or simply "justice." This only applied to about 2% of the responses. More often, the answers were phrases, incomplete or short sentences: "equalize East and West"; "that all citizens pay in"; "women should retire at 60." Overall, about half of the statements consisted of a maximum of seven words. However, the interviewers themselves decided how to write down the three wishes. Some divided the text into several variables. Others placed a lot of text in only one, i.e., a single statement in one string variable could include several wishes containing 60 or even almost 100 words:
"I would like them to give more to the pensioners, especially women, who have done a thousand other things in their lives, the generations that have now retired. The women who raised children and built the country should get better/fairer pensions. For their hard work in low-paying jobs, they should be paid better than now, so they can also afford leisure activities and not just the bare necessities." [30]
In total, we had a remarkable amount of data of about 107,000 words. Once we had transferred the data to an Excel file,9) the analysis and interpretation could begin (see Figure 2). First, we did a rough correction of typing and spelling errors to facilitate the analysis. This already gave a first impression of the richness of the data. Depending on the quality of the verbal data, preparing such a large amount of text can take a very long time. While it is always desirable to have all data entirely cleaned, error-free data is not required for qualitative analysis by human coders to the same extent as with automation techniques. Human coders can recognize the right words even if they are misspelled. Too many errors, however, slow down the analysis considerably. After correcting the data, we started coding.
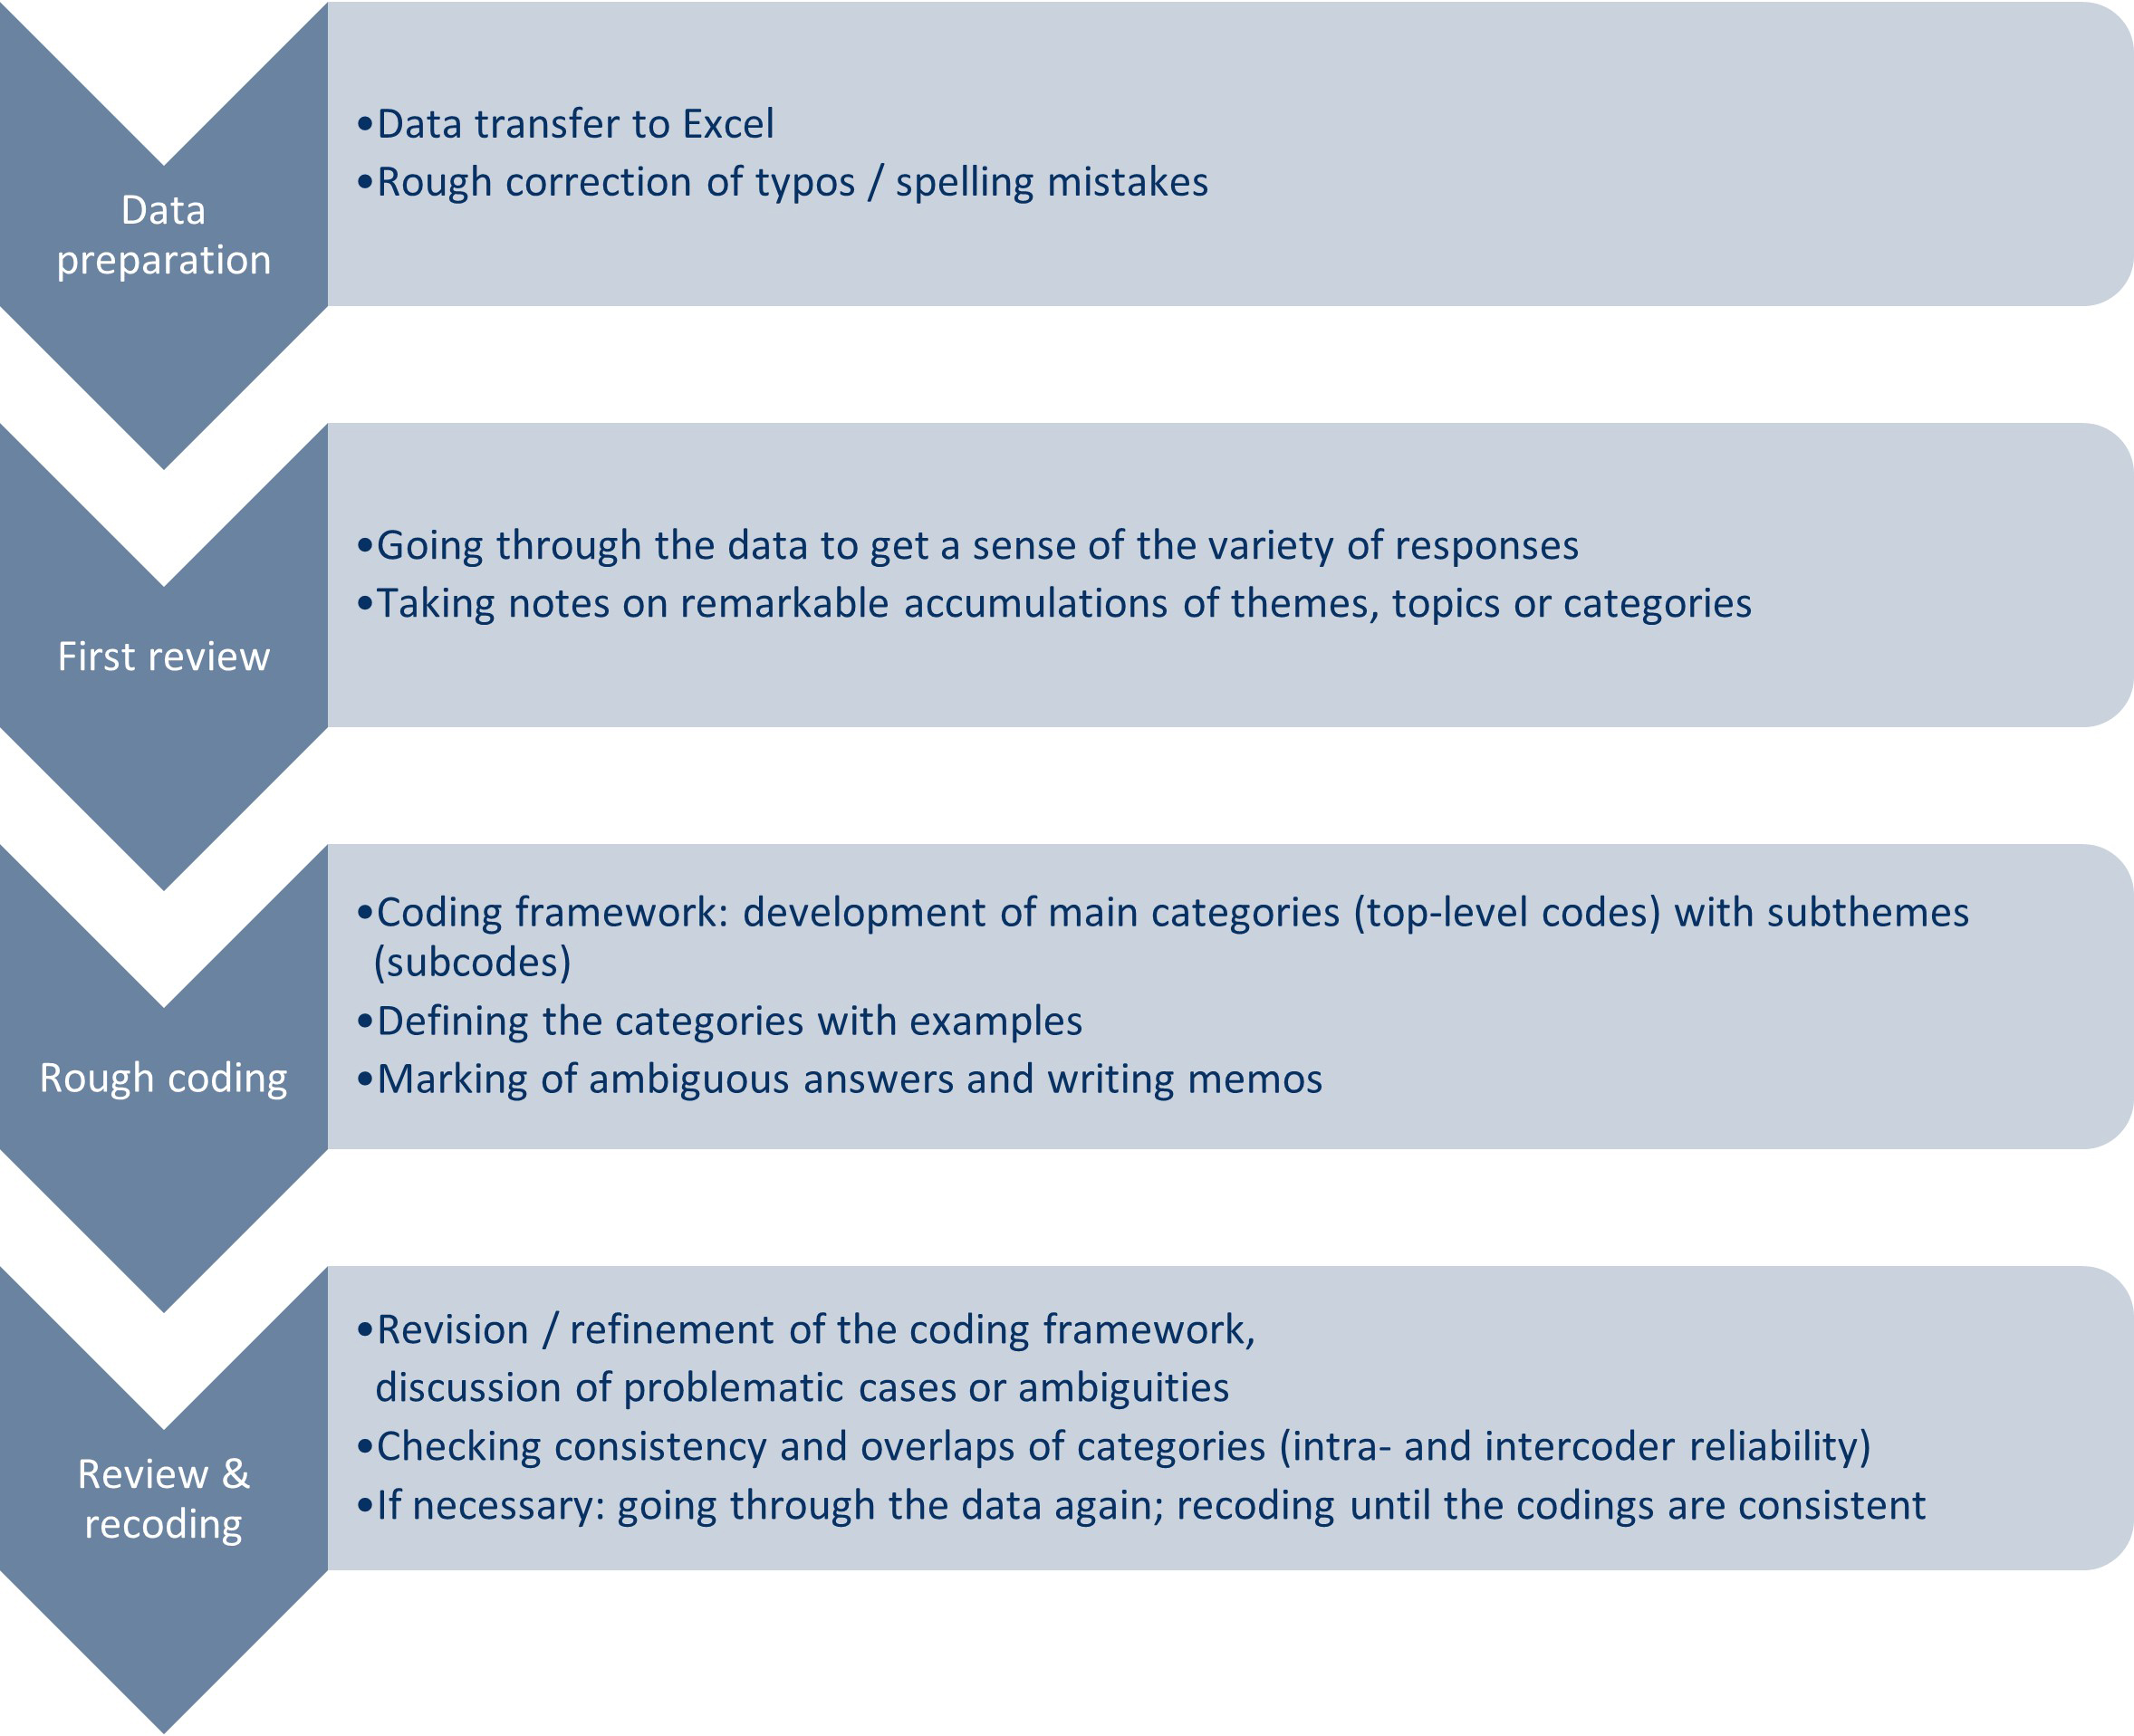
Figure 2: Different phases of the coding process. Please click here for an enlarged version of Figure 1. [31]
Two researchers coded the statements independently. We compared the codes, discussed the differences, and decided on ambiguous cases by mutual agreement (for a discussion on cooperative coding and intercoder agreement see e.g., BECKER, MOSER, FLEßNER & HANNOVER, 2019). Our approach was data-driven, i.e., using qualitative content analysis, we developed the categories through open thematic coding (KUCKARTZ, 2019). Our focus was on what the respondents had to say. Thus, to find thematic categories, we tried to initially ignore expert vocabulary or discourses on old-age provision. As in KUCKARTZ's characterization, we went through an iterative process to find appropriate categories and to generate a coherent coding frame (see also FIELDING et al., 2013): "the step-by-step procedure, the method of open coding until saturation occurs; the continuous organization and systematization of the formed codes, and the development of top-level codes and subcodes at different levels" (KUCKARTZ, 2019, pp.184f.). [32]
In the first run through the material, we screened the statements to gain an impression of the spectrum of answers. We noted the most frequent and remarkable responses and developed the first list of topics and possible main categories for the coding framework. FIELDING et al. (2013) suggested using an analysis of the most frequent words to support the coding process when short answers accumulate, or interviewers have obviously paraphrased. Unfortunately, this did not help much with our data. The vocabulary was very differentiated, and even the most frequent words occurred relatively rarely. Moreover, some were so common but referred to various contexts, with the consequence that a mix of different statements would have been subsumed under one code. In addition, data preparation for counting word frequencies is also very time-consuming: Even if human coders have no problems, all errors must be eliminated. Otherwise, each misspelled word will be listed as a new separate term. Stop words should also be defined. These are terms that frequently occur—e.g., determiners, conjunctions, pronouns, prepositions—but are not meaningful for the analysis. [33]
Researchers must also consider that the same topics may appear in different ways, e.g., singular/plural, with synonyms, or in paraphrases. After we had roughly corrected spelling and removed common stop words, we ran a simple count of word frequencies resulting in over 8,000 disjunct word categories. The most frequent word was "pension" with a share of only 8%. Nevertheless, since almost all wishes for the statutory pension system relate to pensions, it would not be helpful to create such a category or use it as a keyword to find similar expressions. [34]
The term "contribution" was a similar case. Since an infinite number of different words can be generated by merging nouns in German, our data contained 81 disjunct terms with the word "contribution" in singular or plural and combined with other words.10) Going through the relevant statements more closely, they related to quite different contexts and not always to pension contributions. Instead, they also referred to contributions to health insurance, long-term care insurance, contribution periods, or contributors. At the same time, we found statements on contributions that did not contain this word at all: "Reducing the financial burden on workers; reducing current pension payments to the minimum necessary; get more, pay less; increase employer share; that payments go down; the amount of individual payment; pay more for pension." To conclude, simple automation techniques such as counting word frequencies can be helpful for the analysis. Yet, the benefit depends heavily on the data at hand, and it is always the researcher who generates meaning from the data. [35]
For the second run, we started coding segments with our rough list of topics and main categories. In this phase, we also decided on the level of abstraction of the top categories to assign meaningful subcategories afterwards. It also became evident how many different aspects were contained in the individual statements. Thus, we decided that a maximum of five wishes per person would capture everything essential. We marked unclear or problematic answers, wrote memos to discuss these statements, and developed a coding guide with definitions of all categories and examples for reference and intersubjective comprehensibility. [36]
Finally, we went through the data for the third time to revise, recode and refine the coding framework. Step by step, we checked all main categories for their sub-aspects. We split categories, recoded statements, and clarified problematic cases. The very last step included consistency and overlap checks. The whole coding process was not linear but consisted of a continual forward and backward movement. In doing so, we were able to gain new insights, and new findings emerged during the coding. Therefore, categories were reshaped, and steps that had already been taken were repeated. [37]
Altogether, we coded over 12,000 segments, and developed our final coding framework consisting of 40 individual or subcategories and 11 main categories (top-level codes). Recapitulating the analytical process, coding the open-ended question was a major challenge for us because:
The amount of non-standardized verbal data was enormous, as 6,581 people expressed at least one wish. Therefore, maintaining an overview and doing justice to the material required much time and thoroughness.
When coding and interpreting, it was essential to consider the specific interview situation and the influence of the interviewers on the statements. The framing of open-ended questions was quite different compared to conventional qualitative interviews.
Errors and unclear wording made interpretation difficult.
Sometimes statements were taken out of context. For these cases, further information was needed for a straightforward interpretation. Often, we could make reasonable deductions by using the standardized questionnaire or by discovering similarities in content across other statements. However, we could not resolve everything with certainty.
Finally, the respondents mentioned many different aspects in their statements, and there were various possible interpretations. [38]
4.3 Some results of the qualitative-interpretative content analysis
An overview of all code categories and their frequency distribution is provided in Table 1. We assigned 40 code categories and, for a concise overview, grouped several thematically related codes under 11 top-level codes. The second column in Table 1 contains the frequencies (in %) based on the total number of coded text segments. Since we registered up to five aspects per person, the total exceeds the number of cases in our sample. The third column shows the frequencies at the level of cases, e.g., 28% of the respondents mentioned something related to "Solidarity." The subcategories are included in parentheses, except for the first and the fourth category, which have no subcategories.
|
Top-level codes (subcategories) |
Coded text segments |
Individual level |
|
1. Pension level/old-age pension benefit |
19 |
37 |
|
2. Solidarity (mandatory statutory pension insurance for all; justice/redistribution; minimum income schemes; no flat-rate old-age pension) |
17 |
28 |
|
3. Old-age pension eligibility and retirement age (earlier retirement age; more flexible retirement age) |
12 |
21 |
|
4. Security of old-age pensions/keeping commitments |
10 |
19 |
|
5. Old-age pension and replacement rate (abolish deductions; taxation of old-age pensions; replacement rate; ratio of contributions to pension payments; contribution level; old-age pension indexation) |
10 |
17 |
|
6. Reform of the old-age security system (future-proof old-age pension schemes; reform of old-age pension provision in general; East-West harmonization; regulation of pension entitlements in case of divorce/survivors’ pension; abolishing statutory pension insurance/individual choice; (only) statutory pension insurance/additional SSC; reform according to foreign role models) |
8 |
15 |
|
7. Statutory pension insurance and its administration (information; simplification/comprehensibility; pension advisory service; less bureaucracy) |
6 |
11 |
|
8. Statutory pension insurance and social policy (misuse/non-insured benefits; transparency/honesty; responsibility) |
6 |
10 |
|
9. Extension of creditable periods (pension credits for social engagement; pension credits for care work; pension credits for (precarious) work/better labor market opportunities; pension credits for (further) education; pension credits for employment abroad) |
6 |
10 |
|
10. Health and illness (protection in case of illness/disability/invalidity; reduced earning capacity pension; rehabilitation) |
3 |
5 |
|
11. Further categories (civil servants/self-employed; personal wishes; miscellaneous; satisfaction) |
3 |
6 |
Table 1: Frequencies of top-level codes (in %) [39]
Already at first glance, the range of topics mentioned is impressive. We offer a glimpse into the considerations involved in coding the categories by discussing the first and second top-level code in more detail. [40]
Unsurprisingly, many statements referred to the "pension level/old-age pension benefits"—who would not like to have a "higher pension" or simply "more money." Although this category was easier to code than others, it did include additional aspects, such as wishes "that pensions should not be reduced further" or for a "pension on which a person can live with dignity in old age." The latter statement is one of the most prominent aspects of this category. The vocabulary used to describe concerns about old-age poverty was remarkably emotive, figurative, and aimed at existential threats: "not having to starve"; "not becoming a poor beggar"; "having enough money for food, drink, and clothing." Therefore, the respondents wished that the minimum subsistence level is guaranteed so that they would not have to claim social benefits or be dependent on the support of partners or family. This became obvious in statements like "that I am not dependent on social welfare and get a high enough pension in old age, I do not want to starve and freeze" or "that someone is not a financial burden for their children in old age." In addition, it is not only about surviving somehow but also getting "enough money in old age so that the standard of living can be maintained." [41]
The top-level category "solidarity" contained statements regarding a socially just pension. Reading through these statements it quickly became clear how different and ambiguous the ideas of justice or fair redistribution are—nuances that would be difficult to capture in a closed question in the questionnaire. The subcategory "mandatory statutory pension insurance for all" represents the view that currently specific groups avoid their social responsibilities, and statutory pension insurance should be expanded (to everyone): "there is one system"; "everyone should pay into statutory pension insurance." Civil servants, the self-employed, and politicians were mainly focused on: "I would like to expand the group of contributors, especially to include civil servants and the self-employed"; "parliamentarians should also pay into the pension fund." [42]
Analyzing the category "justice/redistribution" we recognized the demand for redistribution in favor of vulnerable people: "that the socially weak get a higher pension and the better-off get a little less in return." In this regard, the respondents mentioned low-income earners, manual laborers, and those with health issues: "that the statutory pension system values the ordinary worker with heavy physical work more than an office worker" or "reasonable pension benefits to low-income earners/fair distribution—the bones are broken." Groups that are considered more privileged than others were also explicitly addressed. Thus, "childless people should pay for financially weaker contributors." There was also a wish for "more justice in social security, other types of income should also be subject to contributions"; "the contribution assessment ceiling should be abolished." [43]
Another significant matter was the respondents' emphasis on merit and work intensity. In statements like the following, it became evident how important it is to them that diligence and effort payoff: "then I would like to have differences [referring to the financial situation in old-age] between those who worked hard all their lives and the idlers who received social benefits and did nothing all their lives; it is absolutely necessary to distinguish between the two." This differentiation was also reflected in the juxtaposition of contributors and non-contributors: "if people have paid in their entire life, they should be better-off than those who have not." [44]
To summarize, the top-level category "solidarity" contains wishes concerning who should be contributing to the statutory pension system and which principles of justice are relevant for distributing benefits. There are competing attitudes about redistribution, meritocratic principles, and considerations of basic entitlements. It is also worth highlighting that there are multiple statements containing conditions for redistribution or a minimum pension. [45]
Reducing and standardizing the verbal data with codes was necessary in order to quantify the qualitative results and analyze them together with the quantitative data. This implies that the wealth of information was reduced to partial aspects in the joint analyses. Differences and nuances could be overlooked, and misinterpretations could arise. To counter this problem, we listed all the important topics of the sub- and top-level categories with examples in our coding guide and used this to support the joint analyses. [46]
5. Combining the Quantitative and Qualitative Strands: Life Courses and Wishes
In contrast to typical qualitative interviews, our data contained relatively little contextual information on the respondents, nor could the interviewers ask them to elaborate on their statements or explain them in more detail. By combining the qualitative and quantitative data, we could gain more information about the respondents, and could contextually embed their answers to the open-ended question. We could explore the preferences of specific social groups (e.g., gender, education, income, region) and of people with certain employment biographies. Drawing on the original statements, were able to analyze whether there were similarities or differences in emphasis and expression within and between the clusters (Section 3).12) [47]
To conduct joint analyses, we first had to compile the data set. The sequence/cluster analysis resulted in a typology of employment biographies stored as a numerical variable in the SPSS/Stata file. Each respondent was assigned a type. During the coding of the verbal data, we already prepared the quantification in our Excel file. Using the case IDs, we transferred the codings to the SPSS/STATA file as 40 binary numerical variables with the values 1 "mentioned" and 0 "not mentioned." Afterwards, we generated the top-level codes by merging related subcategories (see Table 1) into new variables. In addition, all original statements remained in our data set as string variables. [48]
To understand whether nonresponse was systematic, we first analyzed the response rates to the open-ended question by socio-demographic groups and cluster assignment in cross-tabulations. We found a significant difference in response rates between people with and without German nationality. Along with some minor differences, the already known problems of open-ended questions were confirmed: Item nonresponse was more likely among West Germans, those with a low level of education, people with a migration background, and without German citizenship. Comparing the nine clusters we also found differences in response behavior. The stronger the link to full-time employment with social security contributions, the higher the response rate. [49]
We then looked at the distribution of wishes and examined means tables for all individual and top-level categories. Overall, the differences in the main topics according to socio-demographic characteristics were not very pronounced, but some are worth mentioning. Rewarding child-rearing was predominantly an issue mentioned by women, but there was also an East-West difference: Compared to women from East Germany, almost twice as many women from West Germany expressed wishes relating to this topic. With a proportion of 21%, "earlier retirement age" seems a greater concern to East German women than to other social groups. By comparison, only 11% of West German males made statements on this topic. Unsurprisingly, the adjustment of Eastern to Western pensions was addressed exclusively by East Germans. East German women addressed the pension level very frequently (41%) compared to West German men (33%). We also identified a slight East-West difference regarding "mandatory statutory pension insurance for all." The proportion of those who would prefer one pension system for everyone is more than twice as high in East (16%) as in West Germany (7%). [50]
For deeper insights it would be helpful to not only examine bivariate differences with individual variables but to consider several variables simultaneously in multivariate models and to account for interaction effects. The brief description above also illustrates that the bivariate analyses provide a wealth of isolated information that is difficult to piece together into an overall picture. However, discussing multivariate analysis would go beyond the scope of this article. Instead, we focus on linking the clusters and wishes. [51]
Using a simple correspondence analysis,13) we could visualize the main characteristics in the distribution of wishes across clusters. Interpreting the correspondence biplot with the cluster descriptions and the coding guide made it easier for us to zoom in on relevant aspects.
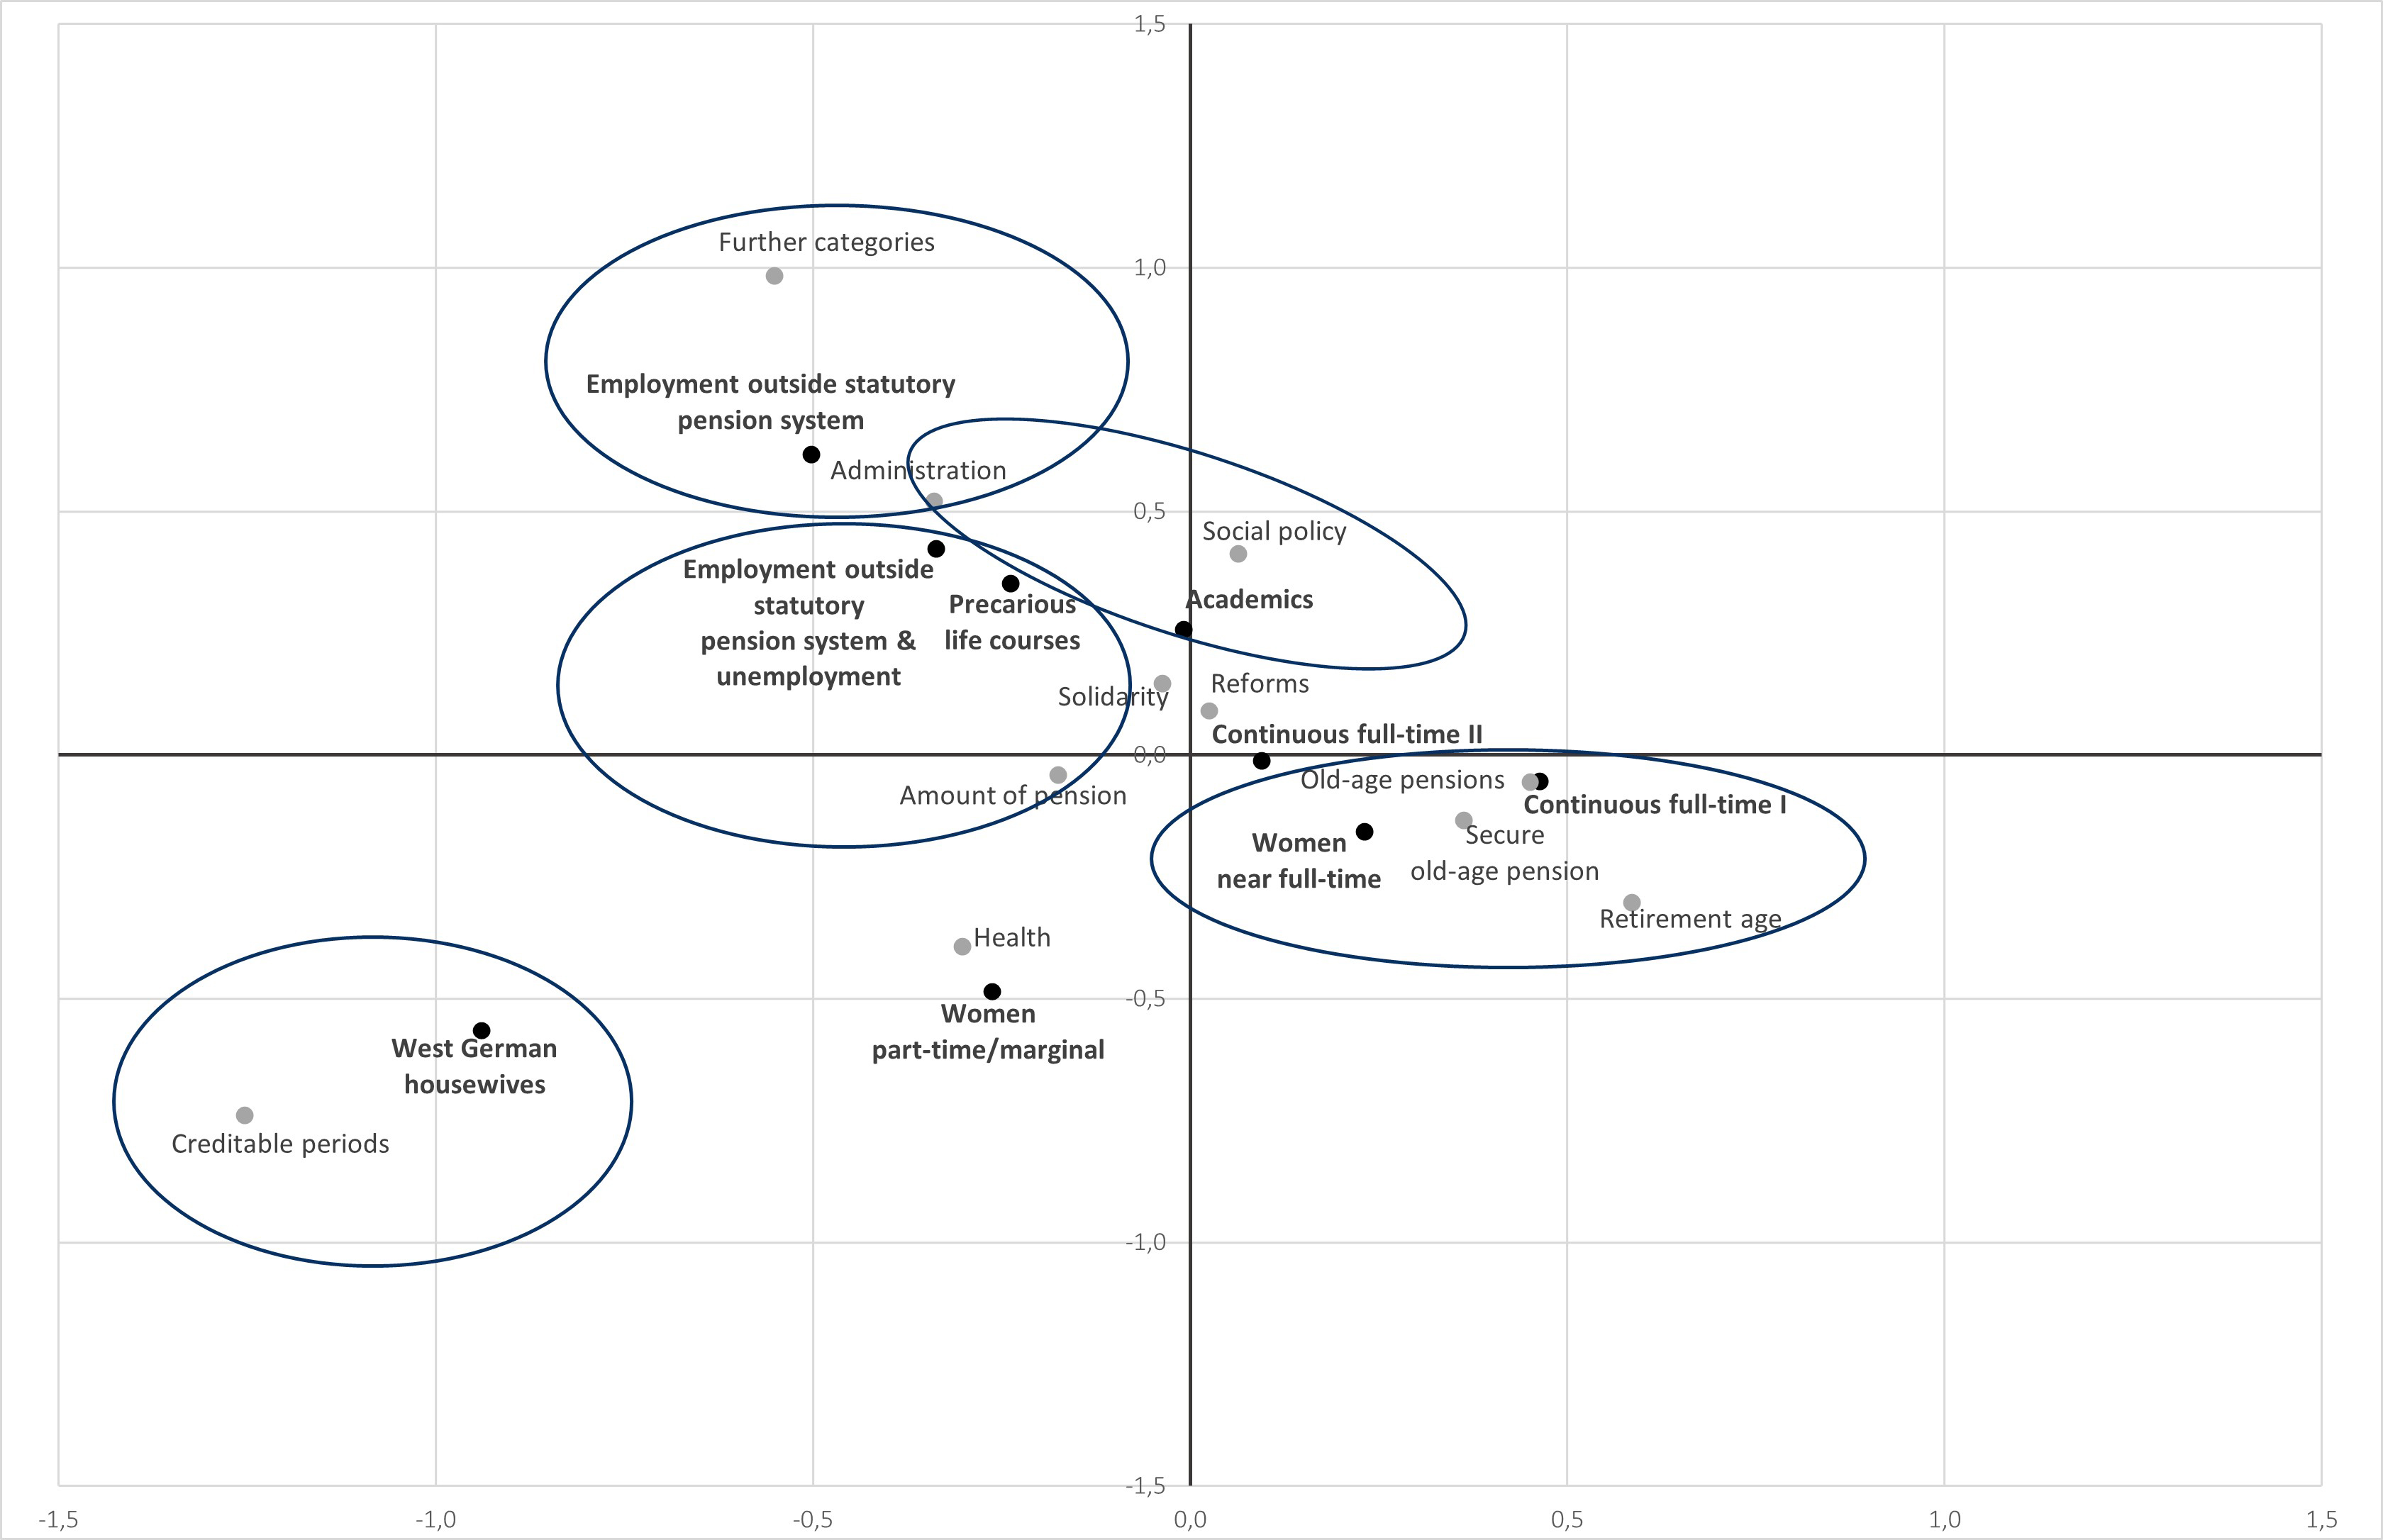
Figure 3: Clusters and wishes—two-dimensional correspondence biplot (Source: LeA; n = 6,252 cases for correspondence analysis [symmetrical normalization; two dimensions cover 88% of the variance (inertia)]). Please click here for an enlarged version of Figure 1. [52]
In Figure 3, a two-dimensional space covers 88% of the variance (= inertia in terms of correspondence analysis) in the data. The horizontal axis—covering 65% of the inertia—indicates the degree of employment subject to social security contributions. West German housewives with very little employment (negative value on the horizontal axis) and (male) continuous full-time employment (positive value) constitute opposites on this dimension. On the vertical axis (23% of the inertia), we identified different patterns of none or little employment subject to social security contributions. The two clusters that are essential for adjusting this dimension are West German housewives (negative value), who spent most of their working lives taking care of children and the family, and the employed outside the statutory pension system (positive value), who are closely linked to the labor market but are either in occupationally-specific or nonmandatory old-age pension schemes. By positioning the clusters in this two-dimensional space according to their frequencies in the top-level categories, we can determine which are substantially similar or different in their wish profiles and which wishes were named frequently by which cluster. [53]
For instance, West German housewives are distinguished from other clusters mainly by an above-average frequency of statements involving rewards for creditable pension periods. In contrast, women with near full-time employment and (male) continuous full-time employment I are relatively similar. Academics are more concerned than others with how statutory pension insurance is involved in social policy. They also show higher frequencies for reforms of the old-age security system and administrative issues. Within the two clusters, precarious life courses and employment outside the statutory pension system & unemployment, there are many statements on the "pension level/pension benefits." Almost every second person in these clusters commented on this. [54]
Finally, we returned to the qualitative data, and explored differences in the perceptions of distributive justice within and across clusters by comparing the original responses to the open-ended question in more depth. To illustrate this part of our analyses we selected the top-level categories "pension level/pension benefit" and "solidarity" and contrasted the three female-dominated clusters with academics and employment outside the statutory pension system. Joint displays (CRESWELL, 2015), i.e., the simultaneous presentation of qualitative and quantitative results, can be helpful during analysis and presentation to condense essential findings from the different components. Figures 4 and 5 are two examples of joint displays we developed. We included key points of the cluster descriptions and the state distribution plots for the quantitative component. For the qualitative component, we noted the thematic focus within the cluster and added illustrative statements for better understanding. [55]
Not surprisingly, issues such as better recognition of child-rearing periods or gender equality are fundamental within the three female-dominated clusters. However, the emphasis differs. West German housewives wish for pension benefits that are taken to guarantee financial independence from partners, children, or the state. For this reason, child-rearing periods or care work in general should receive more credit, i.e., result in higher pensions. Besides the demand for equality between women and men—equal wages and pension benefits—families with children are contrasted with childless/single people. Some respondents felt that the latter contribute less to society and should make compensatory payments (e.g., higher contributions to social security). [56]
For women with near full-time employment financial independence is equally essential, and pension benefits should provide enough money to live on. However, women in this cluster set themselves apart from "lazy people and idlers." Numerous statements point to this. Women in this cluster probably have to expend much energy on negotiating family and career issues and do not feel sufficiently valued financially and socially. In contrast to housewives, these women primarily wish for more recognition for their many years of paid near full-time work (in addition to family and care). Accordingly, they emphatically state that "lifelong work, care, and child-rearing" deserve more recognition and an adequate pension significantly higher than basic income support in old age. [57]
Among women in part-time and marginal employment, there was a strong focus on "provision" through their pension contributions. Many statements were expressed in the first person and thus refer to their own situation. Working all their lives, even if only part-time, should not have been in vain. They assessed redistribution positively, provided people have worked a lot but for low wages or are no longer able to work due to health problems. Like women in full-time employment, they were convinced that it is a remarkable achievement in life to balance a family and a career. They called for a clear gap in pension benefits between those who worked (hard) for many years and those who did not. [58]
The merit principle is also dominant among academic life courses (Figure 4) in different facets. Years of work, payment of social security contributions (regardless of the amount) and raising children (social contribution) are recognized achievements. A just pension must be high enough that people can live on it with dignity and without worries, and maintain their standard of living. Redistribution is justified if the individual is not to blame for undermining the merit principle, e.g., in the case of low-income earners and those with health issues. Most of the respondents in this cluster are highly educated, have a high household income, are SSC full-time employed, and support the statutory pension system with high contributions. To academics, it seemed unfair that other comparable social groups, e.g., civil servants, the self-employed, or the liberal professions (such as doctors), have their own schemes for old-age provision and evade their social responsibility. Consequently, there was a demand for the inclusion of other social groups in the statutory pension system.
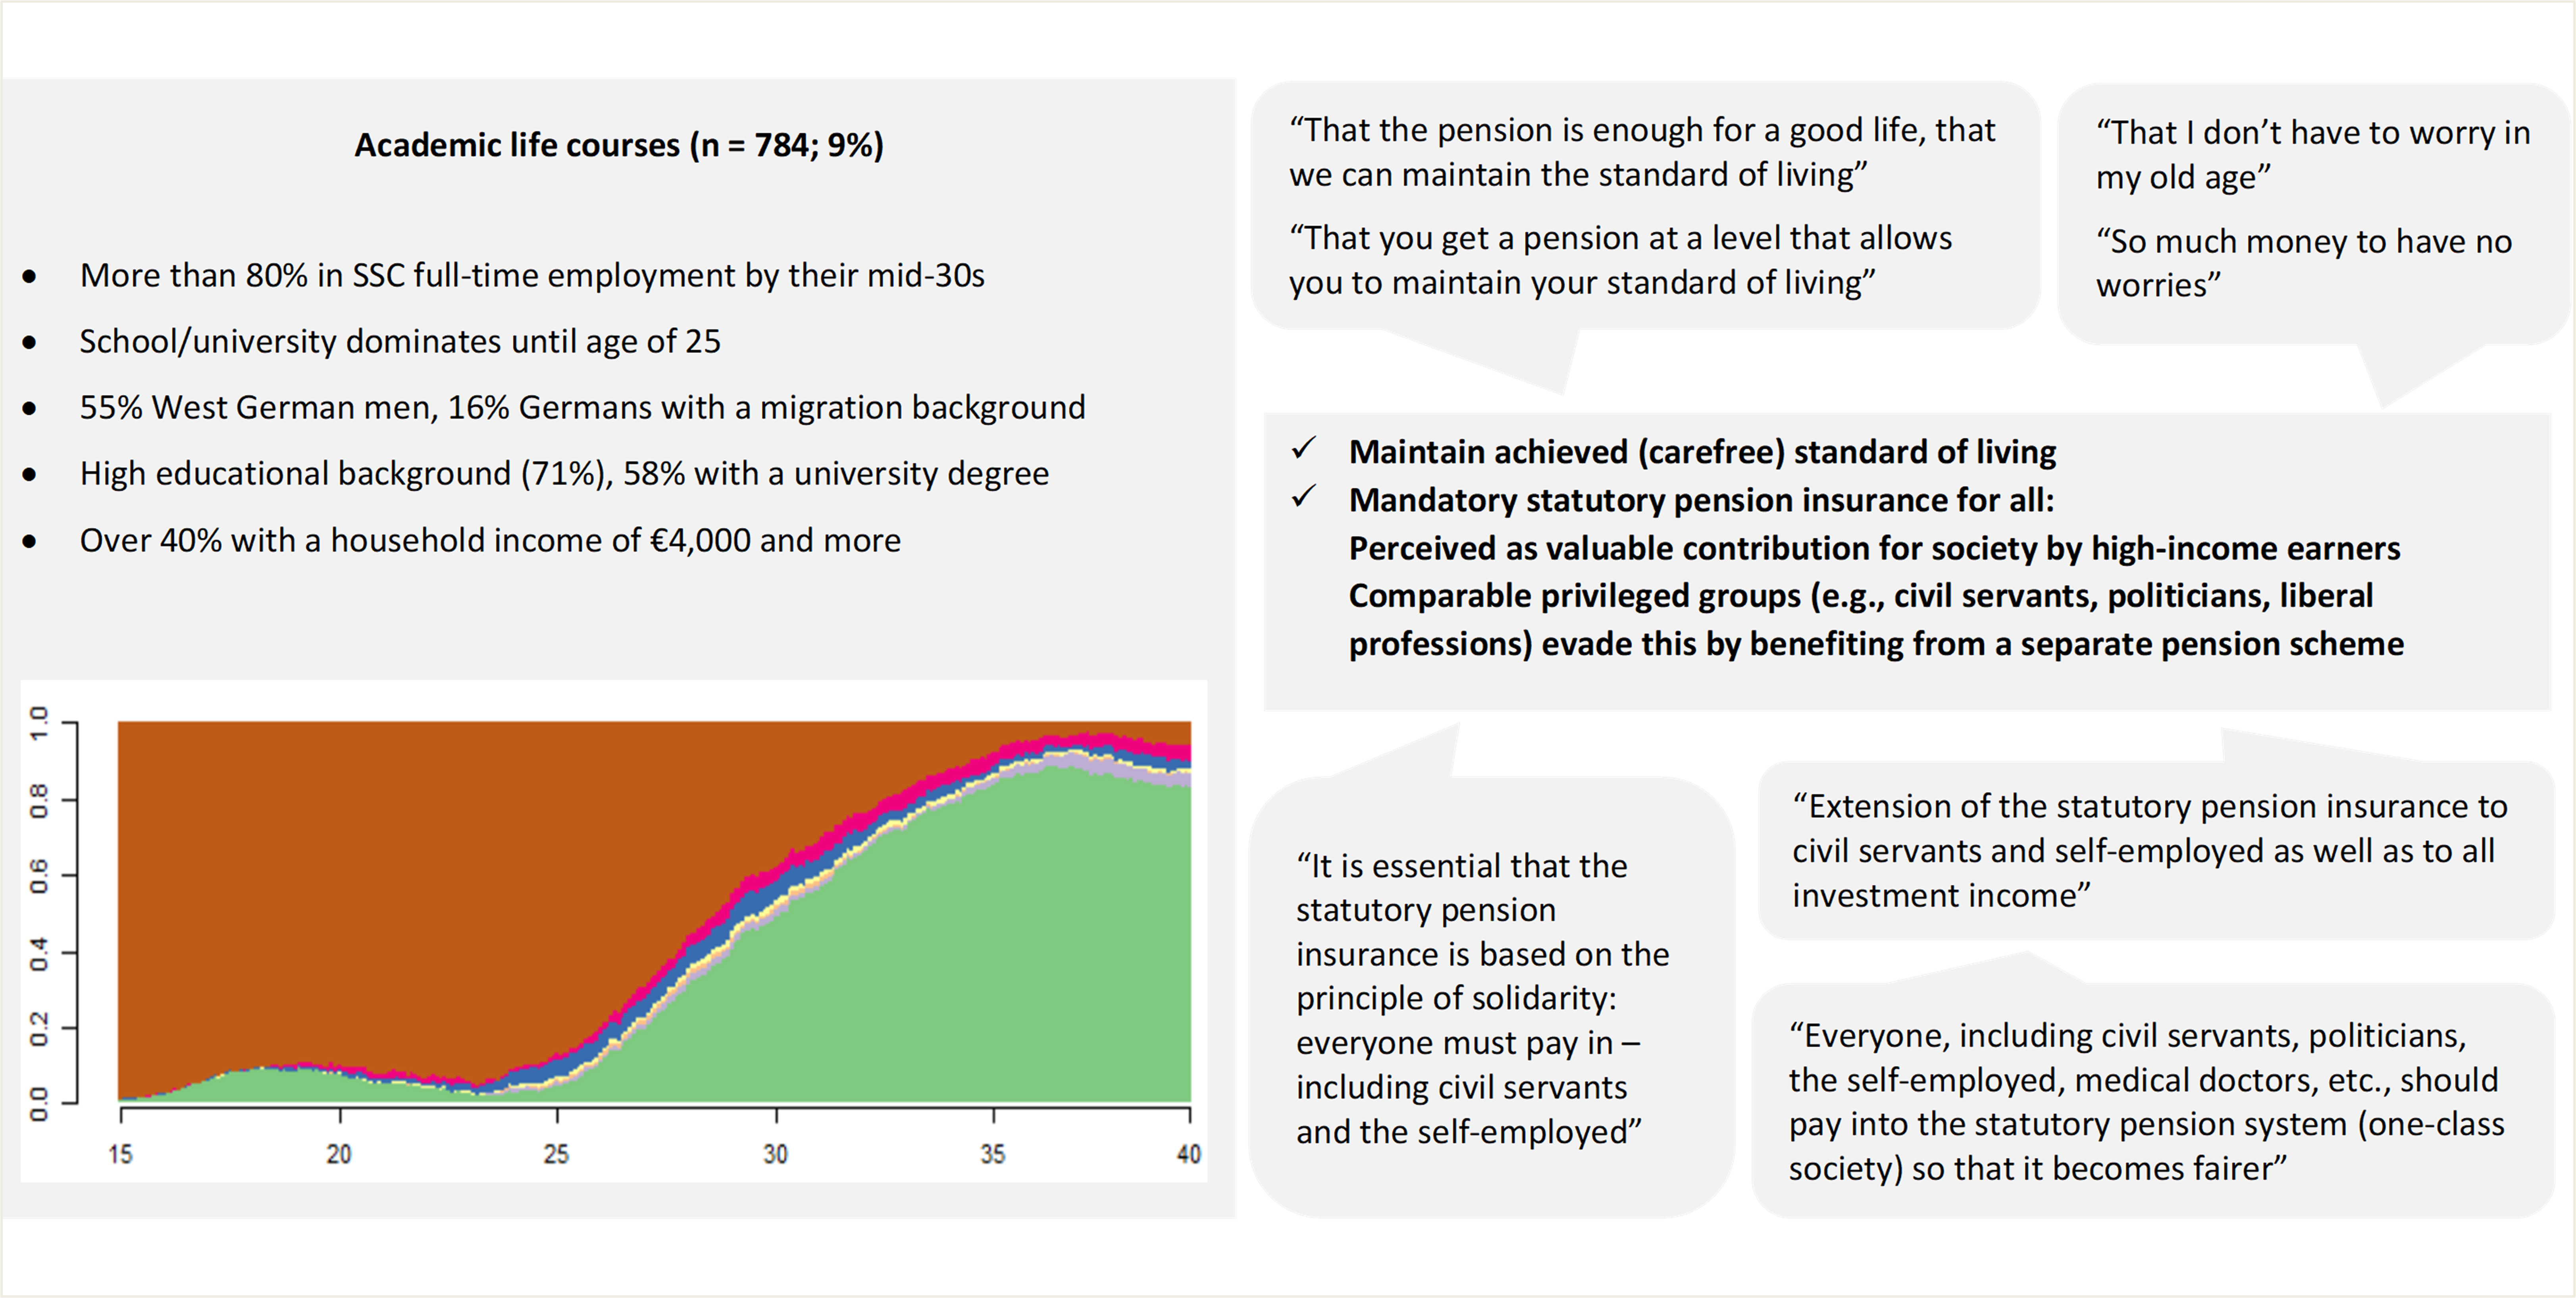
Figure 4: Joint display—Academic life courses (2) (Source: LeA; own illustration and translation). Please click here for an enlarged version of Figure 1.
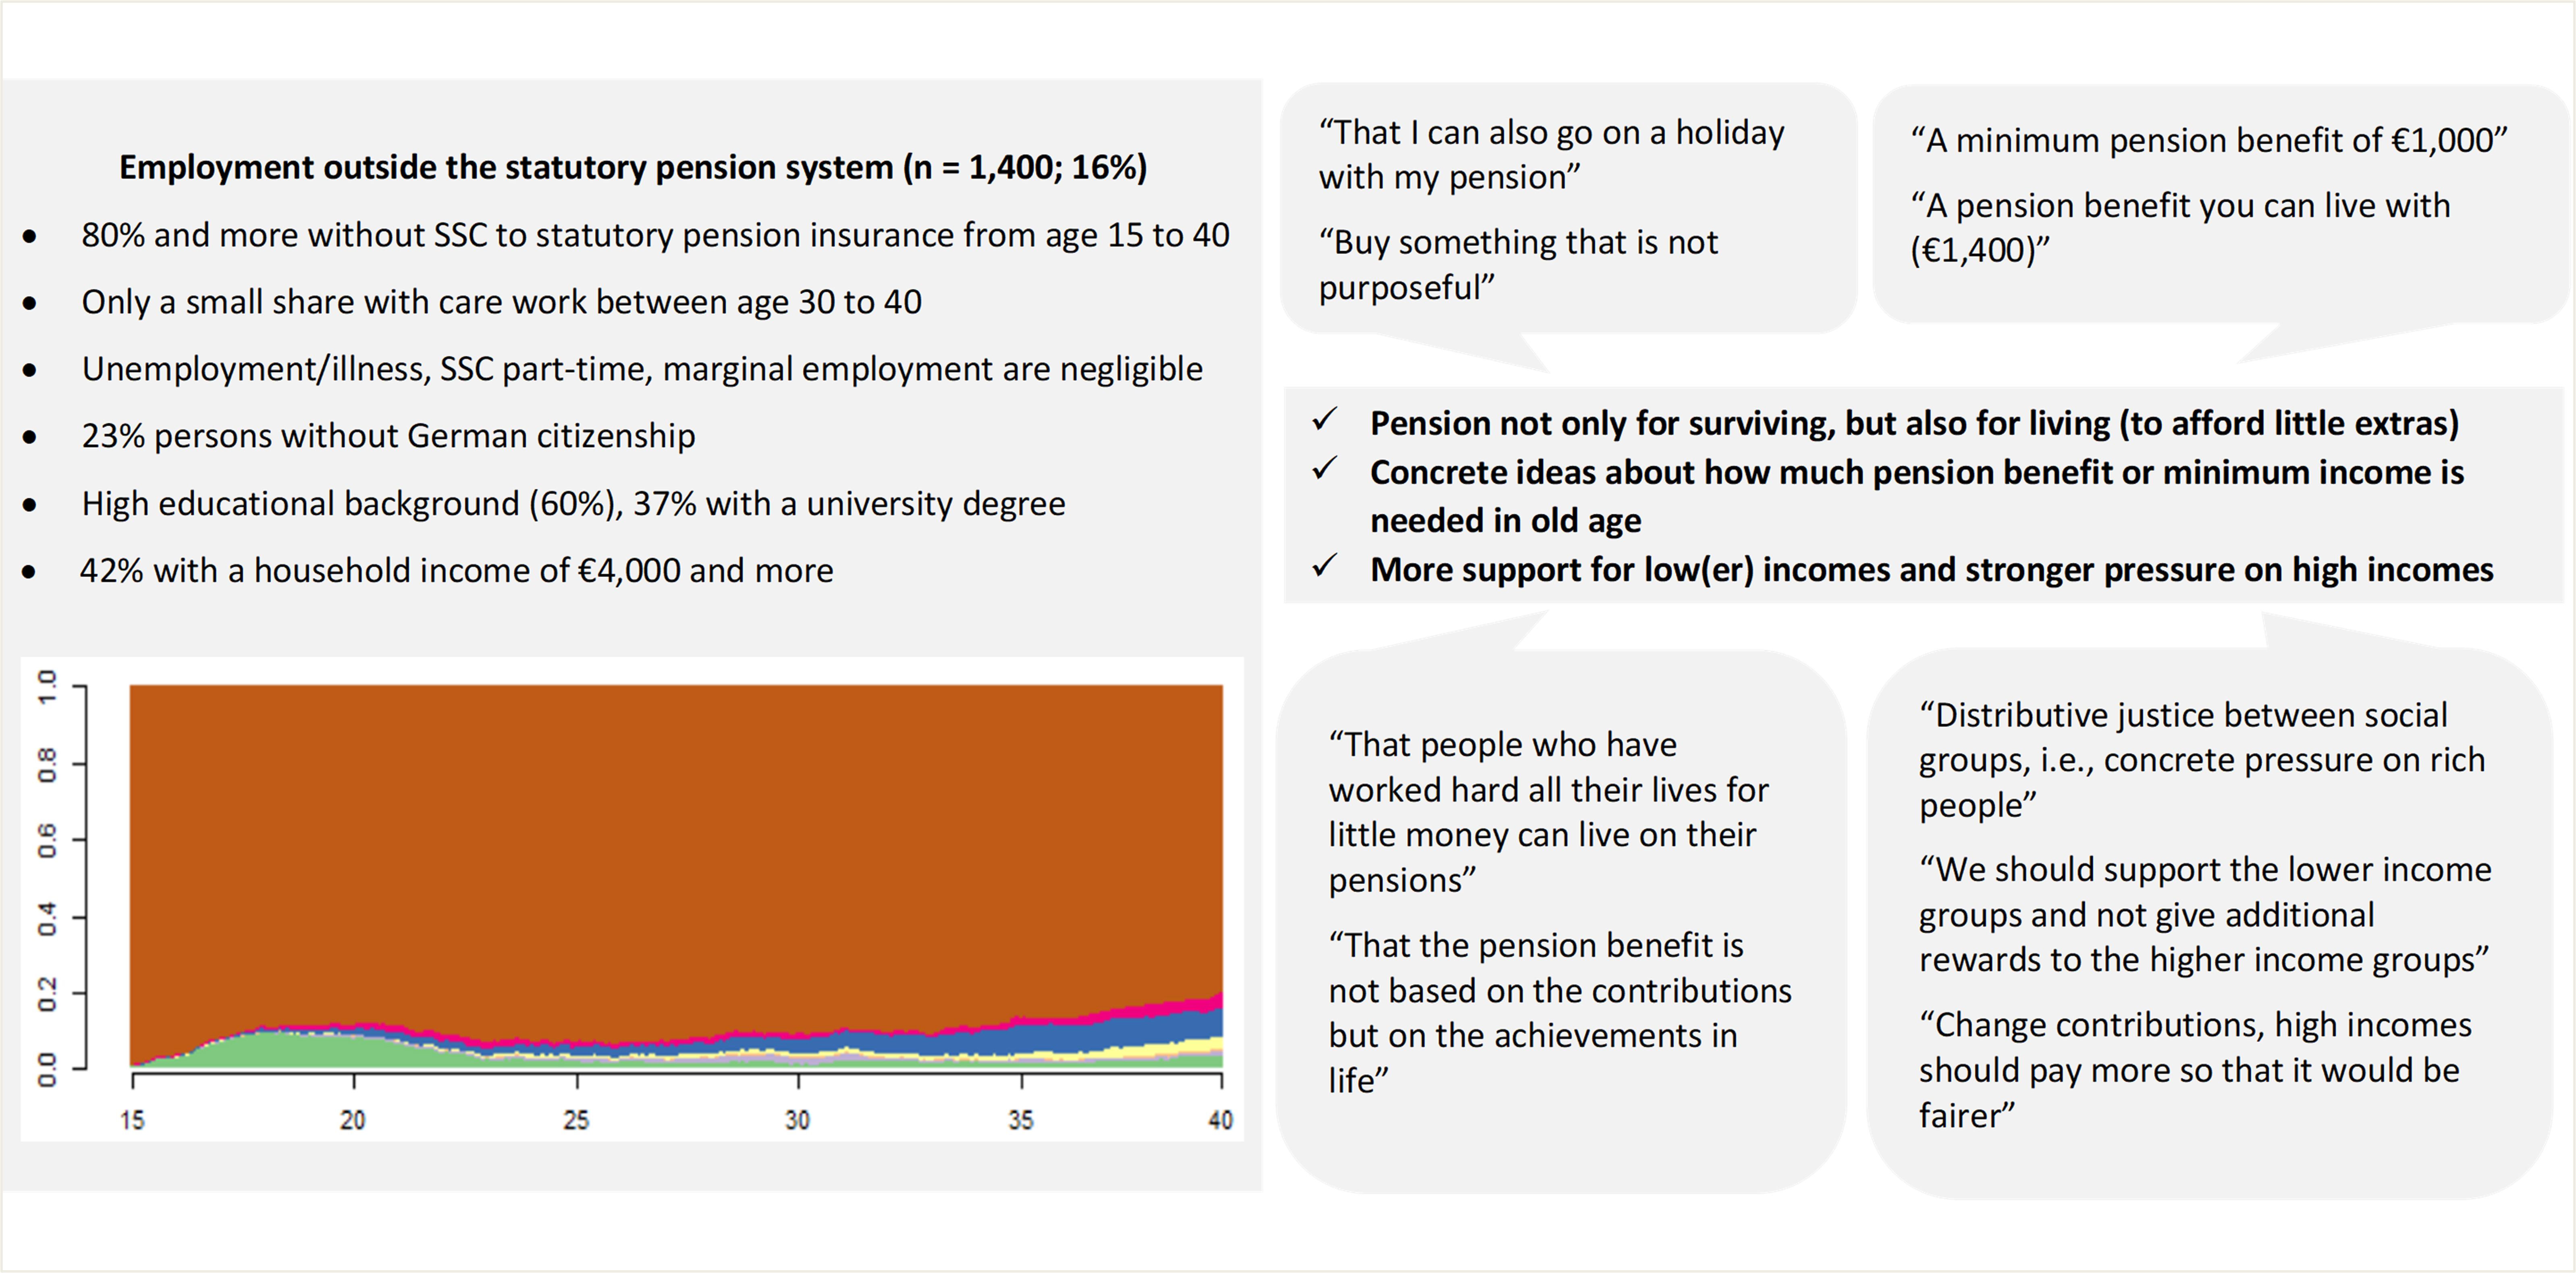
Figure 5: Joint display—Employment outside the statutory pension system (4) (Source: LeA; own illustration and translation). Please click here for an enlarged version of Figure 1. [59]
Within the cluster employment outside the statutory pension system (see Figure 5) two aspects are particularly relevant. First, the members of this cluster emphasized redistribution and social support for low(er) income earners much more than the other clusters. They demanded that "the rich or high incomes should be burdened more"; "if lower incomes are supported, higher ones should not be rewarded in return"; or "pension indexation should be a fixed amount rather than a percentage increase that widens the gap between rich and poor." In particular, the self-employed in this group may be at risk if they are not part of a specialized pension scheme. Maybe that is why they focused so intensely on a safety net or basic protection for the needy. Of all the clusters, they had the most concrete notion of how high pensions and basic income support should be. They refer to amounts between €800 and €3,000. [60]
Looking at the statements across the clusters, it becomes evident that Germans are very attached to the merit principle. But the respondents define merit quite differently, and merit can also be rewarded in various ways. However, this does not imply that redistribution is unimportant for the respondents. Quite the opposite, many statements from all clusters referred to redistribution. We noticed a close link between specific definitions of merit and the "fair" way in which redistribution should occur. In terms of merit, we also found that overall diligence and commitment to society were much more valuable to the respondents than mere financial contributions. For this reason, there was also a general preference for redistribution in favor of those who have tried to better themselves (e.g., low-income earners) or are not to blame for their unfavorable situation (e.g., health issues). Thus, the merit and redistribution principles are not mutually exclusive; on the contrary, the type of redistribution must fit the definition of merit. [61]
There is evidence that a person's individual biography influences their perspectives on merit. Based on personal history and social status, boundaries are drawn to other groups. When policymakers consider redistribution measures, they must correspond to specific notions of merit and redistribution, if they are to be perceived as socially just. Otherwise, it is very likely that the public will not accept them. [62]
In this respect, it can be stated that the life course influences attitudes toward social justice, but other factors, for instance, gender-specific and legal aspects or current events (e.g., migratory flows) as well as the focus of pension discourses also affect the perceptions of distributive justice. We have illustrated that, given someone's life course, when it comes to old-age provision, certain topics are more relevant than others. By applying a mixed methods approach we were able to elaborate on subtle differences which would otherwise be brushed over or go unnoticed. [63]
6. Conclusion and Recommendations
Using our specific research interest on just pensions, we have shown that open-ended questions can be more than just a human touch to the survey. Valuable additional information about respondents can be gained from them and there are various ways of combining them with other data. If researchers include open-ended questions in their questionnaire, they should plan the time required for a more in-depth analysis from the very start. It might also be beneficial to involve researchers with experience in qualitative or mixed methods research. These scholars not only provide valuable expertise for the analysis but could also support the development of the open-ended questions. Depending on the sample size, the number and scope of questions, and the response rate, the time required for analysis can be tremendous. Therefore, it is essential to consider the costs and benefits in advance and, if in doubt, to omit open-ended questions. [64]
To collect answers with minimal bias, we recommend making a short audio recording of the open part. In the case of CAPI interviews, this should be feasible. However, since extensive surveys with complicated topics such as old-age provision are usually conducted with the help of a lengthy questionnaire, the research team should ensure that the time needed for completing the survey is still reasonable. If there is time, interviewers could ask follow-up questions for clarification and record the answers. In this case, it would be necessary to explain to the interviewers during training what research interest is inherent in the open-ended question and how they should conduct this part of the survey. However, other content should not be neglected during interviewer training. [65]
Instead of interpreting the data with qualitative content analysis, researchers can also make use of (semi-)automated procedures like topic modeling to reveal valuable insights. Our recommendation, however, is to not rely on this alone if the data are very unstructured and consist of entirely unlimited topics. Otherwise, i.e., if a variable and its categories are narrowly specified, and classifications for coding may already exist, then these statistical procedures can be beneficial for analysis. We advocate a qualitatively-driven approach to analyzing open-ended questions, whether researchers conduct qualitative content analysis or use (semi-)automated techniques. Furthermore, as indicated above, scholars should not underestimate the time required for data preparation with any of these statistical methods. [66]
By analyzing the open-ended question, we learned that these data could represent a stand-alone part with valuable information in the context of a quantitative survey. The analysis is enriched when they are linked back to the quantitative part of the study in a mixed methods design. Open-ended questions, of course, are not the same as the established qualitative methods of data collection. Researchers cannot apply reconstructive methods such as the biographical method (ROSENTHAL & WORM, 2018) or hermeneutic interpretations (HERBRIK, 2018) to the material. The respondents' answers are not as profound and comprehensive as narrative interviews or ethnographies (PFADENHAUER, 2018). However, it is possible to use findings from the open-ended questions and combine them with other qualitative data and methods. Depending on the research interest, open-ended questions can also complement a quantitative study with a qualitative perspective. Compared to ethnographies or qualitative interviews, it is advantageous that the sample is the same, and therefore distributions and patterns can be related to distinct topics, if there is a reasonable response rate to the open-ended question. [67]
Without being able to give a fixed benchmark on this, we consider the response rate of almost 70% in our sample to be acceptable. The quantitative information can be considered context for the interpretation of the open-ended question and vice versa, but researchers must also reflect on known limitations, e.g., selective biases. The ability to express thoughts and opinions verbally influences responses as well. The fact that respondents did not mention several aspects does not necessarily mean that they do not matter, but merely that the issue did not come to mind in the specific situation. [68]
The respondents' answers need to be highly condensed in the qualitative analysis and quantified in order to merge them into a combined data set for joint analysis with the numerical data. In our example, we extracted 40 individual categories which, from our perspective, captured the most important aspects. Nevertheless, 40 individual categories are in most cases too detailed to be analyzed with survey data and the corresponding statistical procedures. We therefore further condensed the data at a considerable loss of information by grouping the individual categories into top-level codes. When conducting a mixed analysis, we recommend that researchers describe in-depth the finely defined aspects of the individual and top-level categories with examples in the coding guide. The coding guide should also be studied intensively for interpretation in the joint analysis of the quantitative and qualitative components. If this is not taken into account, researchers risk drawing false conclusions. For this reason, among others, we focus on exploratory quantitative statistical methods like sequence/cluster analysis as well as correspondence analysis, in order to acknowledge the qualitative perspective while mixing both types of data. [69]
Open-ended questions might not only be considered in the context of a standardized survey or research on a specific topic. Instead, deeper and more advanced analyses can be stimulated by the findings. For instance, we could add other process-produced data to complement a discourse analysis in our study. It is also possible to generate a sampling strategy for qualitative interviews or group discussions from the combination of clusters and coded wishes. The approach might be helpful to test items for a standardized survey to develop better scales for social justice dimensions, too. Finally, the findings could be used for other question designs such as vignettes (SCHRENKER, 2009). [70]
Open-ended questions are an established part of questionnaires and both respondents and researchers must be prepared to spend additional time on dealing with them. For this reason, it would be appropriate to devote more attention to the development and analysis of open-ended questions, to present illustrative examples of their use, and to reflect more methodologically on the topic. The latter aspect is particularly relevant considering the growth of new automated coding methods. [71]
1) Further information on the design and main results of the LeA study can be found in CZAPLICKI, FROMMERT and ZANKER (2019). <back>
2) The whole questionnaire was in German, and this is our translation of the open-ended question. We also translated the original verbal data presented in the following sections. In doing so, we tried to maintain the style of verbal expression and smoothed the sentences slightly. Since we conducted the analyses in German and the accuracy of our interpretations is not relevant for the main messages of this methodological contribution, we consider the translation to be unproblematic. The situation would be different if the insights gained from the analysis were to be explicitly foregrounded or if content analyses with data in multiple languages from cross-cultural studies were involved (for these particularities and challenges see e.g., REINKE DE BUITRAGO, 2019). <back>
3) If the text variable field contained the same or similar words/phrases, the interviewer entered them manually. This could mean three things: Firstly, the interviewees themselves used wordings that were identical or very similar; secondly, the interviewer reproduced what they understood with their own choice of words using a ready-made wording; and thirdly, the interviewer made up the answer. In our material, we found only about 60 similar statements with only slightly modified wording. Because of this relatively small number of cases, we did not see massive validity threats and decided to keep them in our analysis. <back>
4) In the context of mixed methodology, WITT (2001) briefly outlined the specifics of qualitative and quantitative data as well as different "Strategies in Qualitative and Quantitative Research". <back>
5) All episodes or states were recorded on a month-by-month basis from the age of 15. We restricted the analysis to the period between 15 and 40 years because, in 2016, the youngest interviewees were 40 years old. With this decision, we ensured that as much data as possible was available for analysis. Moreover, it is reasonable to stop at 40, since most people at that age are in relatively stable life course situations. <back>
6) We defined SSC part-time as up to 19 hours work per week, SSC near full-time to be 20 to 34 hours per week, and SSC full-time as 35+ hours per week. <back>
7) For more in-depth information on sequence and cluster analysis, see AISENBREY and FASANG (2010) or RITSCHARD and STUDER (2018). We used R to compute the sequence and cluster analysis. Here we refer to GABADINHO, RITSCHARD, MÜLLER and STUDER (2011) and GABADINHO, RITSCHARD, STUDER and MÜLLER (2010). <back>
8) The decision to choose nine clusters was based on comparisons of different solutions considering, among other things, the dendrogram, the degree of discrimination between the clusters, and whether the clusters could be interpreted in a meaningful way. The nine-cluster solution was most convincing for both methodological and substantive reasons. <back>
9) We were only permitted to analyze the data on computers in the offices of the German pension insurance. Unfortunately, due to IT security guidelines it was not possible to install and use a suitable software for qualitative data analysis (qda). <back>
10) In advanced quantitative methods of text analysis such as topic modeling (ANANDARAJAN et al., 2019), there are methods for avoiding that similar words with almost the same meaning are regarded as different, e.g., lemmatization and stemming. However, these procedures are very presuppositional and can lead to misinterpretations. <back>
11) People who expressed at least one wish. Multiple statements possible. <back>
12) For example, KELLE (2001) has convincingly demonstrated how certain phenomena can be understood better by combining structural quantitative life course data with qualitative interviews. <back>
13) Correspondence analysis is a procedure for discovering relationships between categorical variables. For a comprehensive overview see e.g., GREENACRE and BLASIUS (1994). <back>
Aisenbrey, Silke & Fasang, Anette E. (2010). New life for old ideas: The "second wave" of sequence analysis bringing the "course" back into the life course. Sociological Methods & Research, 38(3), 420-462, https://doi.org/10.1177/0049124109357532 [Accessed: January 6, 2023].
Anandarajan, Murugan; Hill, Chelsey & Nolan, Thomas (2019). Practical text analytics: Maximizing the value of text data. Cham: Springer.
Aschauer, Wolfgang; Seymer, Alexander; Weichbold, Martin; Herdin, Thomas & Röser, Andreas (2019). Lässt sich das Sicherheitsgefühl der Bevölkerung automatisiert erfassen?. Österreichische Zeitschrift für Soziologie, 44(S1), 67-96, https://link.springer.com/article/10.1007/s11614-019-00348-1 [Accessed: January 6, 2023].
Baur, Nina & Blasius, Jörg (Eds.) (2019). Handbuch Methoden der empirischen Sozialforschung. Wiesbaden: Springer VS.
Becker, Judith; Moser, Franziska; Fleßner, Maria & Hannover, Bettina (2019). Die Beobachter_innenübereinstimmung als Kompass bei der induktiven Kategorienbildung? Erfahrungen einer Forschungsgruppe mit der Auswertung von Interviewtranskripten. Forum Qualitative Sozialforschung / Forum: Qualitative Social Research, 20(3), Art. 28, http://dx.doi.org/10.17169/fqs-20.3.3383 [Accessed: January 6, 2023].
Creswell, John W. (2015). Revisiting mixed methods and advancing scientific practices. In Sharlene N. Hesse-Biber & R. Burke Johnson (Eds.), The Oxford handbook of multimethod and mixed methods research inquiry (pp.57-71). New York, NY: Oxford University Press.
Czaplicki, Christin; Frommert, Dina & Zanker, Dagmar (2019). Die Studie "Lebensverläufe und Altersvorsorge" (LeA) im Überblick. Deutsche Rentenversicherung, 74(1), 25-50.
Fielding, Jane; Fielding, Nigel & Hughes, Graham (2013). Opening up open-ended survey data using qualitative software. Quality & Quantity, 47(6), 3261-3276.
Fietz, Jennifer & Friedrichs, Jürgen (2019). Gesamtgestaltung des Fragebogens. In Nina Baur & Jörg Blasius (Eds.), Handbuch Methoden der empirischen Sozialforschung (pp.813-828). Wiesbaden: Springer VS.
Franke, Janna & Simonson, Julia (2018). Social justice beliefs regarding old-age provisions in Germany: A latent profile analysis. Social Justice Research, 31(2), 182-205.
Gabadinho, Alexis; Ritschard, Gilbert; Müller, Nicolas S. & Studer, Matthias (2011). Analyzing and visualizing state sequences in R with TraMineR. Journal of Statistical Software, 40(4), 1-37, https://doi.org/10.18637/jss.v040.i04 [Accessed: January 6, 2023].
Gabadinho, Alexis; Ritschard, Gilbert; Studer, Matthias & Müller, Nicolas S. (2010). Mining sequence data in R with the TraMineR package: A user's guide. Technical Report, University of Geneva, Switzerland, http://mephisto.unige.ch/pub/TraMineR/doc/TraMineR-Users-Guide.pdf [Accessed: January 6, 2023].
Geer, John G. (1988). What do open-ended questions measure?. Public Opinion Quarterly, 52(3), 365-371.
Geer, John G. (1991). Do open-ended questions measure "salient" issues?. Public Opinion Quarterly, 55(3), 360-370.
Gideon, Lior (2012). Handbook of survey methodology for the social sciences. New York, NY: Springer.
Greenacre, Michael J. & Blasius, Jörg (Eds.) (1994). Correspondence analysis in the social sciences. London: Academic Press.
He, Zhoushanyue & Schonlau, Matthias (2020). Automatic coding of open-ended questions into multiple classes: Whether and how to use double coded data. Survey Research Methods, 14(3), 267-287, https://doi.org/10.18148/srm/2020.v14i3.7639 [Accessed: January 6, 2023].
He, Zhoushanyue & Schonlau, Matthias (2021). Coding text answers to open-ended questions: Human coders and statistical learning algorithms make similar mistakes. Methods, Data, Analyses (mda), 15(1), 103-121, https://doi.org/10.12758/mda.2020.10 [Accessed: January 6, 2023].
Herbrik, Regine (2018). Hermeneutische Wissenssoziologie (sozialwissenschaftliche Hermeneutik). In Leila Akremi, Nina Baur, Hubert Knoblauch & Boris Traue (Eds.), Handbuch interpretativ forschen (pp.659-680). Weinheim: Beltz.
Hoxtell, Annette (2019). Automation of qualitative content analysis: A proposal. Forum Qualitative Sozialforschung / Forum: Qualitative Social Research, 20(3), Art. 15, http://dx.doi.org/10.17169/fqs-20.3.3340 [Accessed: January 6, 2023].
Jäckle, Sebastian (2017). Sequenzanalyse. In Sebastian Jäckle (Ed.), Neue Trends in den Sozialwissenschaften. Innovative Techniken für qualitative und quantitative Forschung (pp.333-363). Wiesbaden: Springer VS.
Kelle, Udo (2001). Sociological explanations between micro and macro and the integration of qualitative and quantitative methods. Forum Qualitative Sozialforschung / Forum: Qualitative Social Research, 2(1), Art. 5, https://doi.org/10.17169/fqs-2.1.966 [Accessed: January 6, 2023].
König, Pascal D. & Jäckle, Sebastian (2017). Clusteranalyse. In Sebastian Jäckle (Ed.), Neue Trends in den Sozialwissenschaften. Innovative Techniken für qualitative und quantitative Forschung (pp.51-84). Wiesbaden: Springer VS.
Kuckartz, Udo (2019). Qualitative text analysis: A systematic approach. In Gabriele Kaiser & Norma Presmeg (Eds.), Compendium for early career researchers in mathematics education (pp.181-197). Cham: Springer, https://doi.org/10.1007/978-3-030-15636-7_8 [Accessed: January 6, 2023].
Lemke, Matthias & Wiedemann, Gregor (2016). Text Mining in den Sozialwissenschaften. Wiesbaden: Springer VS.
Liebig, Stefan & Sauer, Carsten (2016). Sociology of justice. In Clara Sabbagh & Manfred Schmitt (Eds.), Handbook of social justice theory and research (pp.37-60). New York, NY: Springer.
Little, Todd D. (Ed.) (2013a). The Oxford handbook of quantitative methods: Volume 1: Foundations. New York, NY: Oxford University Press.
Little, Todd D. (Ed.) (2013b). The Oxford handbook of quantitative methods: Volume 2: Statistical analysis. New York, NY: Oxford University Press.
Lorenz, Walter (2014). The emergence of social justice in the West. In Michael Reisch (Ed.), The Routledge international handbook of social justice (pp.14-26). London: Routledge.
Pfadenhauer, Michaela (2018). Lebensweltliche Ethnographie. In Leila Akremi, Nina Baur, Hubert Knoblauch & Boris Traue (Eds.), Handbuch interpretativ forschen (pp.562-579). Weinheim: Beltz.
Rädiker, Stefan & Kuckartz, Udo (2020). Offene Survey-Fragen mit MAXQDA analysieren. Berlin: MAXQDA Press, https://doi.org/10.36192/978-3-948768010 [Accessed: January 6, 2023].
Reinke de Buitrago, Sybille (2019). Conducting qualitative content analysis across languages and cultures. Forum Qualitative Sozialforschung / Forum: Qualitative Social Research, 20(3), Art. 19, http://dx.doi.org/10.17169/fqs-20.3.3384 [Accessed: January 6, 2023].
Riebling, Jan R. (2019). Methode und Methodologie quantitativer Textanalyse. Dissertation, Bamberger Beiträge zur Soziologie 18, University of Bamberg Press, Germany, https://fis.uni-bamberg.de/bitstream/uniba/45106/1/BBzS18RieblingDissopusse_A3a.pdf [Accessed: January 6, 2023].
Ritschard, Gilbert & Studer, Matthias (Eds.) (2018). Sequence analysis and related approaches: innovative methods and applications. Cham: Springer, https://doi.org/10.1007/978-3-319-95420-2 [Accessed: January 6, 2023].
Rosenthal, Gabriele & Worm, Arne (2018). Biographieforschung und Narrationsanalyse. In Leila Akremi, Nina Baur, Hubert Knoblauch & Boris Traue (Eds.), Handbuch interpretativ forschen (pp.828-857). Weinheim: Beltz.
Schonlau, Matthias & Couper, Mick P. (2016). Semi-automated categorization of open-ended questions. Survey Research Methods, 10(2), 143-152, https://doi.org/10.18148/srm/2016.v10i2.6213 [Accessed: January 6, 2023].
Schrenker, Markus (2009). Warum fast alle das deutsche Rentensystem ungerecht finden, aber trotzdem nichts daran ändern möchten. Die Wahrnehmung gerechter Renten und die Akzeptanz von Rentenreformen. Kölner Zeitschrift für Soziologie und Sozialpsychologie, 61(2), 1-24.
Schröder, Martin & Vietze, Florian (2015). Mediendebatten über soziale Ungleichheit, Armut und soziale Gerechtigkeit seit 1946 und wie sie mit Einkommensungleichheit zusammenhängen. Zeitschrift für Soziologie, 44(1), 42-62, https://doi.org/10.1515/zfsoz-2015-0105 [Accessed: January 6, 2023].
Singer, Eleanor & Couper, Mick P. (2017). Some methodological uses of responses to open questions and other verbatim comments in quantitative surveys. Methods, Data, Analyses (mda), 11(2), 115-134, https://doi.org/10.12758/mda.2017.01 [Accessed: January 6, 2023].
Studer, Matthias (2013). Weighted cluster library manual: A practical guide to creating typologies of trajectories in the social sciences with R. LIVES Working Paper No. 24, Lausanne, Switzerland, http://dx.doi.org/10.12682/lives.2296-1658.2013.24 [Accessed: January 6, 2023].
Vietze, Florian (2018). Die marktliberale Wende in 70 Jahren Medienberichterstattung: Welche Deutungsmuster den medialen Diskurs um soziale Gerechtigkeit bestimmen. Zeitschrift für Sozialreform, 64(2), 129-161.
Witt, Harald (2001). Strategies in qualitative and quantitative research. Forum Qualitative Sozialforschung / Forum: Qualitative Social Research, 2(1), Art. 8, https://doi.org/10.17169/fqs-2.1.969 [Accessed: January 6, 2023].
Zuell, Cornelia & Scholz, Evi (2015). Who is willing to answer open-ended questions on the meaning of left and right?. Bulletin of Sociological Methodology/Bulletin de Méthodologie Sociologique, 127(1), 26-42, https://doi.org/10.1177/0759106315582199 [Accessed: January 6, 2023].
Dr. Leila AKREMI is a senior advisor at the department for research and development of the German Federal Pension Insurance. In her research she focuses on methods of social research (especially sampling, process-generated data and mixed methods), old-age provision and risk research.
Contact:
Dr. Leila Akremi
German Federal Pension Insurance
Department for Research and Development
Konstanzer Str. 42, 10709 Berlin, Germany
E-mail: leila.akremi@drv-bund.de
Dagmar ZANKER is a scientific advisor at the department for research and development of the German Federal Pension Insurance. In her research she focuses on life course research (especially late working life and entering retirement), old-age provision and social inequalities.
Contact:
Dagmar Zanker
German Federal Pension Insurance
Department for Research and Development
Konstanzer Str. 42, 10709 Berlin, Germany
E-mail: dagmar.zanker@drv-bund.de
Akremi, Leila & Zanker, Dagmar (2023). Mixing standardized administrative data and survey data with qualitative content analysis in longitudinal designs: Perceptions of justified pensions and related life courses [71 paragraphs]. Forum Qualitative Sozialforschung / Forum: Qualitative Social Research, 24(1), Art. 16, http://dx.doi.org/10.17169/fqs-24.1.4003.

Creative Commons Attribution 4.0 International License