

Volume 3, No. 2, Art. 27 – May 2002
Processing of Verbal Data and Knowledge Representation by GABEK®-WinRelan®1)
Josef Zelger & Andreas Oberprantacher
Abstract: Diffuse as well as specific information is not solely found in organizations, but it also sprawls all over the Internet. In our article we will show how scattered linguistic knowledge can be selected, processed and structured with the aid of the software WinRelan to promote a holistic understanding of complex social phenomena and to facilitate decision-making that is accepted and supported by those concerned. Based on this problem-oriented background the method GABEK (GAnzheitliche BEwältigung von Komplexität—holistic processing of complexity, © Josef ZELGER, Innsbruck, 1990-2002) was developed and implemented in the software program WinRelan (Windows Relation Analysis © Josef ZELGER, Innsbruck). WinRelan facilitates the analysis of large unstructured and controversial everyday language data samples. Automated, computerized steps of data processing are accompanied by the semantic work of the researcher. WinRelan offers different PC-supported operations, whereby each of these procedures leads to the integration and linkage of the multi layered distributed knowledge of the people concerned. Results are conceptual knowledge systems, empirical generalizations, cognitive concepts, causal assumptions and value systems in the form of hierarchically ordered text groups, association graphs, evaluation profiles, cause-effect structures, relevance lists, etc. The procedure is applied in theory construction as well as for the purpose of providing orientation and in preparing decision processes in organizations.
Key words: GABEK, WinRelan, knowledge organization, qualitative research, qualitative approaches, qualitative methodologies, organizational culture
Table of Contents
1. GABEK: A PC-supported Method for the Qualitative Analysis of Normal Language Texts
2. WinRelan: The Software for GABEK-Applications
3. Defining Text-Units and Object-Linguistic Coding. The Representation of Verbal Data by Means of an Indexing System
4. Analysis of Association Graphs. The Representation of Conceptual Structures
5. Meta-Linguistic Coding. Representation of Statistical Frequencies
6. Coding of Evaluations. The Representation of Assessments by Means of an Evaluation Profile (Lists)
7. Causal Coding. The Representation of Causal Assumptions by Network Graphics
8. The Gestalt-Building Process. The Representation of the Verbal Data by Linguistic Gestalten
9. Relevance Criteria. The Representation of the Order of Relevance
10. Project Comparison. The Simulation of Dialogues
11. Conclusion
1. GABEK: A PC-supported Method for the Qualitative Analysis of Normal Language Texts
Different opinions of people in complex social organizations represent a valuable and flexible knowledge pool, combining tacit knowledge and social experience. For the systematic analysis and representation of this knowledge a method is required that shows the connections that exist between the opinions of different individuals. [1]
In order to collect and systematize the unordered, but potentially significant knowledge of members of an organization or interest group, the research procedure GABEK (Holistic processing of linguistic complexity, ã Josef ZELGER, Innsbruck 1990-2002) was developed at the Department of Philosophy of the Leopold-Franzens-University Innsbruck. [2]
According to a specific philosophical concept of comprehension and explanation, verbal data is first represented as a formal indexing system which can be printed in form of a list (see Section 3) and is then processed by means of multidimensional content analysis. [3]
The indexing system allows different forms of (graphical) representation of linguistic knowledge, all of which can be used for interactive inquiries on the PC and exported into Word for Windows:
the representation of conceptual structures is useful for the analysis of notions within a social context and for the construction of mindmaps on the basis of verbal data (see Section 4);
the representation of statistical data related to the verbal data (see Section 5);
the representation of assessments is the result of extracting and converting positive, negative and ambivalent evaluations contained in the text units into comprehensible listings (see Section 6);
the representation of causal assumptions in form of complex cause-effect graphs is made possible by formalizing the conjectures contained within the texts (see Section 7);
the representation of linguistic gestalten. These are meaningful text groups containing 3 to 9 text units which are coherent and fulfill certain syntactic and semantic rules. A gestalten tree gives the hierarchical order of gestalten (see Section 8);
the combination of the last three allows a representation of the order of relevance of the topics discussed within the document (see Section 9). [4]
These manifold forms of representation of linguistic knowledge enable the user to understand controversial groups in their uniqueness by simulation of dialogues (see Section 10), to study them in a comparative manner and to prepare common grounds for action. [5]
Every step of the evaluation can be reconstructed and intersubjectively verified. All the results of these operations can be exported to Word for Windows and printed in a preformatted way. Projects carried out in the field of conflict resolution, innovation studies, "bottom-up" marketing, social or regional development illustrate the practical value of GABEK and emphasize the many areas of application. [6]
The standard procedures of a GABEK-project are illustrated in Figure 1 below. The numbers next to the arrows refer to the sections of the article.
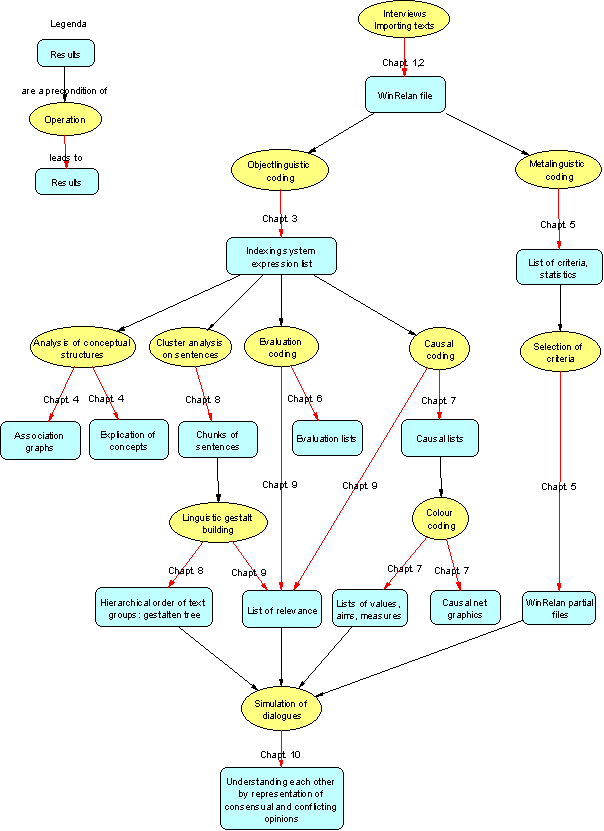
Figure 1: The operations together with their results are described in the sections indicated by the red arrows [7]
With regard to various aspects, GABEK is more than a qualitative procedure for text analysis; it is a procedure that departs from concrete problem definitions and goes on to analyze the depth structure of verbally expressed opinions and world views. Thus, common basic values, targets and possible measures are made evident. Sets of options for action are obtained from an analysis of the assumptions concerning relations between causes and effects. The latter are expressed in the verbal database. Through these it is possible to better understand the current situation of the community investigated, it is possible to point out possible processes of change according to the basic values and main goals of the respondents and initiate their implementation. It is always a target of the GABEK procedure to improve the mutual understanding and communication in the community investigated. [8]
2. WinRelan: The Software for GABEK-Applications
In order to master extensive verbal data and the resulting complexity, the software implementation of the GABEK method, WinRelan was developed. It allows the realization of the particular steps of analysis intended by the GABEK procedure, and at the same time, it is an intelligent knowledge look-up and presentation system that also facilitates the interactive presentation of the results. Complex realizations of conceptual knowledge systems are translated into represented serially knowledge units, which can be queried interactively. This enables organizations to learn. [9]
WinRelan—programmed in Visual Basic 6.0—runs on PCs with at least 64 MB RAM and needs Windows 95, 98 or Windows NT4 and Microsoft Word 97 or 2000 to be installed. [10]
If WinRelan is started and a WinRelan document is loaded, then all the relevant data and the state of the loaded project is shown in the WinRelan window. Most sub-programs can be started via icons in the icon bar of the WinRelan window.
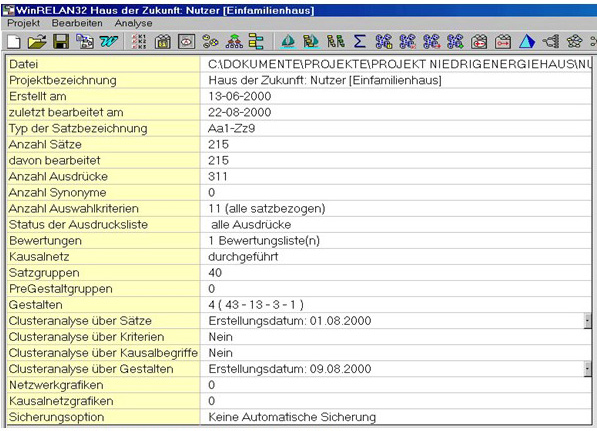
Figure 2: The WinRelan window with a loaded project2) [11]
In Figure 2, the project "Acceptance Improvement of Low-energy Building Components as a Mutual Learning Process of Manufacturers and Users" (ROHRACHER et al. 2001) will be used as an example to illustrate the GABEK procedure. [12]
The aim of the project was to explore the pro- and counterarguments concerning combined ventilation and heating systems brought forward by users and non-users of such houses. The results of the study were used for technical improvements and for developing a marketing strategy. [13]
Users of ventilation systems and non-user were asked open questions about their experiences. The first group was divided into inhabitants of either single- or multi-family houses:

Table 1: Subdivision of interviewees into users and non-users of houses with low-energy building components [14]
A manual with open questions was developed which gave the respondents opportunity to describe their personal experiences, as well as their desires and needs in their own words. In addition, open questions facilitate the indirect expression of "tacit knowledge" (POLANYI 1969), i.e. knowledge that is acquired by experience and that is used but never communicated to others directly. [15]
The interviews were recorded on tape, transcribed and divided into meaningful text units. After subdivision into text units, these are transferred automatically to the PC program WinRelan. The central operations are shown in Figure 1. [16]
3. Defining Text-Units and Object-Linguistic Coding. The Representation of Verbal Data by Means of an Indexing System
In order to construct a meaningful order from the unsorted text units of both groups, inhabitants of single- and multi-family houses with ventilation systems of low-energy buildings, we need an indexing system. Such an indexing system will allow for different forms of (graphical) representation of linguistic knowledge, all of which can be used for interactive inquiries on the PC and can be exported into Word for Windows. [17]
The development of an efficient indexing system requires two substantial operations: first of all we must determine what a "text" should be, i.e. the text units must be established. Such units should be meaningful short sections, which form a mental unit, like a spoken record or a short spoken sense unit. Secondly, the content- relevant lexical terms must be identified in each text unit. These are used as key terms in the coding operation.3)
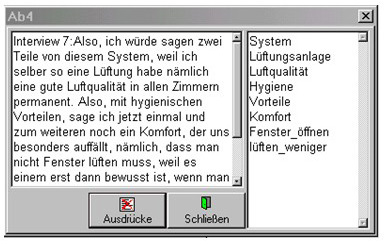
Figure 3: The text unit "Ab4" with key terms [18]
"Text units" or "sense units" are not to be understood as mere formal units, but as meaningful, coherent thoughts, which represent a comprehensible unit containing at least three and at the most nine relevant lexical concepts. (For the theoretical prerequisites of the Procedure GABEK see cf. ZELGER 1991, 1994, 1995, 1999a, 1999b, 1999c, 2000b.) [19]
The identification of key concepts occurring in the text units is referred to as object-linguistic coding. In this way, an indexing system is developed which can be represented as a formal network of expressions. However, on the PC the indexing system appears in form of a list, which can be arranged alphabetically or according to frequencies. The list serves principally for the elimination of synonyms and homonyms.
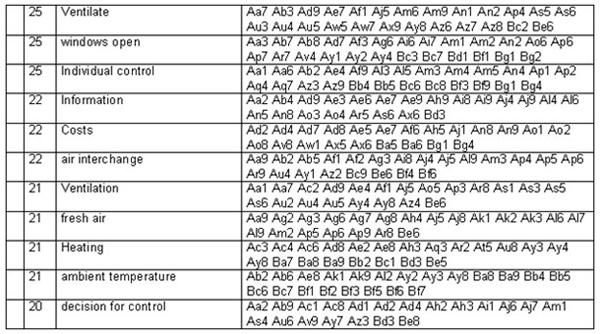
Table 2: Extract from the printout list of the users of ventilation systems in multi-family houses [20]
The indexing system enables the user to find all further texts within the verbal database that refer to the relevant term and in which the term also occurs. It permits the user to identify all further texts that are in any way connected to the given text, so that they can be understood as content supplementations of the text initially read. [21]
4. Analysis of Association Graphs. The Representation of Conceptual Structures
If these two operations (the definition of text units and object-linguistic coding) are executed on all available text passages in a consistent way, an association graph can automatically be produced by WinRelan. The graph highlights all the terms with which any selected item in the coded text material is connected, and it indicates all the records in which such connections occur. For terms used in the verbal database, the association graph generally provides a basis for mindmaps and for the structuring of contents. Furthermore, the association graph can serve as a starting point for definitions and the explication of terms. If verbal data are available from different time periods, the development of terms can also be examined. [22]
According to WITTGENSTEIN, the meaning of a term is given by its use in a language game in a concrete environment. Therefore, the meaning of important terms that emerge in the course of discussions can be reconstructed on the basis of all the interview texts in which the term was used. They are exactly the ones, which are always invariably or logically associated with the definiendum. This means that everyone who understands the language and uses the definiendum correctly links the appropriate terms of the definiens with the definiendum—even if this does not always happen consciously or explicitly. [23]
Now we try to reconstruct the meaning of a term, the definiendum, in the context of our verbal database. We use such concepts as definiens, which are very often connected with the definiendum in our verbal data base, since the concepts almost constantly connected in many different texts with the definiendum are relevant for the meaning of the latter. [24]
Since all the text units of a project result in an altogether very obscure and complex network, there is a useful need for simplification, which is possible in WinRelan. Starting with a certain key concept, the relevant terms connected with the start term can be selected in the selection window, expunging all other terms at the same time. An extremely meaningful and even automatic way to reduce complexity is to select only such connections, which occur several times. This leads to the fact that only those relations between terms are pointed out which can be confirmed by several text units.
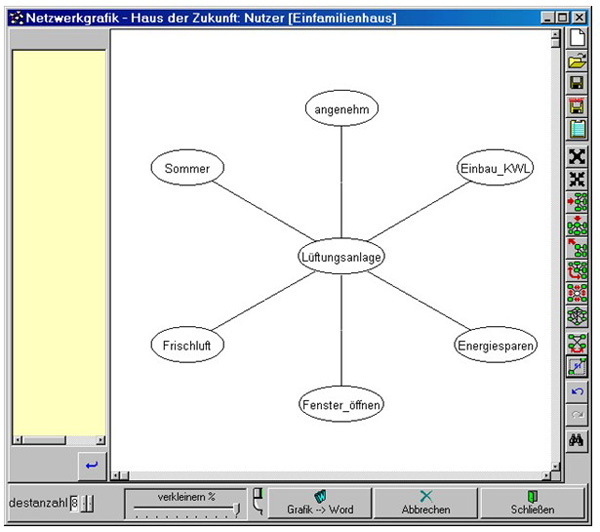
Figure 4: Association graph of the inhabitants of single-family houses. It shows the most frequent associative connections
linked with the term "ventilation system" [25]
In the graph of Figure 4, which was produced automatically from all texts of inhabitants of single family houses with the explicit content of "ventilation system" (Lüftungsanlage), we can see that the most usual associations to it (at least 8 denominations) claim that the installation of ventilation control systems contributes to saving energy, and allows constant flow of pleasant fresh air, particularly in the summer time, without the windows having to be opened. [26]
As previously mentioned, the association graph represents conceptual associations of a frequently occurring term, selected by the analyst. The association graph can be extended by taking specific terms as the center of a new network of associations (e.g. by "energy saving" [Energiesparen] in Figure 4). In this way "mindmaps" of social organizations can be constructed on the basis of the verbal data. Additionally, it can be drawn up and changed in color, form and description. If, in meta-linguistic coding, criteria for different groups are defined, it is at any time possible to compare the linguistic usage of terms by different groups, in order to determine possible common features and divergences. So one can also learn about the linguistic usage of terms in colloquial expressions, i.e. the use of central terms in relation to the situation and the organization of speech. [27]
5. Meta-Linguistic Coding. Representation of Statistical Frequencies
GABEK distinguishes two basic ways of coding: apart from the object-linguistic coding mentioned above, through which the lexically relevant terms are identified, there is the possibility of meta-linguistic coding (in a comparable way as in other qualitative data analysis software systems). The latter clearly stands out against object-linguistic coding, since relevant criteria or categories that do not have to occur in the text are assigned to the text. These can be:
Text-related criteria: These are categories to which contents of a text unit are attributed. Examples of text-related criteria could be: arguments in favor of a ventilation system, arguments against it, economic perspectives, technical features or definitions, theoretical concepts, examples, individual cases etc.
Names of individuals: These refer to the persons who formulated the text unit.
Criteria related to individuals: Finally there is the possibility of assigning attributes to individuals like age, sex, education, vocational qualification, etc. [28]
Thus, sections of verbal data can be selected and combined arbitrarily again—be it raw data or data already processed—and statistics can be produced.
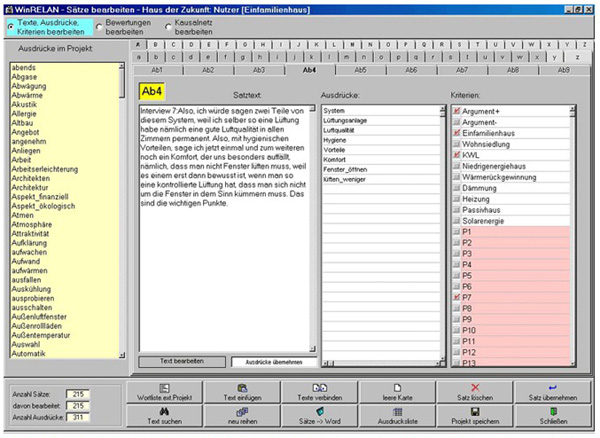
Figure 5: Window to edit the text unit "Ab4". It shows, how object-linguistic coding of a text unit by key terms (white fields
record text and terms) can be completed by criteria for text units (under criteria in the white field e.g. "argument+" and
"argument-" etc.) and by person designations (under criteria in the rosé field "P1," "P2"...) [29]
Meta-linguistic coding of all text units permits a direct analysis of the frequencies for all pairs of criteria or for any combinations of criteria, either in absolute values or in percent. The frequencies can refer to persons or records. In the following Figure 6 we refer to the specification of records in percent. For this we load the fraction documents of the single-family house inhabitants and the multi-family house inhabitants together. The outline resulting from it shows a remarkable difference: while the single family house inhabitants expressed 61,4% positive arguments for their ventilation system, the multi-family house inhabitants articulated only 38,6% positive arguments. In contrast to it the single-family house inhabitants brought forward 25,3% critical arguments, while the multi-family house inhabitants expressed 74,7% negative arguments. Thus, there is a salient difference that suggests analyzing not only the interviews of users and non-users of ventilation systems separately but also the interviews of users from single-family houses and those from settlements. With the representation of statistical frequencies GABEK offers an instrument which supports the decision to analyze different verbal data separately or in one.
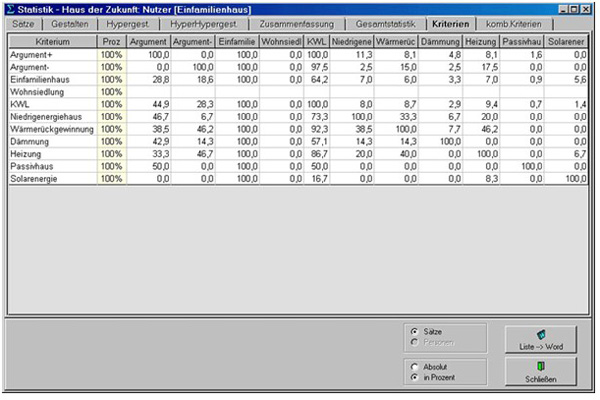
Figure 6: Statistical frequency specifications concerning text units (records) in percent for ventilation system users [30]
Beside the representation of frequencies, meta-linguistic coding above all permits the usage of any criterion for selecting partial documents. So we could form, if necessary, documents on solar energy use, passive houses, heating, insulation etc. or on combinations of these (according to Figure 6). In other projects, in which different criteria are used, one can differentiate e.g. between the predicates and results of analysis of men and women or those of employees and customers etc. and analyze them separately. On the other hand one can also combine separately analyzed data records and process them further as a whole. [31]
6. Coding of Evaluations. The Representation of Assessments by Means of an Evaluation Profile (Lists)
Normal linguistic expressions first of all contain descriptions. Furthermore common language expressions contain prescriptive judgments, and thus value judgments and norms. In order to represent prescriptive judgments of a verbal database clearly, apart from the basic coding (= object-linguistic and meta-linguistic coding) an evaluation coding procedure is necessary. This requires that we arrange features, states, situations, actions or processes that were either evaluated positively or negatively by the respondents in the form of lists. [32]
For coding of evaluations one can first distinguish four cases: [33]
In a text it is stated that a feature, an attribute or a state actually exists according to the opinion of an interviewee,
whereby this as really assumed state is evaluated positively (Case 1) or
negatively (Case 2). [34]
In addition, the opinion can be held that a feature, an attribute or a state does not exist really,
whereby an implementation of the possible feature or the only thought of, unreal state is required (Case 3) or
is feared, so that its implementation is unwelcomed (Case 4). [35]
Therefore we will answer two questions in the coding of evaluations: which real phenomena, attributes, states, situations, actions are expressed and how were they evaluated? And: which hypothetical phenomena—not assumed as real—are being expressed and how were they hypothetically evaluated?
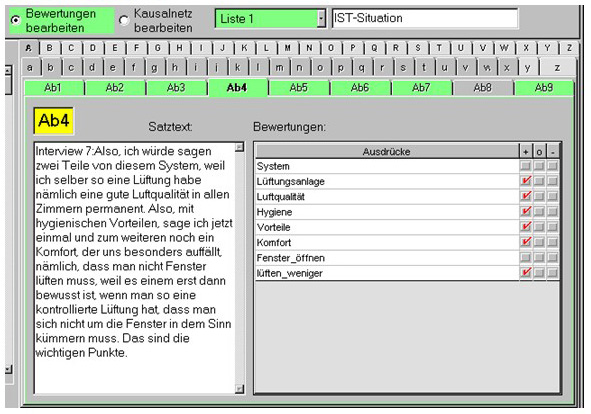
Figure 7: The evaluation analysis of the real situation according to Ab4. The current situation is judged positively in the
text Ab4 regarding "ventilation system," "air quality," "hygiene," "advantages," "comfort" and "less opening of the windows."
This is displayed on the right in the column titled with "+" [36]
If these operations are executed on all the texts available, then one receives an informative and differentiated estimate of the current assessments. Desires and concerns of the respondents are made explicit. [37]
For each feature the number of positive and negative evaluations can be listed. As to the glossary word "ventilation system" e.g. the inhabitants of single-family houses expressed 48 positive and only 2 negative evaluations. Moreover, they evaluated many other details: e.g. the fact that ventilation systems reduce energy consumption greatly and that they contribute substantially to energy saving was seen in a very positive way. According to the opinion of the respondents ventilation systems mean comfort, produce good room climate, guarantee a permanent supply of fresh air and lead to a pleasant air quality. Users of single family houses disliked that ventilation systems are too expensive, that too little information about ventilation systems is available and that the noise of the fans disturbs the peace.
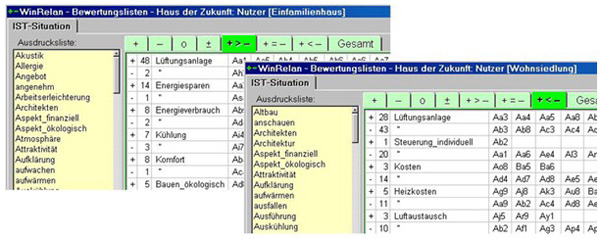
Figure 8: Evaluation of "ventilation system" by inhabitants of single family and of multi-family houses in the comparison
[38]
The evaluation of ventilation systems of inhabitants of multi-family houses was clearly more negative in contrast to the one of users of single family houses: They formulated 28 positive and 43 negative evaluations. Although they were committed to ecological living, for the existing ventilation systems the only thing they appreciated was the fact that one doesn't have to open windows—the ventilation system permanently introduces fresh air. [39]
The results of the coding of evaluations can be transferred in the form of lists into Word. Automatically formatted lists of the exclusively positively and predominantly positively evaluated features are possible, as well as such for exclusively negatively and predominantly negatively evaluated phenomena. Additionally there are combined lists and a total list, which are produced automatically. A small selection of the exclusively or predominantly positively and exclusively or predominantly negatively evaluated features of inhabitants of single family houses reads as follows. Here we present features only assumed to exist according the respondents:
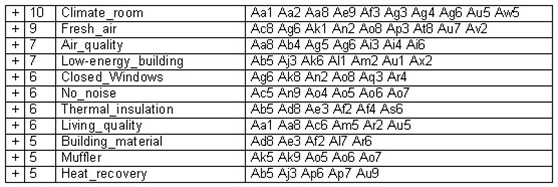
Table 3: The evaluations by inhabitants of single-family houses. Exclusively positive evaluations
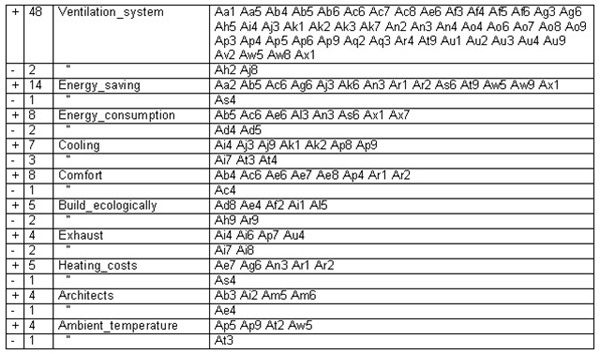
Table 4: The evaluations by inhabitants of single-family houses. Predominantly positive evaluations

Table 5: The evaluations by inhabitants of single-family houses. Exclusively negative evaluations
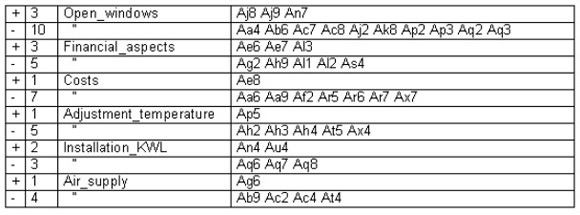
Table 6: The evaluations by inhabitants of single-family houses. Predominantly negative evaluations

Table 7: Evaluations altogether [40]
Finally it should be added that in the interviews no particular evaluations were requested. Rather, all evaluations were expressed intuitively in the responses to open interview questions. [41]
7. Causal Coding. The Representation of Causal Assumptions by Network Graphics
Apart from descriptions and evaluations in colloquial texts, causal assumptions are also expressed. These are opinions on cause-effect relations based on empirical experiences over time or discussions with other people. We can also see the causal assumptions of the respondents as a common sense set of explanations. [42]
In order to isolate causal assumptions from the verbal data, the electronically captured texts of each record sheet must be read again and coded in a new way. Expressions, which are linked by causal relations, are called causal variables or simply variables, since they refer to situations that are experienced as changeable. Of course causal analysis also depends particularly on the question of analysis. Ordinarily we will ask the question: Does the author of the text believe that the growth of the variable A leads to the increase or decrease of the variable B? Because there are very different normal language statements applicable to such coding, e.g. quantitative relations (in the form of "the more A, the more B"), real relations between cause and effect ("A is a cause of B"), qualitative relations specification ("if A improved, then the quality from B takes to"), statistical generalizations ("if A, then mostly also B" applies) and many others. In addition we can distinguish between causal influences that have either a favorable or an unfavorable effect on another variable. [43]
The causal coding is made on the basis of a square matrix, in which the key terms contained in a record sheet serve as line and column designations. If in the text a causal opinion is assumed, then the assumed influence is entered in the line of the influence variable and the column of the influenced variable as "+" or as "-," according to whether the influence of the variable in the line leads to an increase or decrease of the influenced variable in the column. [44]
Coding of causal assumptions leads to the description of complex cause—effect relations, which can be used in new situations for orientation. A multiplicity of executed projects showed that causal networks which represent hypothetical relations contribute substantially to preparation of decision planning in new situations.4)
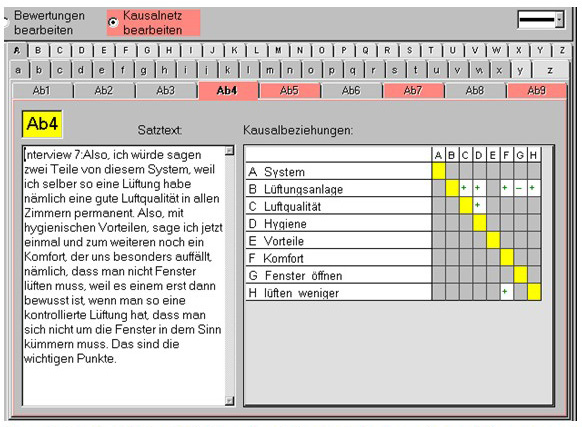
Figure 9: Causal analysis of Ab4. The author of the text Ab4 assumes that ventilation systems have a positive effect on air
quality, hygiene, comfort and on the fact, that one does not need to open windows anymore. Furthermore, the air quality leads
to better hygiene and not having to open the windows increases comfort [45]
As soon as all causal opinions have been entered into the appropriate stencils (see Figure 9), an automatically formed causal list is available. In this relations list causal variables are listed (cause and effect variables) with an indication whether the influenced variable is expected to increase or to decrease with the growing cause variable. Besides, a color can be assigned to each variable in the causal expression list. Different colors will be assigned to basic values, main goals, subordinate goals, measures or invariable basic conditions. There are formal guidelines for this, but it is the analyst who makes the distinction between the variables. Basic values for example are important for the development of mission statements and for orientation purposes, main goals serve the basic adjustment and justification of projects and intermediate objectives, and measures are needed for concrete implementation plans of the latter. [46]
Now causal assumptions can be plotted in a simple manner. For example, one can select a measure, such as the measure "information" in our project. Due to the evaluation analysis of the low-energy building project, the lack of information could be identified as a striking weakness in the marketing of ventilation systems. In order to represent all the consequences as expected by the respondents the causal graph shown in Figure 10 is drawn automatically. From Figure 10, it can be seen that more information has only positive (green) effects. An effect is also the reduction of ignorance, so that the many negative (red) consequences of ignorance are also indirectly reduced by information measures.
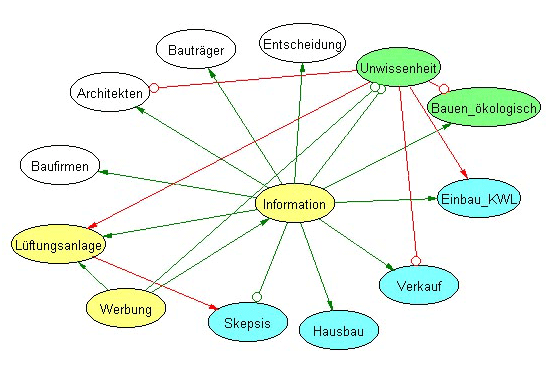
Figure 10: Printout of the information policies according to inhabitants of houses with ventilation system [47]
Thus, direct information can lead to the fact that sales increase and that more customers consider the installation of a ventilation system when building their houses. In any case, the existing ignorance would be drastically reduced. Architects, building companies and builders often know too little about the product. Here one could achieve more with advertisement and information. [48]
Besides proceeding from measures to their assumed consequences (see above), we can also take the reverse path and proceed from a basic value or a main goal and look for adequate measures. Each assumed causal relationship is supported by texts. By clicking the connecting arrows (cf. Figure 10) one can immediately read the texts in which the causal assumption was expressed. Graphs as well as texts can easily be transferred and printed out in Word (Figure 10). [49]
However, using WinRelan we do not only want to clarify terms, show frequencies and valuation lists or represent opinions over causes and effects. Rather we require a clear, holistic overview of the verbal data. In order to be able to better understand the overall situation, we will now form the verbal data into a hierarchically ordered "gestalten tree". [50]
8. The Gestalt-Building Process. The Representation of the Verbal Data by Linguistic Gestalten
To explain the conditions of linguistic understanding (cf. ZELGER, 1999a, 2000b) the process of perception is investigated. Our world is not perceived by isolated sense data but as Perceptive Gestalten (STUMPF, 1939, SMITH 1988)]. Accordingly linguistic expressions are understood not as isolated concepts but as coherent linguistic complexes, that is groups of statements forming meaningful wholes. Thus we can introduce the concept of a linguistic gestalt. [51]
A linguistic gestalt is an abstract entity. It presupposes grouping in parts. These parts are statements (i.e. relations between concepts). The linguistic gestalt can be distinguished from the larger linguistic context through the interrelation of the statements with each other. The linguistic gestalt is seen as a specific meaningful group of sentences, which fulfills the following conditions:
Formal connectivity: All sentences within the group are closely related to each other. For example, each sentence in the group must contain at least three key concepts, which also occur in other sentences of the same group (see Figure 11).
Formal variety: The sentences within the group must be sufficiently distinguishable from each other. Each sentence must contain something new so that it appears as a kind of complement to all other sentences in the group. This entails that, ba) each sentence in the group must be distinguished from all other sentences in the same group. Any pair of sentences S1 and S2 must contain at least three concepts which are not nodal concepts connecting S1 and S2. As a consequence any pair of sentences containing the same key concepts is forbidden (see Figure 12). bb) key concepts of one sentence in the group may not be included in the set of key concepts of another sentence in the same group (see Figure 13).
Formal distance: The group of sentences may not contain too many sentences in order that all relations between the sentences can be conceived as a unit of meaning. The necessary steps to reach from each sentence to every other sentence in the group may not exceed the maximum of two steps (see Figure14). [52]
The four above mentioned formal structures that infringe the formal rules are illustrated in figures 11 to 15. A circle indicates a sentence and a rectangle a key concept. Nodal concepts show the connections between sentences. [53]
According to the rule of formal connectivity (a) the structure (1) is forbidden. (2) and (3) are not allowed by the rule of formal variety (ba) and (bb). (4) is excluded by the rule of formal distance (c).
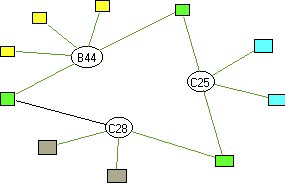
Figure 11: formal structure 1
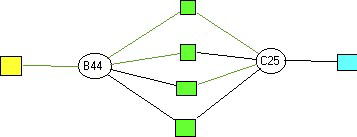
Figure 12: formal structure 2
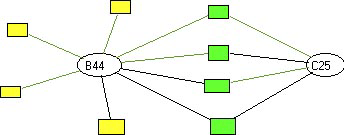
Figure 13: formal structure 3
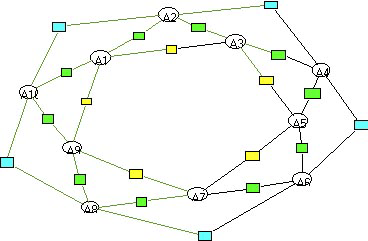
Figure 14: formal structure 4
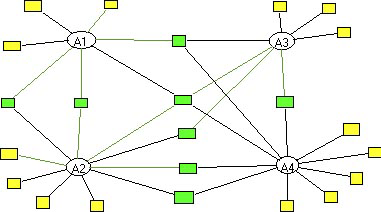
Figure 15: formal structure 5 [54]
Only the structure in Figure 15 fulfills all formal conditions of a linguistic gestalt. A linguistic gestalt must furthermore meet semantic and pragmatic conditions:
Semantic demonstrability: A group of sentences is rendered meaningful only if it is possible to demonstrate all relations between the sentences intersubjectively. Therefore, an ideal paradigmatic example must exist which fulfills all the conditions assumed. Particularly in communicative learning situations it is necessary to refer to models, examples, applications in a given modeling facility. "Modeling facility" refers, as suggested by PASK (1976, 1992), to the material immediately available to the individual, which he can use to produce observable units, e.g. models that represent all the relations assumed by the sentences in the group.
Pragmatic applicability: From a pragmatic point of view a group of sentences is relevant for an individual x in the situations s and at the point in time t only if the individual x believes in s and that all sentences together with their relations between each other are applicable as perception-, orientation- or action patterns. [55]
When analyzing texts it is not easy to comply with the above conditions. In particular the rules of formal variety and formal connectivity oppose each other. But they lead to a kind of equilibrium. The more the sentences are internally differentiated, the more likely they are not sufficiently internally networked. And: the closer the network, the more likely the internal differentiation does not suffice. The PC-program WinRelan provides interactive methods to select groups of sentences from the unsorted verbal database that fulfill the rules for linguistic gestalten. [56]
The reader may probably ask now, how gestalten can be formed from unordered interview responses. It should be obvious that we begin at the level of the raw data: [57]
First, a cluster analysis is executed on the records through which provisional text groups are formed. Interview responses that contain many common key terms are brought together to a chunk of texts automatically. Then the analyst views each text group in detail and reworks these to a meaningful group of texts free of contradictions. The automatically formed clusters are loaded so that their records can be read. Then, mismatching records from the cluster are eliminated while others are added. Different types of procedures of navigating the entire linguistic data are offered. Thus a meaningful text group is formed. Finally, if the predetermined syntactic and semantic rules are fulfilled, a summary of the text group is formed which logically follows from the text group. The summary formulated by the user is a text on the next higher level. If all texts have been processed in this way, a set of summaries will be available on which the cluster analysis is again executed. The cluster is transformed on this level to a hypergestalt, which again fulfills the rules of gestaltbuilding, etc. [58]
In order to get a coherent and holistic representation of the verbal data base all responses are compressed to hierarchically structured text groups and represented in form of a gestalten tree. This is a hierarchical order of texts generated step by step from bottom to top by the GABEK method. [59]
As in a puzzle, sections (in WinRelan statements, i.e. responses) are arranged into a picture. These pictures—(in WinRelan thematically interconnected text groups, which due to fulfillment of certain semantic, syntactic and pragmatic rules, are called linguistic gestalten—viz. ZELGER 1999a, 1999b)—again serve as puzzle pieces for the construction of even larger pictures. The large pictures (linguistic hypergestalten), which result from this information-compressing process, are finally joined to form an overall view (gestalten tree). The gestalten do not, however, merge all responses of the people interviewed, since redundant or hardly interlaced predicates cannot be used. Thus, it is a puzzle with some pieces left over, for example because there are several pieces of the same form and color (redundancy of the records) or because pieces from different puzzles are mingled with each other (lacking thematic networking of the records). Ideally, a gestalten tree with four or five levels is produced (see Figure 16).
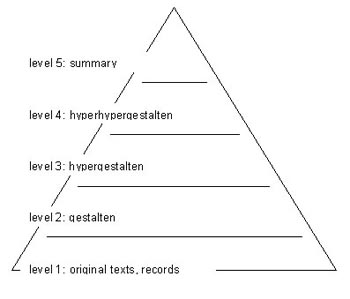
Figure 16: Structure of a gestalten tree [60]
On the highest level of the gestalten tree for the low-energy building project, the most important results of the investigation are summarized in short texts. These are general trends similarly expressed in many interviews. [61]
If we regard the opinions of the inhabitants of multi-family houses with ventilation systems, we find the following two texts, which can be regarded as total summaries, on the 4th level of the hyperhypergestalten. If someone who has only a minute to spare asks for the result of the project, he can be given an answer with the aid of the following two texts, fully representing the result of the GABEK-analysis still in object-language as spoken by respondents:
Hyperhypergestalt "Individual control": The tenants complain about the fact that ventilation systems—particularly if they are built into complexes of residential buildings—are not individually controllable. One rather wants to be able to switch the system on and off. In order to ensure the satisfaction of the tenants, therefore the individual controlling of the system must be possible in each dwelling.
Hyperhypergestalt "Ignorance": Many tenants know too little about ventilation systems. Also, when they moved into their dwelling many were neither informed about the installation nor about the mode of operation of the system. Therefore there should be an intensified information policy on how a ventilation system really functions, what it can do and whether the installation itself is financially rewarding. [62]
If someone asks for a justification for these two texts, then one can go to the level 3 of the gestalten tree. There, the hypergestalten are situated, which describe the individual ranges of topics in greater detail. Below them, on level 2, there are texts, which are called gestalten. Here ranges of topics from the analyzed data are represented in detail. Finally, on level 1 there are the original texts of the people interviewed. So, for each individual text between level 2 and 4 (with larger quantities of possible applications up to the level 5 as these texts are more general) there is a group of responses which can be used as a justification basis. Each level supplies a more or less complex representation of the total situation. All summaries of the levels 2 to 5 are thereby formulated in the "everyday-language of the people". This methodically founded procedure makes it possible for the people concerned to find themselves within a complex opinion network and thus understand themselves and other people better. The gestalten tree of the users of ventilation systems in multi-family houses looks as follows:
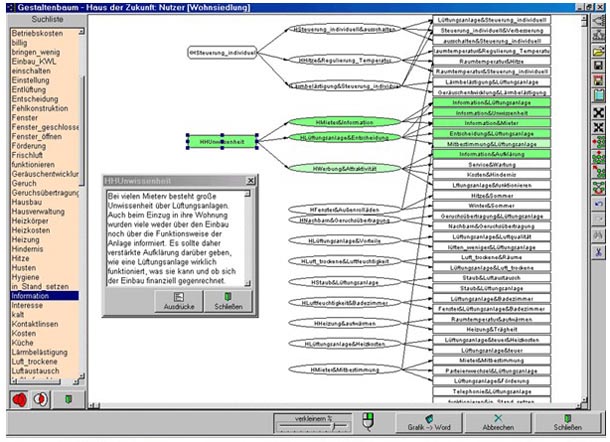
Figure 17: Gestalten tree on all texts of users of multi-family houses. The occurrence of the key term "information" in the
respective gestalten, hypergestalten and hyperhypergestalten is emphasized in green. The appropriate text is opened by clicking
any field [63]
Selecting any key concept of the gestalten-tree all the texts are marked where the key concept occurs as shown in Figure 18:

Figure 18: Texts, which justify the summary quoted above as "non-individual-control" [64]
We can now justify the hyperhypergestalt: "Individual control" mentioned above, by three texts at level 3:
Hypergestalt "Individual control and switch off": Above all ventilation systems should be individually adjustable and the adjustments adaptable, if they are built in a complex of residential buildings. They must be more customer-oriented, because some tenants want to switch on and off the system themselves.
Hypergestalt "Heat and temperature adjustment": There are problems with the adjustment of the ambient temperature, because the temperature cannot be controlled individually in any dwelling. Therefore the tenants complain about the heat which results from the uniform adjustments of the centralized control (particularly at night) in the dwellings. Often the window is opened to let some air in. It would be necessary that one can adjust the temperature in each dwelling individually.
Hypergestalt "Noise disturbance and switch off": The noise of the ventilation system is felt as noise disturbance. Thus many tenants are not content. In order to optimize the ventilation system, a individual control of the adjustment of the force of circulation is necessary in all spaces of each dwelling. It should also be possible for the system to be switched on and off by each tenant. [65]
If one of these texts is questioned, it can be justified, too. If someone wants to know more about the hypergestalt: "Noise disturbance and switch off", for instance, we show the following texts, so-called "gestalten" on the PC on level 2, from which it is derived:
Gestalt "Noise disturbance and ventilation system": The noise of the ventilation system is felt as noise disturbance. There is inevitably a basic volume all day and night in all rooms. That leads to the fact that the tenants are not so content.
Gestalt "Noise and Noise disturbance": The automatic ventilation of the ventilation system leads to a permanent noise. That is felt as noise disturbance. Since not all the neighbors or tenants did feel disturbed by noise, it is not possible for the ventilation company to implement modifications. Therefore individual control possibilities and a construction of better air passages are being demanded.
Gestalt "Individual control and improvement": The controlling of the ventilation system is worth improving. The system cannot be made quieter or switched off for individual dwellings. Generally it can be said that it would be better, if the ventilation were to be controlled by the tenants themselves.
Gestalt "Ventilation system and individual control": Ventilation systems should be individually controllable and the adjustments better adjustable. The system cannot be switched off completely in the individual dwellings or spaces. That is not very pleasant for many tenants. In order to optimize the ventilation system, individual control options of the adjustments of the injecting strength would be necessary in all spaces. [66]
Even on this level one could still ask for a justification: Is the gestalt: "Noise and Noise disturbance" not the bare opinion of the text editor who wrote the summary—although he did it according to strict rules? In the gestalten tree (Figure 17 and 18) the texts of the gestalten are finally justified by authentic responses. For the gestalt: "Noise and Noise disturbance" these are:
Record sheet "Aq2": We have such an extreme noise, which is really disturbing. Unfortunately not everyone is disturbed by it, only my neighbor feels it too and that is permanently.
Record sheet "Am3": Outside in the anteroom air is coming out—as my neighbor always said, like the Scirocco so loud. The ventilation in the attic has been adjusted rather strongly and thus it is blowing rather loud. If one holds a sheet of paper against it, then that flies away immediately and makes an incredible noise.
Record sheet "Am4": It was a continuous noise. And I only noticed it later—after one year—that it actually rather disturbs me. I imagined that this couldn't possibly be acceptable. I called the ventilation company to see whether they could switch it down, but they just said: then one would have to ask everyone.
Record sheet "Au2": When a strong wind blew, such a strong noise was always to be heard. And the ventilation is in the bathroom and so there was a hell of a noise actually and thereupon we complained to the housing management. We stated what occurred and then they employed a ventilation company. They came and since then one cannot notice anything anymore.
Record sheet "Az7": What the people from the ventilation company could improve is the exhaust, as it sometimes whistles very loud. I could imagine that one could design better air passages. [67]
In the GABEK procedure, a description of the phenomenon under investigation thus takes place on different complexity levels. If the reader of a GABEK project report wants an overview on the results, he can look at the texts on the highest levels. If he however wants to have detailed answers to questions, he will go on to deeper levels. This is because each text of the levels 2 to 5 is a summary which was created by the editor in accordance with clearly defined rules and which can logically be derived from the texts on which they are based.
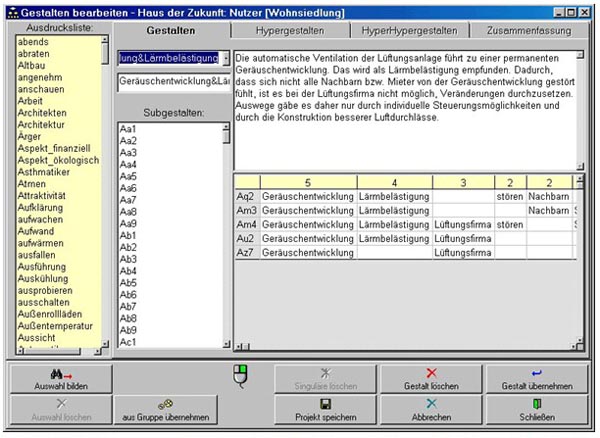
Figure 19: Window for editing gestalten. On the basis of a text group formed by cluster analysis the editor builds a meaningful
"linguistic gestalt" (cf. Figure 12) [68]
If the shaping process is finally completed, simply clicking on fields of any level can provide an all-encompassing overview. The outline, however, can be viewed at different levels of complexity at the different gestalt levels. The further we move upward in the gestalten tree, the fewer details are contained in the summaries. Only the lowest level of the raw verbal data contains all details available in the project. [69]
9. Relevance Criteria. The Representation of the Order of Relevance
We have already become acquainted with an abundance of different results. But now the question arises which topics are really important from the view of the respondents. What does the main user group consider to be central? Which results have to be considered under any circumstances? If we want to know what is particularly important and relevant to the users and non-users, then GABEK supplies unique results. For weighting the topics we use three criteria:
Topic A is judged more relevant than topic B if A reaches a higher level in the gestalten tree. The reason for this criterion is that output on higher levels (hyperhypergestalten or hypergestalten) are applicable in more cases than output on lower ones (gestalten or responses).
Topic A is judged more relevant than topic B, if A is evaluated more often by the respondents as positive (or negative) than B.
Topic A is judged more relevant than topic B, if A is embedded in more causal relations than B, i.e., if A has more effects or causes than B.
A topic that ranks high on all the three criteria is certainly very important in the minds of the respondents. [70]
From these a relevance list is generated that indicates at a glance which topics are of special interest to the persons concerned (viz. ZELGER 1999c, 2000a).
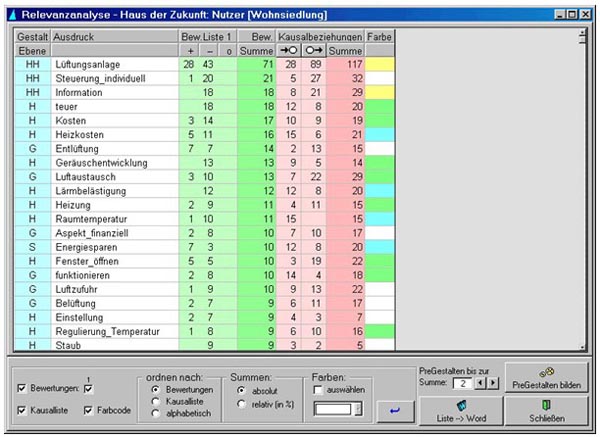
Figure 20: Relevance list of inhabitants of multi-family houses [71]
The lists shown in Figure 20 are divided into five areas, whereby the highest level of the gestalten tree is indicated in the 1st column (blue). In the 2nd Column (white) the appropriate term is displayed; in the 3rd to 5th column (green) the number of the positive and negative evaluations is mentioned; in the columns 6 to 8 (red) the number of causal relations and finally, in the last column, the assigned colors (color coding) are pointed out. [72]
Figure 20 shows the marketing-relevant factors as assumed by the inhabitants of multi-family houses. From this overview it can be derived that for users of ventilation systems in multi-family houses negative aspects predominate (column 4). Based upon the results of the relevance analysis, the targets and measures specified by the respondents can be selected and proposals for solutions can be compiled which are in conformity with the basic values of the people concerned. [73]
One can select the topics, which are felt to be of particular importance and can then draw automatically the assumed effects of the topics or possible measures to further advance these in causal network graphics. One can choose also the relevant context in the gestalten tree. This way not only ensured that we continue to process important topics and keep an eye on them during their implementation, but it is also made possible that we include the important context of these topics and thus understand the problem of the situation in greater detail. [74]
10. Project Comparison. The Simulation of Dialogues
We have already demonstrated distinct differences in the opinions between inhabitants of single-family houses and multi-family houses on the basis of the evaluation lists and the statistical results. There are further differences if we take into account the interviews with the people who were informed about ventilation systems but who nevertheless did not decide for such. We will now demonstrate how these opinions of opposite groups can be compared. [75]
The WinRelan sub-program "Project Comparison" presupposes that a database or several verbal data records have already been analyzed in the form of gestalten trees. If this has been done, the program can serve many different functions. It can be applied to look up texts that are comparable, similar, opposite or contradictory with regard to a predetermined text unit. It can be used as a learning tool, i.e. a tutorial, for example, when a young employee is to be introduced fast and effectively to customs, experiences, or the linguistic usage of an enterprise or of a branch far away from the headquarter. The program is also suitable for the introduction to a complex theory of the humanities or social studies, or it can be used as a program for the innovative and unusual linkage of ideas. However, the simulation of dialogues and the associated coping with conflicts between groups is intended to be the core application of the program (see ZELGER 2000b for further details on dialogue theory). [76]
For this we load the projects of the conflicting groups A and B next to each other into the sub-program "project comparison". For each project three fields are available on the display. In the first field the gestalten tree emerges which can be more or less unfolded. It covers the whole knowledge that is available in the project A, in the sense of "tacit knowledge". If one opens the gestalten tree and selects a text—on any level—, the key terms of the selected text appear in a second field. They represent the "focus of our attention," that is our conscious contents at the given point in time. Simultaneously, the appropriate text, which contains the key terms, appears in the third field as a product of the basic knowledge (tacit knowledge) and of the conscious key terms. [77]
If we want to react to a preceding text of a project A with a text of project B, this cannot take place arbitrarily. Rather, a response should contain some key terms that were used in the text of A. The ideal case is a response containing 3 terms that occurred in the preceding expression. Therefore, we define the "area of possible linguistic reactions in relation to a preceding expression" as that part of a gestalten tree in which only texts occur that have at least one term in common with the preceding statement. [78]
In the sub-program "project comparison" we are able to produce the area of possible linguistic reactions regarding the preceding statement by clicking on the "telescope" (as a symbol for the restriction of the gestalten tree to statements which are connected to the preceding statement by nodal concepts).
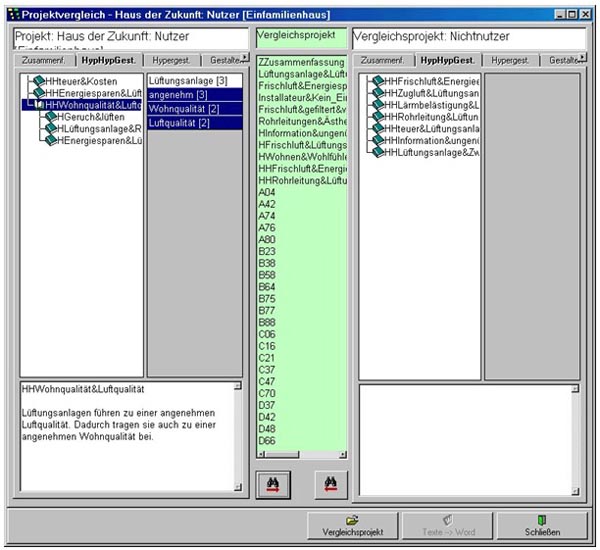
Figure 21: Project A with a partly unfolded gestalten tree (on the very left), with the text of the hyperhypergestalt: "living
quality and air quality" (bottom left) opened. The middle list on green background displays all the texts of project B in
which at least one key term of the displayed text of A occurs. This list is arranged according to the frequency of the hit
terms [79]
In Figure 21, the middle field indicates the "area of possible responses" from project B to the hyperhypergestalt: "living quality and air quality" of project A. In order to find a response to this text, we click on any text designation in the center zone (green), possibly on the top since many hit terms can be expected there, and because the texts there come from hypergestalten or gestalten of B with concepts occurring also in the preceding text of A. The selected text now appears in the right text field of B, whereby hit terms are marked in light blue. [80]
If one clicks on the telescope with the arrow pointing to the left, the "area of possible reactions" from project A appears. In the same way we can react with a text of project B in the center zone using the telescope with the arrow pointing to the right. Texts from the two projects referring one to another are produced alternately. In addition, an example of a simulated discussion between users and non-users of ventilation systems is given:
A: Ventilation systems lead to a pleasant air quality. Thus they contribute also to a pleasant living quality.
B: A ventilation system automatically brings fresh air into the dwelling. It is free of pollutants which is of advantage particularly for people with allergic reactions. Besides the fresh air is preheated. Additionally a ventilation system also helps to save energy.
A: A positive aspect of ventilation systems is that one has a very good air quality in the bedroom through the supply of fresh air. Even with closed windows a constant air interchange is ensured. The substantial difference to air coming through windows is therefore that one can sleep with closed windows that there is no unpleasant smell in the room and that one is always supplied with pleasant fresh air.
B: And this process is also connected with less heat loss; the ventilation system thus helps also to save energy.
A: Ventilation systems help to save energy. According to certain insulation standards, low-energy buildings function exclusively through the ventilation system by lowering the energy consumption through heat recovery. A ventilation system therefore offers a substantial comfort increase, because low energy consumption or energy saving is understood as comfort. [81]
As shown in the example, even in opposite groups like here of users and non-users of ventilation systems there are often contents on which they agree. This is emphasized when striving for conflict handling. Such discussions can be summarized as a consensual result according to the rules of the linguistic gestalt formation (ZELGER 1999a, 1999b). [82]
However, if discussions are simulated in which contrasts become clear, one will ask for reasons. Such questions can easily be answered by the deductive structure of the gestalten tree. For example, a question for justification of the introducing statement hyperhypergestalt: "living quality and air quality" from A would be answered by the three texts hypergestalt: "smell and open windows", hypergestalt: "ventilation system" and hypergestalt: "individual control" (see Figure 21). [83]
Basically, when there are conflicts between two groups, each group will first be presented with their own results. In the second step one demonstrates the points of agreement to both parties. It is not until later that one would also try to show each party the opinions and arguments of the other party, so that they reach a mutual understanding. Such procedures have already contributed to conflict resolutions in difficult situations (POTHAS & De WET 1999). [84]
In conclusion we would like to cite a few sample projects to indicate the variety of applications of GABEK. [85]
GABEK has been used for evaluation purposes (of the Italian Ground School Reform in South Tirol), for quality control (in a hospital), for product evaluation (of vehicles), conflict resolution (in South African Industries); furthermore there have been projects on goal development (of a university), minority research (in South Tirol) and town research (Tepito in Mexico City). Acceptance research in Georgia, Holland and Germany, intercultural management in Thailand, China, Brazil, Europe and market research in South Africa and Austria have also belonged to the standard applications. Projects on organizational and staff development and innovation research are also in the core research area of GABEK. Finally, there were a number of projects on medical ethics, clinical psychology, sports medicine, school didactics for different fields, personality psychology and research on marginal groups. [86]
In all these different projects we work on the assumption that social and political decisions should be based on the experiences of as large a number of people as possible who are likely to be affected by the decisions. This assumption expresses a degree of respect towards each other and a willingness to abstain from enforcing one's own solution to a problem by sheer might. A fundamentally democratic conviction is a precondition of a GABEK project. This also points to a goal that is pursued through GABEK projects: the attempt to increasingly include the basis of social organizations, when innovations are to be implemented and to take into account other people's opinions and thus to encourage positive emotional ties between members of the organizations. This should enable a community to develop. [87]
1) WinRelan was developed for GABEK-applications by Josef SCHÖNEGGER and Josef ZELGER, Innsbruck 1991—2002. <back>
2) Please excuse the German texts in the figures. We are presently developing a new version of WinRelan which permits the choice of languages in the interface. Furthermore, the sample project used for illustrative purposes was conducted in German. We have reason to assume that the individual program steps and functions have been provided with a sufficiently detailed description to ensure the understanding of German text based examples. <back>
3) A term is relevant if one cannot eliminate it without changing the central topic (in the cognitive sense) of the statement. <back>
4) This type of coding of relations is mostly used for the representation of causal opinions. It can, however, also be used for other purposes. Principally, one can represent each type of relations between two variables e.g. relations between operations and results or between persons communicating with each other etc. Furthermore process plans, for which temporally arranged relations between operations, prerequisites of operations and results of operations are being coded, can be represented on the basis of experiences of employees. <back>
Pask, Gordon (1976). Conversation Theory. Amsterdam: Elsevier.
Pask, Gordon & de Zeeuw, Gerard (1992). Interactions of Actors, Theory and some Applications. Vol 1: Outline and Overview. Universiteit Amsterdam: Man.
Polanyi, Michael (1969). Implizites Wissen. from the American by Horst Brühmann. Frankfurt: Suhrkamp.
Pothas, Anne-Marie & De Wet, Andries (1999). Möglichkeiten der Zusammenarbeit in einer Konfliktsituation. In Josef Zelger & Martin Maier (Eds.), GABEK. Verarbeitung und Darstellung von Wissen (pp. 137-151). Innsbruck/Wien: Studienverlag.
Rohracher, Harald; Hochgerner, Josef; Schot, Johan; Zelger, Thomas; Lipp, Bernhard; Gadner, Johannes; Buber, Renate & Zelger, Josef (2001). Akzeptanzverbesserung von Niedrigenergiehaus-Komponenten als wechselseitiger Lernprozess von Herstellern und AnwenderInnen. Projekt im Rahmen des Programms Haus der Zukunft des Bundesministeriums für Verkehr, Innovation und Technologie. Mit Unterstützung des Österreichischen Bundesministeriums BMVIT.
Smith, Barry (1988). Gestalt Theory: An Essay in Philosophy. In Barry Smith (Ed.), Foundations of Gestalt Theory (pp.11-81). München/Wien: Philosophia.
Stumpf, Carl (1939). Erkenntnislehre, Bd. 1. Leipzig: Johann Ambrosius Barth.
Zelger, Josef; Pothas, Anne-Marié; De Wet, Dries & Petkov, Don. (1999). Conceptualization with GABEK: Ideas on Social Changes in South Africa. In Lotfi A. Zadeh and Janusz Kacprzyk (Eds.), Computing with words in Information. Intelligent Systems II: Applications (pp.484-499). Heidelberg/New York: Physica Verlag.
Zelger, Josef (1991). A Holistic Method of Mastering Complexity. In Hans E. Klein (Ed.), Managing Change with Cases, Simulations, Games and other Interactive Methods (pp.255-267). Boston: WACRA—World Association for Case Method Research and Application.
Zelger, Josef (1994). Qualitative Auswertung sprachlicher Äußerungen. Wissensvernetzung, Wissensverarbeitung und Wissensumsetzung durch GABEK. In Rudolf Wille & Monika Zickwolff (Eds.), Begriffliche Wissensverarbeitung. Grundfragen und Aufgaben (pp.239-265). Mannheim: BI Wissenschaftsverlag.
Zelger, Josef (1995). Cognitive Mapping of Social Structures by GABEK. Science and Science of Science, 88-104.
Zelger, Josef (1999a). Wissensorganisation durch sprachliche Gestaltbildung im qualitativen Verfahren GABEK. In Josef Zelger & Martin Maier (Eds.), GABEK. Verarbeitung und Darstellung von Wissen (pp.41-87). Innsbruck/Wien: Studienverlag.
Zelger, Josef (1999b). GABEK. A Method for the Integration of Expert Knowledge and Everyday Knowledge. In Dorien De Tombe & Elmar Stuhler (Eds.), Complex Problem Solving. Methodological Support for Societal Policy Making (pp.20-45). München/Mering: Hampp Verlag.
Zelger, Josef (1999c). Wissensverarbeitung in Organisationen durch GABEK. In Markus Schwaninger (Ed.), Intelligente Organisationen (pp.339-356). Berlin: Duncker and Humblot.
Zelger, Josef (2000a). Twelve Steps of GABEKWinRelan. A Procedure for Qualitative Opinion Research, Knowledge Organization and Systems Development. In Renate Buber & Josef Zelger (Eds.), GABEK II. Zur qualitativen Forschung. On qualitative research (pp. 205-220). Innsbruck/Wien: Studienverlag.
Zelger, Josef (2000b). Parallele und serielle Wissensverarbeitung: Die Simulation von Gesprächen durch GABEK. In Renate Buber & Josef Zelger (Eds.), GABEK II. Zur qualitativen Forschung. On qualitative research (pp.31-91). Innsbruck/Wien: Studienverlag.
Prof. Dr. Josef ZELGER: Studies in theology, physics, psychology, philosophy at the University of Innsbruck. Professor of philosophy at the University of Innsbruck since 1983. Lectures in the fields of ethics, philosophy of science, theory of knowledge, qualitative research methods, philosophy of language, decision- and action theory. Co-editor of CONCEPTUS. Zeitschrift für Philosophie 1967-1994. Head of the Department of Philosophy at Innsbruck University 1988-1990. Development of different methods for complex problem solving in small groups and its application in companies, schools and other institutions 1986-2001. Development of GABEK, a PC-supported procedure for qualitative opinion research and systems development and its application since 1990. Applications: e.g. product development in a big German motor-car company, organization development in Austrian schools, evaluation of the Italian elementary school reform in South Tirol, Italy, quality management in a regional hospital in South Tirol. Introduction to the GABEK method and supervision of about a 150 projects of 16 disciplines in 14 countries.
Contact:
Josef Zelger
Section Knowledge Organization
Department of Philosophy
Leopold-Franzens-University Innsbruck
Innrain 52
6020 Innsbruck, Austria
Phone: +43 / (0)512 / 507-4021
Fax: +43 / (0)512 / 507-2891
E-mail: josef.zelger@uibk.ac.at
URL: http://www.gabek.com
Mag. Andreas OBERPRANTACHER: Studies in philosophy, history, ethnology, world literature at the University of Innsbruck. Project assistant of philosophy at the University of Innsbruck since 1999. Lectures in the fields of history of philosophy, ethics and qualitative research methods. Working on the research project "Identity and perspectives for the future of the linguistic communities in South Tirol," 1999-2002.
Contact:
Andreas Oberprantacher
Section Knowledge Organization
Department of Philosophy
Leopold-Franzens-University Innsbruck
Innrain 52
6020 Innsbruck, Austria
Phone: +43 / (0)512 / 507-4021
Fax: +43 / (0)512 / 507-2891
E-mail: andreas.oberprantacher@uibk.ac.at
URL: http://www.uibk.ac.at/c/c6/c602/english.html
Zelger, Josef & Oberprantacher, Andreas (2002). Processing of Verbal Data and Knowledge Representation by GABEK®-WinRelan® [87 paragraphs]. Forum Qualitative Sozialforschung / Forum: Qualitative Social Research, 3(2), Art. 27, http://nbn-resolving.de/urn:nbn:de:0114-fqs0202272.
Revised 6/2008